|
Introduction
Since the early 1990s we have been studying the evolution of Quasi-Linear Convective Convective Systems (QLCSs) and bow echoes across the Mid-Mississippi Valley region. As part of our study we have also surveyed a few cases outside our County Warning Area (CWA) across parts of northern and central Illinois. The first conceptual model of the bow echo was derived from Dr. T. Theodore Fujita from the University of Chicago in the late 1970s. After studying a number of observational data sets across the Midwest in the 1970s, he developed a conceptual model of the reflectivity pattern of a bow echo. His conceptual model shows three stages of the bow echo: 1) tall echo, 2) bow echo, and 3) comma-echo stage. Downburst winds near the trailing side of the convective line are the cause of the bow shaped echo. In a number of cases he documented, tornadoes near or north of the apex of the bow echo. The size of bow echoes can vary from 10s of km to as large as 100 km. One of the early examples of a downburst with a tornadic mesovortex located downshear from a highly reflective bow and on the north side of a downburst occurred on June 25 1979 during the "Northern Illinois Meteorological Research On Downburst" (NIMROD project) in 1979. This project entailed three research Doppler radars which covered an area south and west of O'Hare Field including parts of Cook and Dupate Counties in Illinois. Dr. Ted Fujita was the leader of this project. A lot on the understanding about downburst winds was obtained during this project.
In inquiries from students, public and other groups we show Dr. Fujita's work showing thet deminsions of a downburst, microburst, and burstswaths a web link has been created to help understand what these terms represent. After the NIMROD project, Dr. Ted Fujita, Dr. Roger Wakimoto and Dr. Greg Forbes along with other students continued to investigate additional downburst cases from arieal surveys across the Midwest. In 1981 they were able to classify five scales of downburst damage patterns from a family of downburst clusters (over 500 nm) to burst swath (100 - 200 yards long). More specific information on three of five scales of downburst damage patterns (downburst, microburst, and burst swaths) are shown here. The historic May 8, 2009 Derecho (or Landcane defined by other meteorologists) that traveled from southeast Kansas through southern Illinois showed numerous examples of burst swaths within a microburst over parts of south-central and southeast Missouri. There was complete deforestation within the burst swaths over parts of south-central and southeast Missouri (very impressive) in which surface winds were estimated between 100 and 120 mph. A large mesovortex known as a "bookend vortex" was responsible for the extensive wind damage. Many witnesses stated that the strong winds lasted over 30 minutes.
Some examples of damage assessments are shown on the following weblink (almost there). .
Recent Work with Dr. Nolan Atkins and WFOs Springfield MO (SGF) and Tulsa OK (TSA):
Here at WFO LSX we have expanded upon Dr. Fujita's early studies of the bow echo, examining the structure and evolution of bow echoes and bowing segments and where mesovortices may form along the line. We are closely investigating reflectivity and Doppler velocity clues: relationship between very strong low-level reflectivity gradients, Rear Inflow Notch (RIN) evolution and mesovortex initiation and upscale growth. Recently, Dr. Nolan Atkins from Lyndon State College (Lyndonville Vermont) has completed some promising results simulating the genesis region of low-level mesovortices along the leading edge and just north of the apex of the developing bow echo and its relation to the descending mesoscale Rear Inflow Jet (RIJ) (Click here). He specifically points out that mesovortices often form just behind the leading gust front within the strong theta-e gradient region.
In a number of our afternoon through evening "warm-season" QLCS cases (large bowing convective systems) from 2000 to today, the long-lived mesovortices which formed near or just north of the apex of the bow have spawned two to even three tornadoes. In contast, several short-lived mesovortices were often non-tornadic.Atkins et al 2004 and Atkins et al. 2005 has shown this trend through Historgrams (10 June 2003 St. Louis Bow Echo case). In contrast, some (not all) of the late evening and early morning QLCSs reveal a different trend in which short-lived mesovortices have spawned QLCS tornadoes and caused EF0 to EF2 damage. In a recent local study presented at the NWA Annual meeting (2011) Fred Glass (WFO LSX) investigated both supercells and bow echoes, and has shown that mesovortices associated with small short-lved bow echoes can spawn weak tornadoes. More on this issue below with the August 27, 2007 Chicago tornadic case and the early morning May 13, 2010 Tulsa Oklahoma bow echo event (See below) .
We have had a number of recent (warm season) QLCS - bow echo cases during the later half of June 2011 with most of them occurred during the late night or early morning hours. This period of QLCS evolution appeared to be some what similar to the June 1998 period of QLCS evolution concerning the number of cases that occurred. We are able to further test Dr. Atkins numerical simulation results not only on mesovortexgenesis but also on the degree of stability of the lower boundary layer. In a few of our cases in June 2011 witnesses gave us valuable information concerning the length of time strong to severe surface winds occurred after the passage of the leading convective line. We ask the question, does the mature mesocale RIJ play a role for the prolonged period of strong to severe winds after the passage of the leading convective line?
Another important question we ask ourselves concerns the evolution of the reflectivity feature (Rear Inflow Notch-RIN) located along the trailing side of the bow echo. In some cases, does the presence of a sharp RIN become a pre-cursor to tornadogenesis which may occur just north of the apex of the bow echo. .The RIN is a reflection of part of the descending Mesoscale Rear Inflow. We will show a few cases to reveal that this reflectivity feature might become a possile precursor to tornadogensis, particularly when viewing storms at distant ranges from the radar (e.g. (> 60 n miles). In recent work with Jason Schumann (Lead Forecaster WFO SGF) - Jason has shown that along the leading edge of a convective line a mesovortex can develop near or north of the leading edge of a small reflectivity surge. This reflectivity surge may be the outgrowth of convective-scale downdrafts and a part of the mesoscale RIJ.
Work with WFO Springfield MO (SGF)
We continue to work with Jason Schumann (Lead Forecaster) at WFO Springfield Missouri on the 08 May 2009 Super Derecho event which produced a swath of extreme damaging winds lasting as long as 30 to 40 minutes. We are investigating a number of tornadic mesovorticies which initially form along the leading convective line then evolved rearward with time but continued to remain anchored to the surface convergence zone. A large swath of nearly continuous severe wind damage lasting over 30 to 40 minutes (communications from witnesses) occurred along and south of the eastward moving large Book-End Vortex. Concentrated severe damage occurred along the path of the individual mesovortices where tornadoes occurred. In reviewing high resolution Doppler velocity data from KSGF, the first mesovortex core formed near the apex and aloft between 1.5 and 2.5 km south-southeast of KSGF. The second and third mesovortices which formed south of the first mesovortex developed near the apex of the bow. Both of these mesovortices originated at or below 1.5 km. M1 through MV3 (see Vr time-height traces for M1, M2, and M3) formed in the balanced region betweeen the system cold pool (region of strong descending RIJ) and ambient shear. Convective towers are nearly vertically erect or slightly tilted downshear in the vicinity or just north of the apex of the large bow. More as to why the apex of the bow moves southward with time will be fotth-coming. More cases usng high resolution Doppler velocity data will be needed to further support these early findings. See AMS preprint paper on the 08 May 2009 event in the publication section
|
|
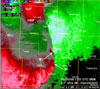 |
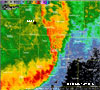
Fig 1. May 08, 2009 super Derecho event over southwest Missouri.
(click on image for a larger image)
Study and Application of the 0-3 km Shear Vector Tool
Another component of QLCS study with Jason Schumann at WFO SGF focuses on the 0-3 km Shear Vector. From the early 1990s through today, WFO LSX have been documenting the magnitude of the 0-3 km shear - downshear (east or southeast) from convective lines and bow echoes. In recent years, other WFOs across Central Region (WFOs IWX, ICT and SGF)) have been testing either the magnitude of the 0-3 km shear or testing the 0-3 km Shear Vector (both magnitude and vector). In examining over 42 QLCS - (warm season) bow echo cases over parts of the Midwest. WFO LSX discovered that once magnitudes reached 30 kts (15 m s-1) or greater within the 0-3 km layer, mesovorticies which form along the leading edge of convective lines or form from the apex of the bow and northward have a high probability of becoming tornadic. If magnitudes were below 30 kts (15 m s-1) tornadic activity was likely absent. WFO Witcha KS (ICT) also found similar findings. WFO Springfield MO and Northern Indiana studied the 0-3 km shear vector. They also discovered that once the shear magnitude equal or exceeded 30 kts (15 m s-1), tornadic mesovortices are likely to occur. However, WFOs Springfield (SGF) and Northern Indiana (IWX) also surveyed the 0-3 km shear vector. If the vector was line normal (vector perpendicular to the convective line or bow echo) this part of the line will have the greatest probability of developing tornadic mesovortices. Convective towers will often be nearly vertically upright (or slightly tilted downshear) and we observe a near balance (slightly stronger) ambient shear to that of the onvective system's cold pool. So far WFO's SGF and LSX have examined several tornadic and non-tornadic QLCS and found this to be true. You might have the 0-3 km shear vector line normal (perpendicular to the line), however if the magnitude is below 30 kts damaging winds is the primary threat. The study of additional QLCS - bow echo cases are underway to further prove the earlier findings.
In the recent June 29, 2012 large Derecho which traveled from northern Illinois to the Mid Atlantic coast line - the system cold pool was stronger compared to the ambient shear (east and southeast of the convective line) over the WFO Sterling CWA area. . High instability (CAPE values near 5000 J Kg-1 combined with delta Theta-e values exceeding 40 K (ILM Soundings at 1800 UTC) and 7mb pressure rises behind the convective line resulted in a long lasting convective line which produced severe wind damage over a large area. The convective towers tried to maintain upright characteristics however the system cold pool was too strong compared to ambient shear downwind. Steve Zubrick (SOO at WFO Sterling) and I recently discussed this case.
Case 1: 19 June 2011 (North of Springfield MO EF0 and EF1)) Application of the 0-3 km Shear Vectors.
Fig. 2. 0-3 km Shear Vectors applied over 0443 UTC base reflectivity and SRM velocity field from KSGF (Springfield MO). Note the 0-3 km shear vectors (shown in black) are line normal (perpendicular) to that part of the forward bowing segment. The magnitude is 15 m s-1 (30 kts). MUCAPE values from SPC were approximately 3000 J kg-1 in the vicinity of the tornado with higher values of 5000 J kg-1 across southern Missouri. The 0443 UTC SRM image shows a cyclonic elliptical swirl region with two small mesovortices embedded within the elliptical swirl along the forward side of the bowing segment. The map on the right shows the tornadic damage tracks associated with each mesovortex. (Click on image for a larger image).
Case 2: 19 June 2011 (southern Crawford County MO Tornado (EF2) Application of the 0-3 km Shear Vectors.
Fig. 3. 0-3 km Shear Vectors applied over 0701 UTC base reflectivity and SRM velocity image from, KLSX (St. Louis MO). Note the 0-3 km shear vectors (shown in black) are perpendicular (line normal) to that part of the bow north of the apex. The magnitude of the shear vector is 30 to 35 kts (15 - 17 m s-1).
MUCAPE magnitudes in the vicinity of the tornado were approximately 2600 J kg-1 with an east-west axis of higher MUCAPE (4000 - 5000 J kg-1 across far southern Missouri. The 0701 UTC SRM image shows a very small tornadocyclone north just north of the apex. The inbound velcity maximum is shown much better compared to the outbound velocity maximum due to radar sampling issues. The map on the right shows the EF0-EF2 tornadic track and areas of severe downburst winds. Dr. Ted Fujita has from the Univ. of Chicago shown this type of damage pattern in his studies of bow echo events during the 1960s and 1970s. (Click on image for a larger image).
Case 2: (June 29, 2012 Derecho - North-central Illinois through Maryland - Delaware region
A powerful Derecho formed over parts of eastern Iowa and traveled across northern Illinois through parts of northern and central Indiana, and east-southeastward through the Washington D.C area and southward into northern North Carolina (Fig. 4 left side). Two concentrated damage swaths is observed from the SPC Website. Only two weak tornadoes occurred, however the majority of damage as clusters of strong damaging downbursts. The KILM (Wilmington OH) sounding (Fig 4 - right side) taken at 1800 UTC shows a highly unstable environment with a delta theta-e value of 40K (sfc- 600 mb). The detta theta-e magnitude represents a signal for strong convective-scale downcrafts. Magnitude of the 0-3 km bulk shear from the KILM sounding (1800 UTC) was 10 m s-1 (20kts). This value suggested weak shear within the lowest 3 km.
Fig. 4. (Left side) Preliminary Reports from Storm Prediction Center (29 June 2012. (Right side) 1800 UTC Sounding from Wlimington OH (KILM) for 1800 UTC 29 June 2012. (Click on image for a larger image).
We investigated the 0-3 km Shear Vector for the 29 June 2012 Derecho mainly across Indiana and the western part of Ohio. Doppler radar images at 1741 and 1913 UTC from North Webster Indiana (KIWX) along with the 0-3 km Shear Vectors for 1700 and 1900 UTC respectively are presented. (00 hr RAP fields are used for the 0-3 km Shear Vectors.
.
Fig. 5 0-3 km Shear Vectors overlaid on KIWX base reflectivity image (left) and base velocity image (right) for 1741 UTC. Shear Vectors are from 1700 UTC RAP (00 Hr Model Output). (Click on image for a larger image). .
The 0-3 km shear vector are overlaid on the North Webster Indiana WSR-88D reflectivity (left) and base velocity image (right). The orientation of the shear vectors downshear to the developing convective line are nearly line normal. However the majority of the magnitudes of the 0-3 km shear vectors range 10 - 12.5 m s-1 (20 - 25 kts). These magnitudes suggest that the probability of tornadogenesis along the leading convective line is very low. Compare the magnitudes of the 0-3 km shear vectors of this case with the 19 June 2011 early morning tornadic case (Figs 2 and 3). Note that there are many 0-3 km shear vector magnitudes equal or exceeding 15 m s-1 (30 kts) while the majority of the shear vector magnitudes were below 15 m s-1 (30 kts.). . .
To further prove that 0-3 km shear vectors suggested a low probabiity of torndogenesis we also included the 1913 UTC radar imagery from KIWX shown below with the 1900 UTC 0-3 km Shear Vectors.
Fig. 6 0-3 km Shear Vectors overlaid on KIWX base reflectivity image (left) and base velocity image (right) for 1913 UTC. Shear vectors are from 1900 UTC RAP (00 Hr Model output). (Click on image for a larger image). .
As with the 1741 UTC, the 0-3 km Shear Vectors are overlaid on the WSR-88D KIWX reflectivity and base velocity data. Note most of the 0-3 km shear vectors are line normal however the magnitudes are again between 7.5 - 12.5 m s-1 (15 to 25 kts). Again this suggest that the probability for tornadogenesis over northeast and east-central Indiana through west-central Ohio is low similar to the 1700 UTC RAP model. SPC preliminary storm data indicated that there was no tornadoes reported over the northern third of Indiana through the western half of Ohio.
The 0-3 km Shear Vector application is one of many tools to assist warning forecasters in determining if tornadogenesis will occur along the leading edge of bowing line segments and larger bow echoes. The tool gives warning forecasters lead time concerning the potential for tornadoes to form with convective lines. Jason Schauman (Lead Forecaster - WFO SGF) and I have discovered promising results from thirty cases that we have studied over the Midwest. We plan to survey additional cases to further test the 0-3 km Shear Vector utility.
Study of a Tornadic Bow Echo event 13 May 2010 with WFO Tulsa Ok (TSA)
Additionally we are working with Mr. Steve Amburn (SOO WFO Tulsa OK) and two of his forecast staff members Brad McGavock (Lead Forecaster and Karen Hatfield (Forecaster) on a noctural bow echo event which spawned several tornadoes and scattered areas of damaging winds in their County Warning Area (CWA) during the early morning of 13 May 2010. This case appeared to have some similar storm reflectivity evolution to the April 15, 1994 Derecho which moved across the Middle Mississippi Valley (LSX area) through the Lower Ohio Valley Regions (WFO Louisville Ky CWA). We are closely documenting the mesovortex evolution and its relation a number of reflectivity features. Another similar LSX case that appears to be similar to the May 13th Northeast OK tornadic QLCS is the May 24, 2004 NE Missouri QLCS. The May 24th event occurred during the late evening through early morning hours while the May13th event occurred during the early morning hours. Both eventas occurred with a surface boundary extended over 120 km and from east-northeast to west-southwest and intersected the north-central part of the larger convective line. The bow apex from the north-central part of the larger convective line. Concerning the May 13th NE Oklahoma event, the surface boundary slowly moved southward then retreated and moved northward. More information on this feature will be shown below.
So, how did the NE Oklahoma MCS evolve with time. Fig. 7 revealed the 0000 UTC soundings for KOUN (Norman OK)
Fig. 8. 13 May 2010 WSR-88D reflectivity imagery from Tulsa Ok (KINX) at 0903 UTC
(0.5 degree elevation slice).
A broad perspective of the MCS at 0903 UTC from the Tulsa OK WSR-88D is shown in Fig. 8. (Above). Two weakening convective lines is shown from southeast Kansas through north of Collinsville and from south of Elgin Oklahoma through southwest of Tulsa. The northern part of the reflectivity pattern of the second convective line shows a broad comma-like structure. Both convective lines were responsible for the generation of an extended surface outflow boundary which stretched from the northeast corner of Oklahoma through Tulsa OK and southwest where the boundary meets a developing broad convective line from Perry to Norman Oklahoma. The surface boundary intersects near the center of the developing convective system. Note the HP supercell near Perry OK. The was a long-lived supercell which produced large large and damaging winds.
Fig. 9. (left) 2010 May 13 WSR-88D reflectivity image at 0937 UTC from KINX at 0.5° slice with 0-3 km shear vectors (black wind barbs overlaid on reflectivity image. (middle) Same as left image except for closer-in view and location of MV4. (right) Same as middle except for storm-relative image and location of MV4. (Click on image for a larger image)
Figure 9 shows 0-3 km shear vectors overlaided on 0937 UTC image. Note the shear vectors (downstream from the convective line) are nearly line normal or within a 30 degree angle between the bowing line and the shear vectors - (from the bow apex and north to the intersection). Magnitude of the shear vectors are between 20 and 22 m s-1 (40 to 45 kts). A nearly solid line echo and strong low-level reflectivity gradient is noted over this part of the line . One would suspect rapid mesovortex genesis to occur over this region. . Southwest of the apex, the taller convective towers are receding towards the rear of the line as the surface gust fronts advances to the southeast. Note the 0-3 km shear vectors are nearly parallel to the convective line suggesting little or no mesovortex-genesis. The middle and right images show base reflectivity and storm-relative velocity images or 0937 UTC. MV4 is the first of many vortices which developed during the next ten minutes. MV4 formed just behind the surface outflow's gust front wtihin the theta-e gradient region north of the apex of the bow.
Fig. 10. Same as Figure 9 except for 0950 UTC including Rotational Velocity traces for MV6, MV9 and MV10. . (Click on image for a larger image).
At 0950 UTC the convective line becomes nearly north-south in orientation and several tornadic mesovorticies rapidly formed after 0937 UTC along the leading convective line. At this time MV7 spawned a tornado and caused EF1 - EF2 damage. MV6 spawned a weak tornado at 0946 and continued through 0958 UTC. Vr shear magnitudes were very weak with magnitudes initially at 9 m s-1 however these values increased to 12 to 15 m s-1 within the lowest 1.0 km. Sampling of MV6 by the WSR-88D may have been an issue. MV6 spawned a stronger tornado at 1015 - 1024 UTC. Vr magnitudes were increasing from 10 to 15 m s-1 between 1003 and 1007 UTC within the lowest 0.5 km and ten minutes prior to tornado touchdown. Vr magnitudes further increased to 21 m s-1 at 1011 UTC at the 0.5 km level (1.8° 4th lowest elevation slice) four minutes prior to tornado touchdown At the time of tornado touchdown Vr magnitudes exceeded 20 m s-1 through 1.0 km as the MV6 rapidly deepened. Will be showing MV5 shortly.
Also in figure 10 are Vr traces of MV9 and MV10, the two most northern mesovortices of the group. MV10 formed just north of the west-southwest - east-northeast surface boundary and became a very deep mesovortex. The strongest rotation during the first two volume scans was identified between 1.0 and 2.0 km (beginning at elevation slice 1.8° slice). MV10 slightly deepened and further intensified during the subsequent two volume scans (1007 and 1011 UTC). Just after 1011 UTC MV10 merged with MV9 which was earlier approximately 5 km south of MV10. MV9 formed at 1003 and rapidly intensified between 1003 and 1007 UTC with the strongest Vr magnitudes within the lowest three elevation slices. A strong tornado (EF2 damage) formed before 1007 UTC and had a lifetime of five minutes. Several homes within a subdivision near Claremore OKlahoma sustained varying degrees of damage. The tornado occurred before the merger of the two vortices. Both mesovortices formed in a vorticity rich environment. The intensification of the Vr magnitudes of MV10 between 0958 and 1003 UTC may have been a possible signal to raoid tornadigenesis associated with MV9.. However, this is a very difficult scenario for the warning forecaster. Both mesovortices were in the vicinity of the surface boundary but it is difficult to determine how much contribution the local vorticity associated with the surface boundary may have contributed. However, the rapid grwoth and tornadogenesis associated MV9 suggest that rich ambient vorticity was present. It is also interesting to point out that the tornado formed before mesovortex merger and both mesovortices were relatively short-lived compared to the long-lived mesovortices between the apex and south of the surface boundary- convective intersection. This type of vortex evolution was observed with two other pairs of vorticies, one immediately south of MV9-MV10 and a second north of the apex of the larger bow. Torandogeneis was also observed prior to merger of two vortices during the 10 June 2003 St. Louis BAMEX bow echo event. More on this topic will be forth coming.
Fig. 11. Reflectivity (left) - base velocity cross-section (right) at 0950 UTC from (A - A' shown in Fig. 10). Image on far right shows all mesovortex tracks and times of tornado occurrence in red. This image courtesy of (Atkins 2012). (Click on image for a larger image).
The reflectivtiy structure show multicell evolution along the leading edge while enhanced stratiform rain region is observed along the trailing flank of the line. An elevated mesoscale RIJ (inbound velocities) is observed with this system and not a gradual descending structure commonly observed with wide-spread wind damage. The red region (outbound velocities) represents the presence of the ascending branch. Weisman (1993) has shown through numerical simulations that a moderate to strong shear environment is present with elevated mesoscale RIJ. In this case several tornadic mesovortices were documented with the presence of the elevated mesoscale RIJ. Far right image showsthe lifetimes of all mesovortices and times of tornado occurrence (shown in red) with the May 13, 2010 event. . Many of the mesovortex tracks south of the surface boundary were long-lived while near or north of the boundary MV8, 9, and 10 were short-lived mesovortex tracks yet MV9 spawned an tornado which caused EF2 damage and damaged homes over parts of .the Claremore OK area. More to come.
In-House Work at WFO LSX
Concerning "Cold Season tornadic bow echo systems," Fred Glass and Jim Sieveking studied the 31 December 2010 tornadic bow echo event which moved from WFO Springfield (SGF) CWA to parts of east-central Missouri and southwest Illinois. This was one of the strongest cold season tornadic bow echo events in recent years. One tornado which moved across the southwest part of St. Louis County - Sunset Hills Missouri caused EF3 damage. This case was presented at the National Weather Association (NWA) Annual Meetings in Birmingham Alabama in Octobe 2011. A power-point presentation was given at the annual meetings.
|
|
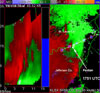 |
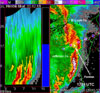
Fig. 12. Dec 31, 2010 Tornado Outbreak over St. Louis area. A verical cross-section and plan view of the reflectivity field is shown on the left. A vertical cross-section and plan view of the storm-relative velocity data is shown on the right.
(click on image for a larger image) .
Jim Sieveking (Lead Forecaster at WFO LSX) has completed preliminary work on the 31 May 2013 Tornadic QLCS event over the Greater St. Louis metro area. The study focuses on comparisons of mesovortex strength between the WSR-88D and the Terminal Doppler Weather Radar (TDWR) west of Lambert Field. The 0.5° elevation angle is used in this study. A presentation will be made at the upcoming 38th Annual National Weather Association Meeting in Charleston SC next month. .
What we have done thus far:
The WFO St. Louis WSR-88D Doppler radar became operational by late spring of 1992. Since this time, we have identified 48 warm season Quasi-Linear Convective Systems (QLCSs) and bow echoes across the WFO St. Louis County Warning Area (CWA) and areas surrounding the WFO LSX CWA. We define the "warm season" from late April through early October. From the 48 events, we have completed the study of 43 QLCSs. All 48 QLCSs were 'forward propagating MCSs' and were responsible for the production of damaging winds. We have studied both tornadic and non-tornadic QLCS events. QLCS tornadoes occurred in 28 of the 48 warm season cases.
Single Doppler velocity data (10 cm) from KLSX (St. Louis), KEAX (Pleasant Hill MO), KILX (Lincoln IL), KDMX (Des Monies, IA) Chicago IL (KLOT), were used in the study to analyze Doppler velocity patterns and convective-scale vortex evolution. Archive Level II data were used in 95% of the cases studied, The evolution of most mesovortices were studied within 140 km of the WSR-88D. Some of the larger line-end (Book-end) vortices were examinded beyond 140 km due to their large core diameters. We have studied over 160 mesovorticies (gamma-scale) and several larger bookend vortices from the 43 cases.. A number of these mesovortices were non-tornadic. Time-height Rotational Velocity (Vr) traces were completed for each circulation to show their evolutionary characteristics and determine time of tornado occurrence (if a tornado occurred with the vortex). In the initial study we specifically examined the 1st, 2nd and subsequent meso or misovortex cores, frequently observed in the vicinity or south of the intersection of a low-level outflow boundary (or quasi-stationary frontal boundary) and the larger convective line or in the vicinity of the cyclonic shear side of the developing bow. Additionally,
Bow Echo and MCV Experiment (BAMEX) project (spring - summer 2003) Dr. Nolan Atkins (Lyndon State College VT), Gary Schmocker, and myself documented and studied the storm evolution of the (June 10, 2003) (St. Louis Bow Echo Event) which intensified over central Missouri and weakened over southeast Illinois. The 10 June 2003 St. Louis Bow Echo event was the only major damaging wind producer during the spring - summer 2003 convective season during the study. This event spawned several non-supercell tornadoes along the leading edge of the convective line and caused F0 - F1 damage. Since many of the tornadic mesovortices formed over parts east central Missouri and southwest Illinois, the location of the KLSX WSR88D resulted in an excellent viewing angle for observing and tracking the tornadic and non-tornadic mesovortices KLSX. The non-supercell tornadoes occurred during the period of QLCS organization and early evolution of the mesoscale Rear Inflow Jet (RIJ). In other words we observed the formation of strong mesovortices during the 'linear to early bowing' of the convective line segment. Three QLCS events occurred during the late spring through early summer season of 2004. Two of the three events were responsible for the production of non-supercell tornadoes. Only one of the three events have been investigated. Of the 38 cases studied at the end of 2004, 12 events fit the classification of a derecho while the remaining 26 MCSs failed to meet this criteria.
One of the more profilic tornadic QLCS events occurred on 2 April 2006 (outside the warm-season study) (weblink is partially completed and under construction). This case became one of the most challenging cases where several circulation core diameters were quite small (less than 0.8 km - classifying them as misocyclones) while Rotational Velocities (Vr) were modest at best. The speed of the system aided in the production of damage. Three tornadoes spawed F2 damage while several tornadoes prodcued F0 and F1 damage. This weblink will be available by September 2007. The most recent profilic damaging wind events occurred on 19 July (under construction) and 21 July, 2006. A Derecho moved across northwest through central Illinois then southwest across the Greater St. Louis metropolitan area on 19 July 2006 resulting major tree and power line damage over the area. Over 500,000 people within the Greater St. Louis metro area lost power for several days. The overall character and structure of the storms resembled multicellular evolution with the absence of a well developed trailing stratiform rain region. On Friday, July 21, 2006 a cluster of storms formed into a small linear segment and produced damaging winds from 15 to 20 miles northeast of Columbia Missouri through the northern part of the St. Louis metro area and east-southeastward across parts of southwest Illinois. The small bowing segment was responsible for the production of non-supercell tornadoes over parts of southwest Illinois.
As with the 10 June 2003, 24 May 2004, 02 April, 2006 and now the July 21, 2006 event, much of the damage including tornadic damage occurred along the paths of the mesovortices. A preprint of the 2 April 2006 case pdf format for download) is located on the Science News Publication's page under AMS Extended Abstracts. A webpage on the 2 April 2006 tornadic QLCS is under construction at this time (See weblink above). Earlier thoughts on mesovortex evolution with QLCS focused on mesovortices occurred during the bowing stage of convective lines. However, this is not necessarily true. In reviewing several earlier cases we studied, the reflectivity and velocity pattern organization, mesoscale RIJ formation occured prior to mesovortex formation and bowing of the convective line. In some of the warm (May - September) and transitional (October - November or March - April) season cases moderate to strong tornadic mesovortices formed when a linear or slightly bowing line segment was present.
We also examined one transitional - (Cool Season) QLCS event and one cool season tornado event over our region. We discovered that the strongest rotation is often located within the lowest 2.5 km of the mesovortex while mesovortex deepening does occur prior to tornadogenesis. Glass and Sieveking has completed more work with "Cool Season Events including the December 31, 2010 and Sieveking (Feb 27, 2011 tornadic QLCS event). With the transitional and cool season event, mesovortex height can extend up to 4 km while their warm-season counterparts can reach heights up to 7 or even 8 km. Magnitudes of rotational velocities (Vr) below 2. 5 km with "Cool Season" cases can be lower (18 m s-1) compared to warm season countierparts where Vr values may exceed 20 m s-1 or greater. The following weblink (Nov 1 2004) "Cool Season" QLCS shows the evolution of a tornadic mesovortex initially forming along the leading edge of a linear convective line and gradually evolving into the higher reflectivity region of this convective line. We show the thermodynamic and shear profiles of this case along with the history of the QLCS and mesovortex evolution. .
As of 2006 we focused on the morphology and evolution of the reflectivity and Doppler velocity structures of 43 events. We also investigated the pre- and near-storm environment for these events. Analysis of surface, upper level charts, and soundings analysis (CAPE / Bulk Shear) were completed. Profiler data in many of our cases was also used to determine the strength of Bulk Shear. Magnitudes of Bulk Shear were calculated for the 0 - 3 km and the 0 - 5 km layers. Dr. Jeff Trapp from Purdue University suggested the examination of the 0 - 5 km layer Bulk shear. In many of the recent cases, we are examining mesoscale analysis output from the Storm Prediction Center (SPC). The MCSs under study occurred during the period from April through September 1992 - 2006 (with the majority of the events occurring during the warm season months of May, June and July). This is part of a continuing study of Quasi-Linear Convective Systems across our region. We specifically continued to investigate the 'Intensifying Stage' (Leary and Houze 1979; Rasmussen and Rutledge 1993; or 'Stage 2' from Weisman's 1993 numerical simulations of bow echo - squall line evolution (pre-bow echo to early stages of a bow echo evolution)). We also noted that a limited amount of work has been completed in this area. Four conceptual models (Storm Types) of this stage were derived from 43 of the 48 cases. Eight MCS events did not conform to any of the four storm types and were placed in a fifth category classified as 'other.' Examples supporting each of these conceptual storm types will be shown in the following sections. These illustrations also show the 'variability' of mesovortex evolution observed in our events. Some of our cases revealed isolated cell - convective line mergers, where mesovortex development-intensification occurred just after the merger. Based on our observations, we will also present preliminary information on the characteristics of 'Line-end vortices or "Bookend vortices' and their role with damaging winds.
As we continue to survey addiitional QLCS cases collected during the past three years along with our earlier cases we have generally found two modes of mesovortex evolution: (Mode #1) often occurs in late spring through the summer season. The mesovortex initially forms along the leading edge of a convective segment at low-levels below 2 km and ascends (non-descending character) with time to heights of 5 to 8 km during a period of 10 to 20 minutes while the strongest rotation is frequently observed within the lowest 2.5 km layer. Tornadoes often occurred near or prior to the greatest mesovortex depth while the rotational velocities (Vr) values at low-levels can exceed 20 to even 25 m s-1. Tornadogenesis can occur as much as 15 to possibly 20 minutes after initial mesovortex identification (Fig. 1) (June 29, 1998 Central Illinois QLCS) (using 8 bit data). Most of the tornadic mesovortices in this group have long lifetimes often exceeding 40 minutes while their counterparts (non-torndic mesovortices) have short lifetimes. Atkins et al 2004; Atkins et al. 2005 (MWR) have shown that for those afternoon and early evening bow echo events, the mean lifetime of those tornadic mesovortices may exist greater than twice the lifetime of those non-tornadic mesovortices (MWR) (Historgram of mesovortex lifetime for all vortices associated with the 10 June 2003 case). This was also observed in many of our cases we studied. (Click here for examples).
Most of these mesovotices which spawn tornadoes have caused EF0 - EF1 damage. However a few of these tornadic mesovortices have caused EF2 damage. Figure 2 shows mesovortex 6 (MV6) (long-lived mesovortex) near the apex of a bow echo (southern end of the convective line segment) (23 August 2007 northeast Illinois QLCS using 8 bit data). Three other mesovortices are noted to the north along the leading edge of the line segment. The Vr traces of MV6 after 1944 UTC shows rapid mesovortex intensification around 2 km which Vr magnitudes reach 20 m s-1 and greater. The highest magnitudes remain around 2 km. Tornadogenesis in the case occurred 15 minutes after the strongest rotation was observed 1944 UTC. This type of mesovortex evolution after 1944 has been observed in several other cases we have examined. Gino Izzi (Lead Forecaster from WFO LOT) is a lead author of a paper he publishded on this case in the AMS 24th Conf. on Severe Local Storms (Fig. 2) (Aug 23 2007 northeast Illinois convective line segment using 8 bit data);
(Mode #2) This class of mesovortices occur during the transisitonal and spring seasons across the middle part of the United States. This group of mesovortices are associated with a single bow echo or a bowing segment embedded within a larger forward propagating QLCSs which may extend over 120 km. In most cases they are associated with a established and strong mesoscale RIJ. The mesovortex frequently forms at low-level (0-2 km layer) along the leading edge of the bowing convective line (just north of the apex to along the cyclonic shear side of the bow. The mesovortex rapidly deepens and low-level rotation rapidly intensifies near and below 2 km. The depth of the mesovortex usually remains at below 5 km.compared to Mode 1 cases in which they can ascend to heights of 7-8 km. In a few cases we have documented the depth of the mesovortex reached 3 km yet spawned a tornado which caused strong EF2 damage. Magnitudes of low-level rotation can easily exceed 20 m s-1. Tornadogenesis frequently occurred within the first 10 minutes from the time of first mesovortex identification (Figs. 3 and 4) (* using 8 bit velocity data). Thus lead times can be very short. The total lifespan of these tornadic mesovortices can vary a lot from as short as 20 minutes to as long as 40 minutes or greater. The early morning tornadic QLCS cases reveal this trend resulting in further challenges to the warning forecaster. Graphs on overall mesovortex characteristics and their total lifespans will be shown shortly from our group of cases. In this group, some of the cases indicate little to no relationship between the strength of rotation at low-levels and damage intensity. This is particular true for tornadic mesovortices at distant ranges from the WSR-88D (120 km and greater). In contrast there are some tornadic QLCS cases (within 100 km of the WSR-88D) which show a good relationship between the strength of low-level rotation and the intensity of damage. We have documented damage intensity as high as EF3 in two cases during the transitional season and EF2 in the months of May and June. . In many of our damage assessments, we interviewed the public and found that the tornado is partially or totally masked in heavy rainfall. In the December 27, 2008 cold season tornadic QLCS, we interviewed several witnesses who observed the tornado just slightly ahead of the area of heavy rainfall associated with the convective line. The witnesses stated that the tornado remained just ahead of the heavy rainfall. The convective line in this case was moving at speeds of 25 - 27 m s-1. These mesovortices formed within the tight theat-e gradient region along the leading edge.
Since 2002 to the present (2011) we uncovered another interesting finding from six QLCS cases. In three cases, 2 to 3 mesovortices formed near or north of the apex of the bow in a cyclic type pattern with each mesovortex spawning a tornado. In the cases 4 and 5 one mesovortex spawned two separate tornadoes at differing times during its lifespan. Other mesovortices along the cyclonic shear side of the bow away from the apex have often spawned only one tornado. In these five cases the mature stage of the bow echo persisted for one to two hours. More cases usng high resolution Doppler velocity data will be needed to further support these finding.
In our earlier work mean magnitudes of Vr of the 1st, 2nd and successive core circulations were compared to an updated study of mesocyclone statistics reported by Burgess et al. 1982 and Burgess et al. 1995. In 2002, Dr. Mike Biggerstaff from the University of Oklahoma reported to us of a bowing MCS case across south-central Texas exhibiting a similar evolution to one of our storm types (Group 1 event). A strong circulation formed in the vicinity of an intersecting low-level boundary - larger convective line. Recent observations reported by Angela Lese (WFO LMK) from the morning July 4, 2004 QLCS over southwest Missouri also showed tornadic mesovortex evolution near the intersection of a surface boundary and the larger convective line. During the BAMEX field experiment, one of the recent cases sampled by the NOAA P3 aircraft and the High Altitiude Jet occurred over parts of Indiana and Ohio on July 4, 2003. This case appeared to fit the Group 1 type cases.
|


 Weather Story
 Weather Map
 Local Radar