Miami - South Florida
Weather Forecast Office
 |
| These graphics are updated at least twice per day, shortly after 4 AM/4 PM Eastern Time. They can be magnified (enlarged) by left clicking on them, and resized back to original size with a second click. |
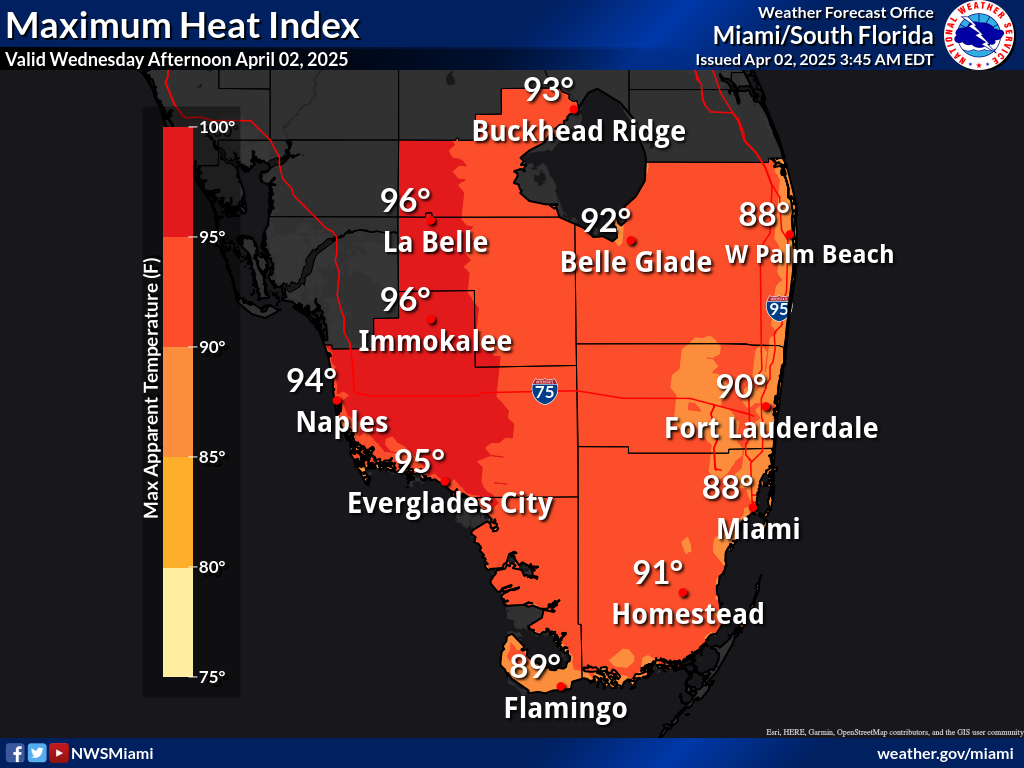
South Florida's Expected Heat Indices Today
|
Please see county-specific tabs above for additional graphics.
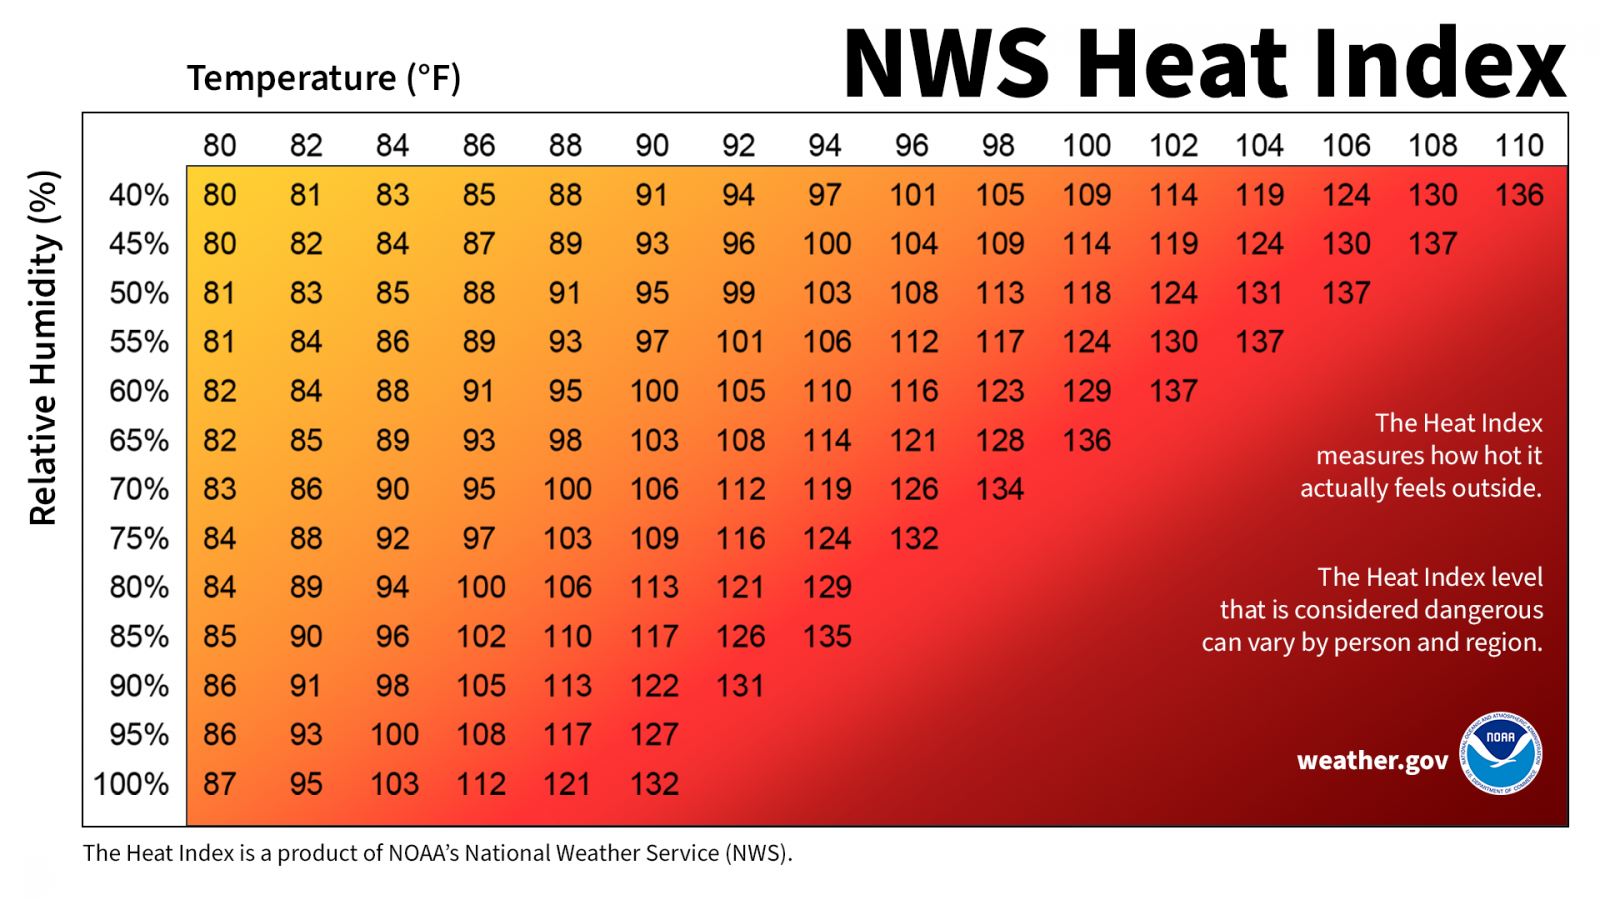
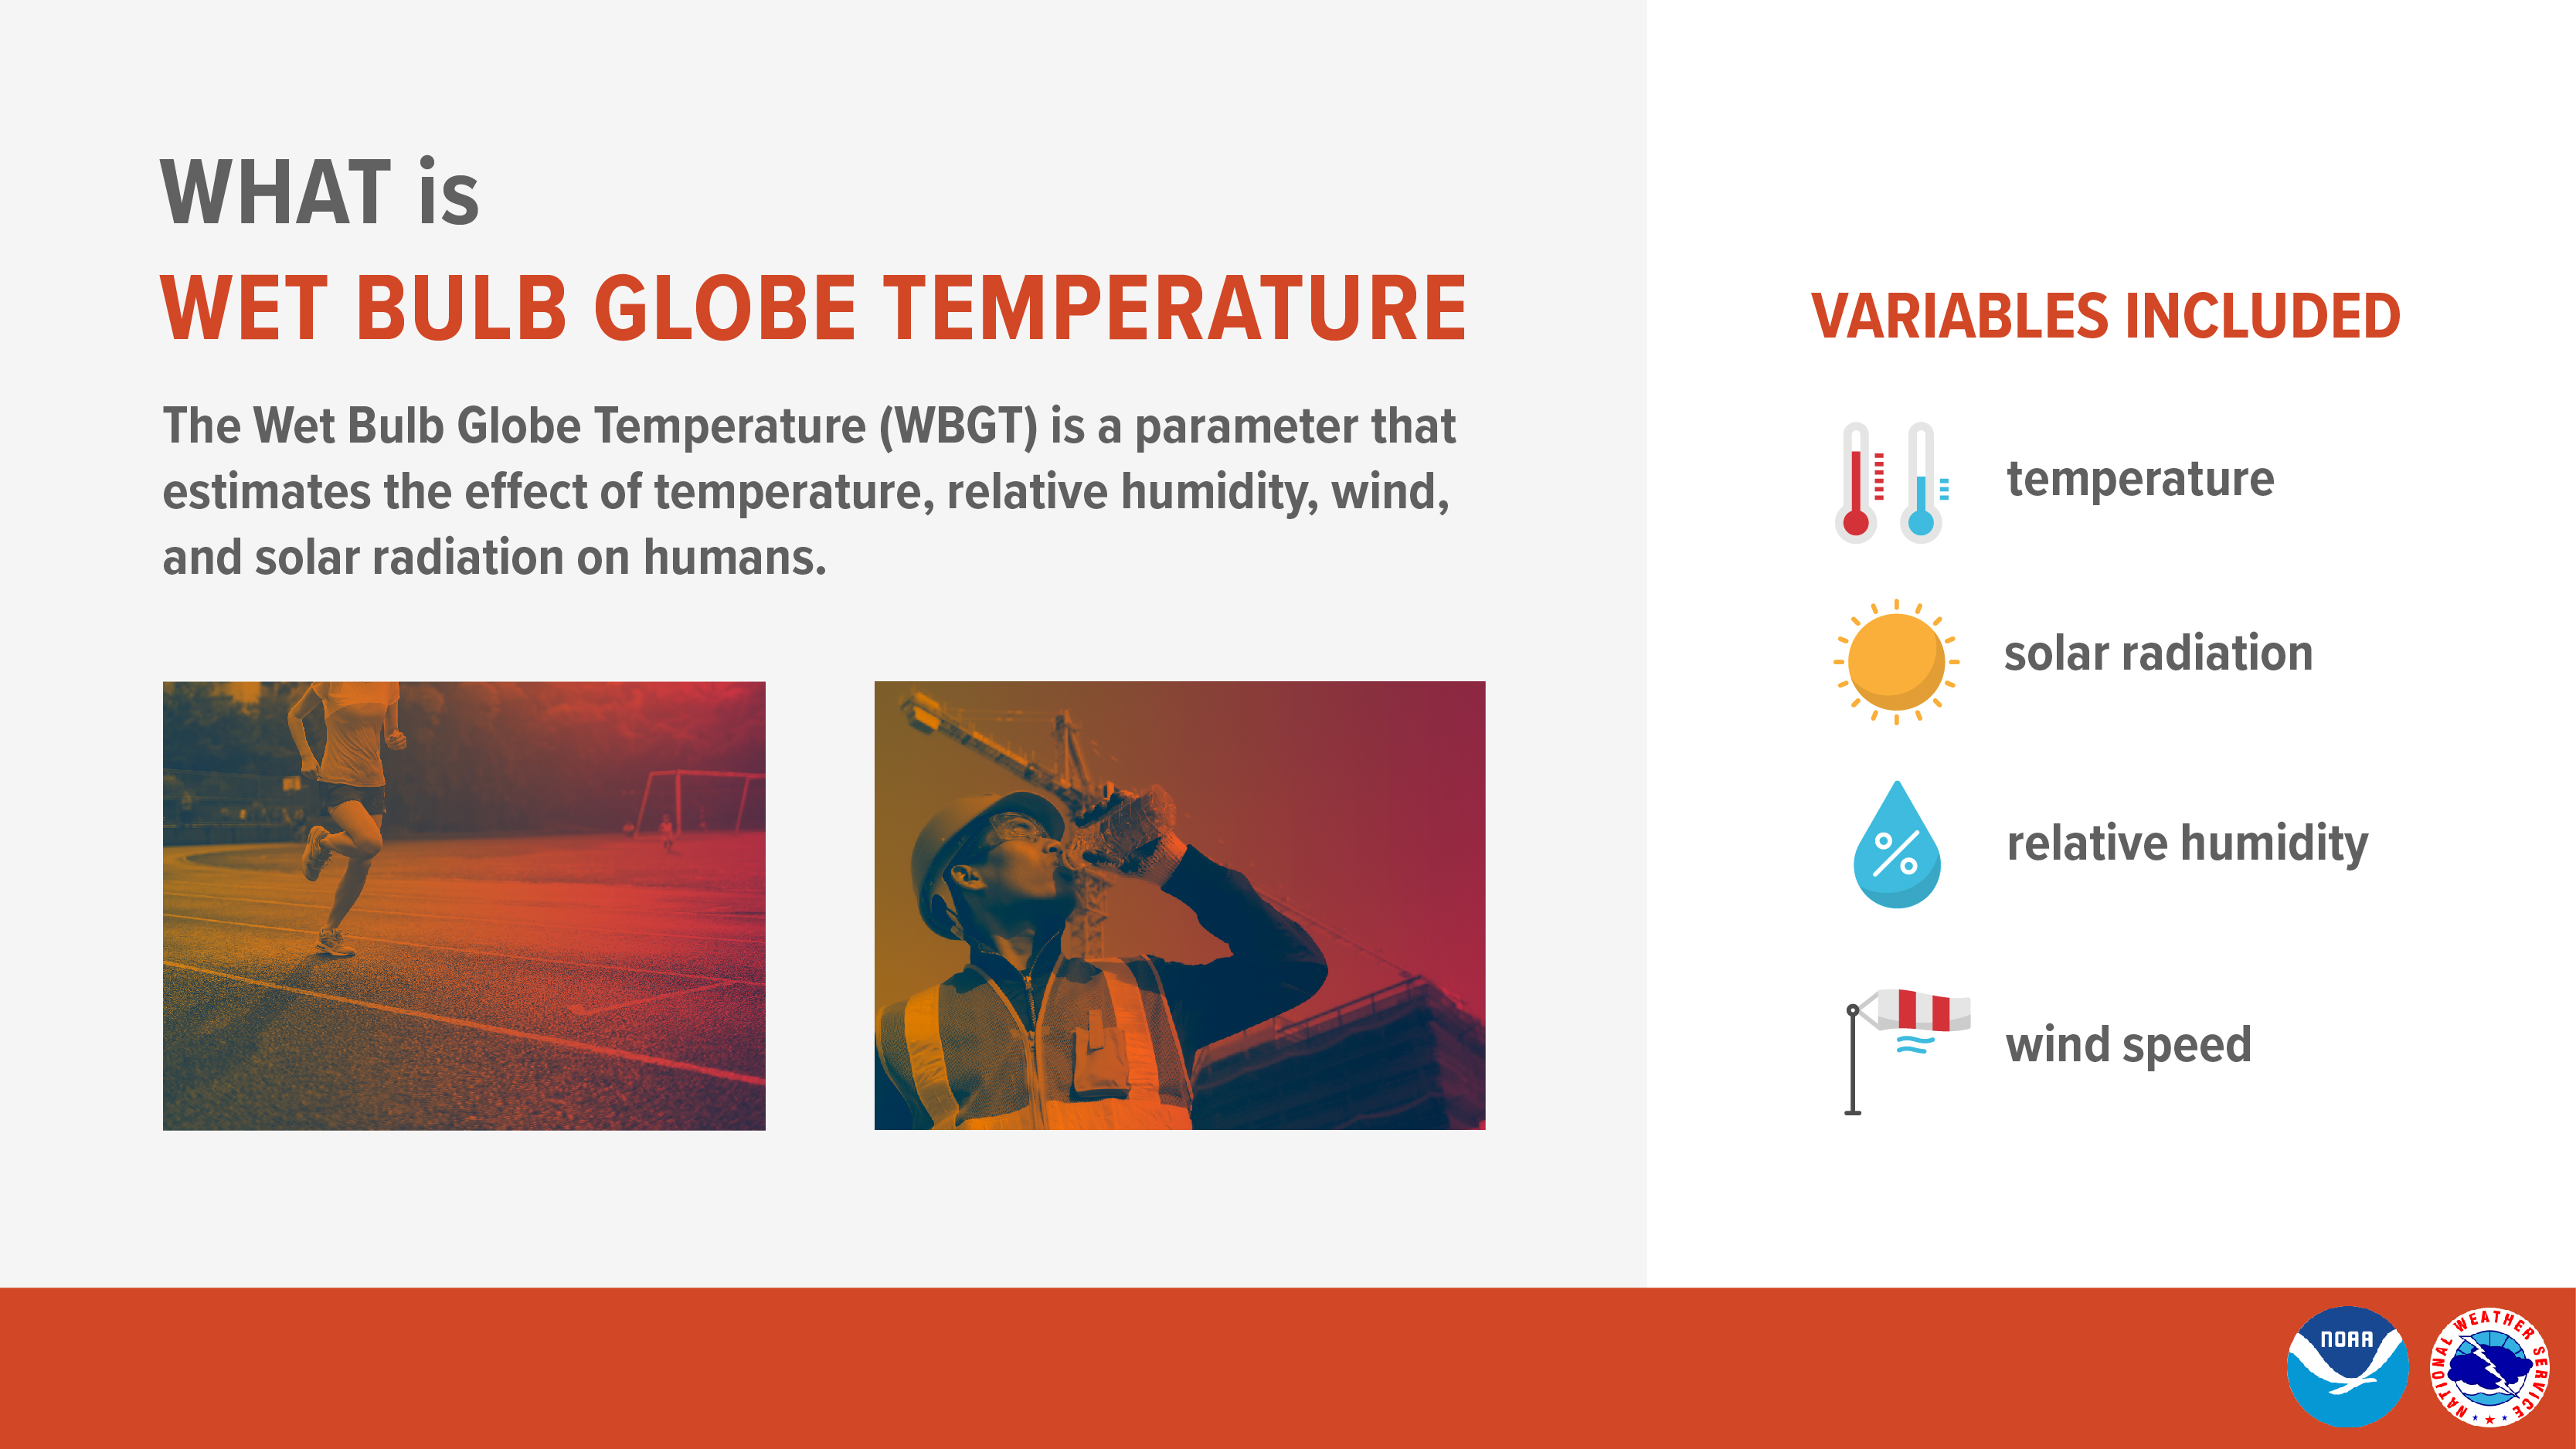
What is Heat Index? The Heat Index is a measure of how hot it really feels when relative humidity is factored in with the actual air temperature. To find the Heat Index temperature, look at the Heat Index Chart below or check our Heat Index Calculator. As an example, if the air temperature is 96°F and the relative humidity is 65%, the heat index--how hot it feels--is 121°F. The red area without numbers indicates extreme danger. The National Weather Service will initiate alert procedures when the Heat Index is expected to exceed 105°-110°F (depending on local climate) for at least 2 consecutive days. NWS also offers a Heat Index chart for areas with high heat but low relative humidity. Since heat index values were devised for shady, light wind conditions, exposure to full sunshine can increase heat index values by up to 15°F. Also, strong winds, particularly with very hot, dry air, can be extremely hazardous. What is Wet Globe Temperature? What is Wet Bulb Globe Temperature (WBGT)? Check out this handout and video to learn about WBGT. WBGT uses temperature, humidity, wind, solar radiation, and other weather parameters. It’s a particularly effective indicator of heat stress for active populations such as outdoor workers and athletes. WBGT can be used to inform activity modifications during exercise or outdoor work. For instance, The American College of Sports Medicine bases its guidelines for the intensity of sport practices on WBGT, and it is therefore utilized by athletic programs in many school districts. The Occupational Safety and Health Administration (OSHA) recommends protective measures for outdoor work:
|
Expected Heat Index (°F) for Miami-Dade County
These maps are the official NWS heat index temperature forecast in degrees Fahrenheit during the time period shown on the graphic. These heat index values are determined by NWS forecasters to be the most likely outcome based on evaluation of data from computer models, satellite, radar, and other observations.
Day 1  |
Day 2  |
Day 3  |
Day 4  |
Day 5  |
Wet Bulb Globe Temperature Risk for Miami-Dade County
The Wet Bulb Globe Temperature (WBGT) is an indicator of heat related stress on the human body at work (or play) in direct sunlight. It takes into account multiple atmospheric variables, including: temperature, humidity, wind speed, sun angle, and cloud cover. Military agencies, OSHA, activities associations and many others use the WBGT Risk as a guide to managing workload or activity level. These graphics don't depict the actual WBGT forecast, but rather will depict the associated risk level for each given time period.
Day 1  |
Day 2  |
Day 3  |
Day 4  |
Day 5  |
HeatRisk for Miami-Dade County
The NWS HeatRisk is an experimental color-numeric-based index that provides a forecast risk of heat-related impacts to occur over a 24-hour period. This index is supplementary to official NWS heat products and is meant to provide risk guidance for those decision makers and heat-sensitive populations who need to take actions at levels that may be below current NWS heat product levels.
Day 1  |
Day 2  |
Day 3  |
Day 4  |
Day 5  |
For additional information about the differences between each NWS heat product, please see this document.
Expected Heat Index (°F) for Broward County
These maps are the official NWS heat index temperature forecast in degrees Fahrenheit during the time period shown on the graphic. These heat index temperatures are determined by NWS forecasters to be the most likely outcome based on evaluation of data from computer models, satellite, radar, and other observations.
Day 1  |
Day 2  |
Day 3  |
Day 4  |
Day 5  |
Wet Bulb Globe Temperature Risk for Broward County
The Wet Bulb Globe Temperature (WBGT) is an indicator of heat related stress on the human body at work (or play) in direct sunlight. It takes into account multiple atmospheric variables, including: temperature, humidity, wind speed, sun angle, and cloud cover. Military agencies, OSHA, activities associations and many others use the WBGT Risk as a guide to managing workload or activity level. These graphics don't depict the actual WBGT forecast, but rather will depict the associated risk level for each given time period.
Day 1  |
Day 2  |
Day 3  |
Day 4  |
Day 5  |
HeatRisk for Broward County
The NWS HeatRisk is an experimental color-numeric-based index that provides a forecast risk of heat-related impacts to occur over a 24-hour period. This index is supplementary to official NWS heat products and is meant to provide risk guidance for those decision makers and heat-sensitive populations who need to take actions at levels that may be below current NWS heat product levels.
Day 1  |
Day 2  |
Day 3  |
Day 4  |
Day 5  |
For additional information about the differences between each NWS heat product, please see this document.
Expected Heat Index (°F) for Palm Beach County
These maps are the official NWS heat index temperature forecast in degrees Fahrenheit during the time period shown on the graphic. These heat index temperatures are determined by NWS forecasters to be the most likely outcome based on evaluation of data from computer models, satellite, radar, and other observations.
Day 1  |
Day 2  |
Day 3  |
Day 4  |
Day 5  |
Wet Bulb Globe Temperature Risk for Palm Beach County
The Wet Bulb Globe Temperature (WBGT) is an indicator of heat related stress on the human body at work (or play) in direct sunlight. It takes into account multiple atmospheric variables, including: temperature, humidity, wind speed, sun angle, and cloud cover. Military agencies, OSHA, activities associations and many others use the WBGT Risk as a guide to managing workload or activity level. These graphics don't depict the actual WBGT forecast, but rather will depict the associated risk level for each given time period.
Day 1  |
Day 2  |
Day 3  |
Day 4  |
Day 5  |
HeatRisk for Palm Beach County
The NWS HeatRisk is an experimental color-numeric-based index that provides a forecast risk of heat-related impacts to occur over a 24-hour period. This index is supplementary to official NWS heat products and is meant to provide risk guidance for those decision makers and heat-sensitive populations who need to take actions at levels that may be below current NWS heat product levels.
Day 1  |
Day 2  |
Day 3  |
Day 4  |
Day 5  |
For additional information about the differences between each NWS heat product, please see this document.
Expected Heat Index (°F) for Collier County
These maps are the official NWS heat index temperature forecast in degrees Fahrenheit during the time period shown on the graphic. These heat index temperatures are determined by NWS forecasters to be the most likely outcome based on evaluation of data from computer models, satellite, radar, and other observations.
Day 1  |
Day 2  |
Day 3  |
Day 4  |
Day 5  |
Wet Bulb Globe Temperature Risk for Collier County
The Wet Bulb Globe Temperature (WBGT) is an indicator of heat related stress on the human body at work (or play) in direct sunlight. It takes into account multiple atmospheric variables, including: temperature, humidity, wind speed, sun angle, and cloud cover. Military agencies, OSHA, activities associations and many others use the WBGT Risk as a guide to managing workload or activity level. These graphics don't depict the actual WBGT forecast, but rather will depict the associated risk level for each given time period.
Day 1  |
Day 2  |
Day 3  |
Day 4  |
Day 5  |
HeatRisk for Collier County
The NWS HeatRisk is an experimental color-numeric-based index that provides a forecast risk of heat-related impacts to occur over a 24-hour period. This index is supplementary to official NWS heat products and is meant to provide risk guidance for those decision makers and heat-sensitive populations who need to take actions at levels that may be below current NWS heat product levels.
Day 1  |
Day 2  |
Day 3  |
Day 4  |
Day 5  |
For additional information about the differences between each NWS heat product, please see this document.
Expected Heat Index (°F) for Hendry County
These maps are the official NWS heat index temperature forecast in degrees Fahrenheit during the time period shown on the graphic. These heat index temperatures are determined by NWS forecasters to be the most likely outcome based on evaluation of data from computer models, satellite, radar, and other observations.
Day 1  |
Day 2  |
Day 3  |
Day 4  |
Day 5  |
Wet Bulb Globe Temperature Risk for Hendry County
The Wet Bulb Globe Temperature (WBGT) is an indicator of heat related stress on the human body at work (or play) in direct sunlight. It takes into account multiple atmospheric variables, including: temperature, humidity, wind speed, sun angle, and cloud cover. Military agencies, OSHA, activities associations and many others use the WBGT Risk as a guide to managing workload or activity level. These graphics don't depict the actual WBGT forecast, but rather will depict the associated risk level for each given time period.
Day 1  |
Day 2  |
Day 3  |
Day 4  |
Day 5  |
HeatRisk for Hendry County
The NWS HeatRisk is an experimental color-numeric-based index that provides a forecast risk of heat-related impacts to occur over a 24-hour period. This index is supplementary to official NWS heat products and is meant to provide risk guidance for those decision makers and heat-sensitive populations who need to take actions at levels that may be below current NWS heat product levels.
Day 1  |
Day 2  |
Day 3  |
Day 4  |
Day 5  |
For additional information about the differences between each NWS heat product, please see this document.
Expected Heat Index (°F) for Glades County
These maps are the official NWS heat index forecast in degrees Fahrenheit during the time period shown on the graphic. These heat index temperatures are determined by NWS forecasters to be the most likely outcome based on evaluation of data from computer models, satellite, radar, and other observations.
Day 1 |
Day 2 |
Day 3 |
Day 4 |
Day 5 |
Wet Bulb Globe Temperature Risk for Glades County
The Wet Bulb Globe Temperature (WBGT) is an indicator of heat related stress on the human body at work (or play) in direct sunlight. It takes into account multiple atmospheric variables, including: temperature, humidity, wind speed, sun angle, and cloud cover. Military agencies, OSHA, activities associations and many others use the WBGT Risk as a guide to managing workload or activity level. These graphics don't depict the actual WBGT forecast, but rather will depict the associated risk level for each given time period.
Day 1 |
Day 2 |
Day 3 |
Day 4 |
Day 5 |
HeatRisk for Glades County
The NWS HeatRisk is an experimental color-numeric-based index that provides a forecast risk of heat-related impacts to occur over a 24-hour period. This index is supplementary to official NWS heat products and is meant to provide risk guidance for those decision makers and heat-sensitive populations who need to take actions at levels that may be below current NWS heat product levels.
Day 1 |
Day 2 |
Day 3 |
Day 4 |
Day 5 |
For additional information about the differences between each NWS heat product, please see this document.
Expected 12 Hour Rainfall (in.)
These maps are the official NWS rainfall forecast in inches during the time period shown on the graphic. These rainfall amounts are determined by NWS forecasters to be the most likely outcome based on evaluation of data from computer models, satellite, radar, and other observations.
Day 1  |
Night 1  |
Day 2  |
Night 2  |
Day 3  |
Night 3  |
Day 4  |
Night 4  |
Day 5  |
Night 5  |
Day 6  |
Night 6  |
Day 7  |
Night 7  |
Greatest 12 Hour Possible Rainfall (in.)
These maps depict a reasonable upper-end rainfall amount for the time period shown on the graphic, based on many computer model simulations of possible rainfall totals. These higher amounts are an unlikely scenario, with only a 1 in 10, or 10% chance that more rain will fall, and a 9 in 10, or 90% chance that less rain will fall. These amounts can help serve as an upper-end scenario for planning purposes.
Day 1  |
Night 1  |
Day 2  |
Night 2  |
Day 3  |
Night 3  |
Day 4  |
Night 4  |
Day 5  |
Night 5  |
Day 6  |
Night 6  |
Day 7  |
Night 7  |
Least Possible 12 Hour Rainfall (in.)
These maps depict a reasonable lower-end rainfall amount for the time period shown on the graphic, based on many computer model simulations of possible rainfall totals. These lower amounts are an unlikely scenario, with a 9 in 10, or 90% chance that more rain will fall, and only a 1 in 10, or 10% chance that less rain will fall. These amounts can help serve as a lower-end scenario for planning purposes. On many occasions these graphics will be blank, which depicts that the low end is for no measurable rainfall.
Day 1  |
Night 1  |
Day 2  |
Night 2  |
Day 3  |
Night 3  |
Day 4  |
Night 4  |
Day 5  |
Night 5  |
Day 6  |
Night 6  |
Day 7  |
Night 7  |
Expected 24 Hour Rainfall (in.)
These maps are the official NWS rainfall forecast in inches during the time period shown on the graphic. These rainfall amounts are determined by NWS forecasters to be the most likely outcome based on evaluation of data from computer models, satellite, radar, and other observations.
Day 1  |
Day 2  |
Day 3  |
Day 4  |
Day 5  |
Day 6  |
Day 7  |
Greatest 24 Hour Possible Rainfall (in.)
These maps depict a reasonable upper-end rainfall amount for the time period shown on the graphic, based on many computer model simulations of possible rainfall totals. These higher amounts are an unlikely scenario, with only a 1 in 10, or 10% chance that more rain will fall, and a 9 in 10, or 90% chance that less rain will fall. These amounts can help serve as an upper-end scenario for planning purposes.
Day 1  |
Day 2  |
Day 3  |
Day 4  |
Day 5  |
Day 6  |
Day 7  |
Least Possible 24 Hour Rainfall (in.)
These maps depict a reasonable lower-end rainfall amount for the time period shown on the graphic, based on many computer model simulations of possible rainfall totals. These lower amounts are an unlikely scenario, with a 9 in 10, or 90% chance that more rain will fall, and only a 1 in 10, or 10% chance that less rain will fall. These amounts can help serve as a lower-end scenario for planning purposes. On many occasions these graphics will be blank, which depicts that the low end is for no measurable rainfall.
Day 1  |
Day 2  |
Day 3  |
Day 4  |
Day 5  |
Day 6  |
Day 7  |
Expected Rainfall (in.)
These maps are the official NWS rainfall forecast in inches during the time period shown on the graphic. These rainfall amounts are determined by NWS forecasters to be the most likely outcome based on evaluation of data from computer models, satellite, radar, and other observations.
Day 1-2  |
Day 1-3  |
Day 1-5  |
Day 1-7  |
Day 2-3  |
Day 3-4  |
Day 4-5  |
Day 6-7  |
Greatest Possible Rainfall (in.)
These maps depict a reasonable upper-end rainfall amount for the time period shown on the graphic, based on many computer model simulations of possible rainfall totals. These higher amounts are an unlikely scenario, with only a 1 in 10, or 10% chance that more rain will fall, and a 9 in 10, or 90% chance that less rain will fall. These amounts can help serve as an upper-end scenario for planning purposes.
Day 1-2  |
Day 1-3  |
Day 1-5  |
Day 1-7  |
Day 2-3  |
Day 3-4  |
Day 4-5  |
Day 6-7  |
Least Possible Rainfall (in.)
These maps depict a reasonable lower-end rainfall amount for the time period shown on the graphic, based on many computer model simulations of possible rainfall totals. These lower amounts are an unlikely scenario, with a 9 in 10, or 90% chance that more rain will fall, and only a 1 in 10, or 10% chance that less rain will fall. These amounts can help serve as a lower-end scenario for planning purposes. On many occasions these graphics will be blank, which depicts that the low end is for no measurable rainfall.
Day 1-2  |
Day 1-3  |
Day 1-5  |
Day 1-7  |
Day 2-3  |
Day 3-4  |
Day 4-5  |
Day 6-7  |
CURRENT HAZARDS
Submit a Storm Report
Outlooks
Graphical Hazardous Weather Outlook
Self Briefing Page
National Hazards
Tropics / Hurricanes
Local Storm Reports
CURRENT WEATHER
Surface Observations
Satellite
Observed Precipitation
MesoAnalysis
Rivers / Lakes
Latest Sounding
Lake Okeechobee
PAST WEATHER
Recent Rainfall
Tropical Cyclone Reports
Past Events
FORECASTS
Forecast Discussion
Tropical Weather
Probabilistic Page
Heat Page
Cold Weather Page
Marine Weather
Fire Weather
Beach Forecast
Aviation Weather
Probabilistic QPF
Hourly Forecasts
Activity Planner
Graphical Forecast
International Weather
RADAR IMAGERY
National
Miami Radar
Key West Radar
Across Florida
CLIMATE
Local Climate Info
More Local Climate Info
Climate Graphs
US Dept of Commerce
National Oceanic and Atmospheric Administration
National Weather Service
Miami - South Florida
11691 SW 17th Street
Miami, FL 33165
305-229-4522
Comments? Questions? Please Contact Us.


.png)
.png)