Climate data on this page is PRELIMINARY (unofficial). CERTIFIED (official) climate data is available from the National Center for Environmental Information (NCEI).
Latest ENSO Diagnostic Discussion
Page last updated: Mar 2026
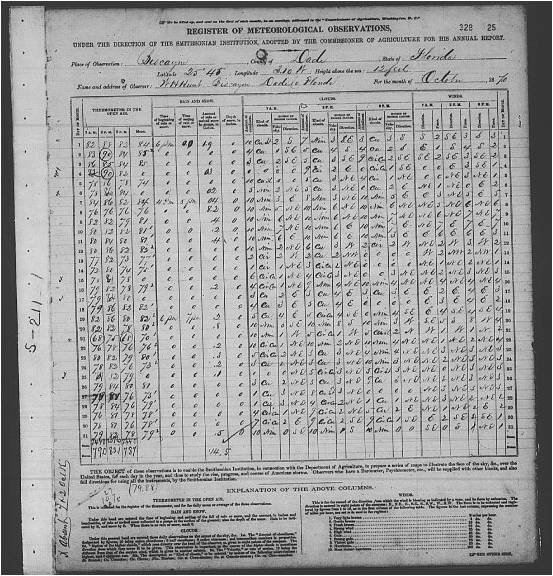
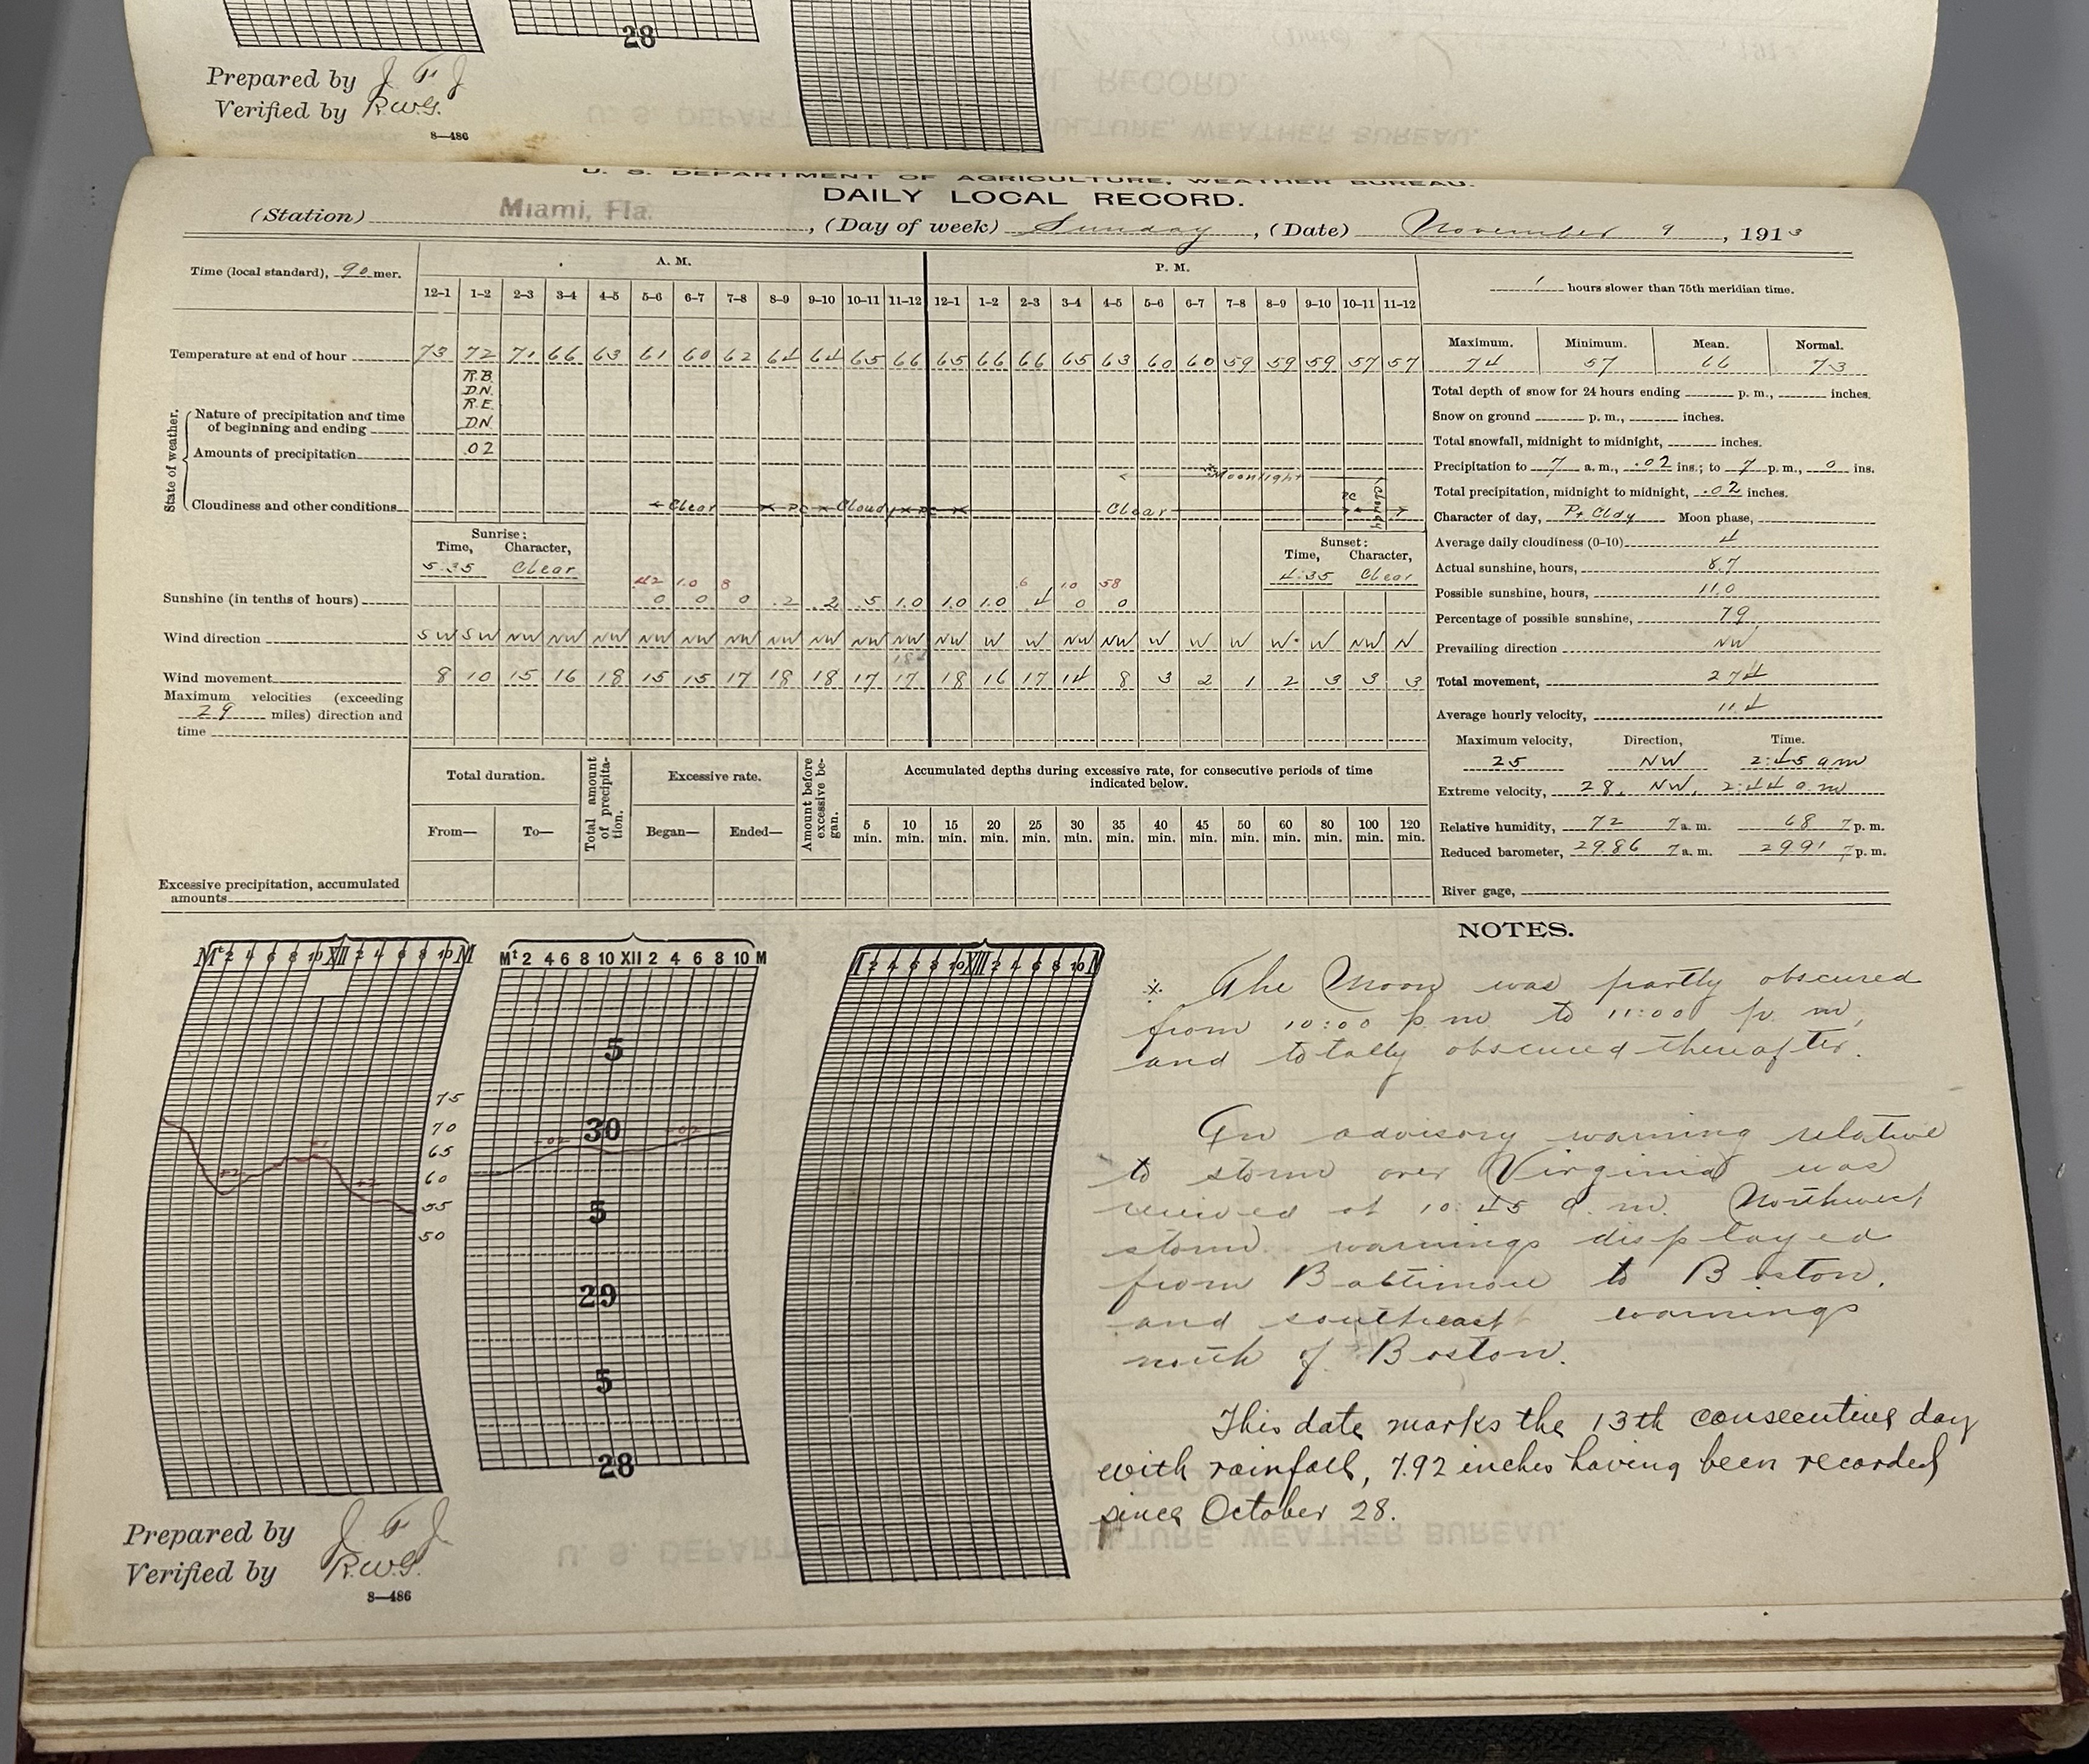
South Florida has four primary climate locations with relatively long periods of record: Miami (some records 1839-1890, continuous records 1895-present), Fort Lauderdale (some records 1839-1841, continuous records 1912-present), West Palm Beach (continuous records 1888-present), and Naples (continuous records 1942-present).
Here are maps and descriptions of the locations of the weather instruments through time: Miami, Fort Lauderdale, West Palm Beach and Naples.
Fort Lauderdale: Records Normals
West Palm Beach: Records Normals
Normals for the period 1991-2020
Normals for the period 1991-2020
Select drop-down menu for other sites and months
Select drop-down menu for other sites and years
These outlooks are issued daily by the NOAA/NWS Climate Prediction Center.
The outlooks express forecast probability that temperatures or total precipitation in the 6-10 day, 8-14 day, 1 month or 3 month periods will tend to be similar to the 10-highest ("above-normal"), middle-10 ("near-normal"), or 10-lowest ("below-normal") observed in the 1981-2010 normals period.
Color shading on the outlook maps follows standard convention for warmer/colder or wetter/drier, with near-normal in white. Darker shades of red or blue (or green and brown) indicate a higher forecast probability.
The monthly and seasonal outlooks are similar to the 6-10 and 8-14 day outlooks. However, in areas where "Equal Chances" (EC) is shown, it means that climate signals do not favor either above- or below-normal, and above-, near-, or below-normal forecast categories are equally likely to occur. A forecast of Equal Chances does NOT necessarily mean forecast conditions are expected to be near-normal.
6-10 Day Outlook |
8-14 Day Outlook |
||
Temperature |
Precipitation |
Temperature |
Precipitation |
One Month Outlook |
Three Month Outlook |
||
Temperature |
Precipitation |
Temperature |
Precipitation |
Click on one of the tabs below to see data.
Data last updated 02/19/2026.
| Miami Area | ||||||||
| WARMEST | COLDEST | WETTEST | DRIEST | |||||
| YEAR | VALUE | YEAR | VALUE | YEAR | VALUE | YEAR | VALUE | |
| 1 | 2023 | 79.9 | 1940 | 72.9 | 1959 | 89.33 | 1907 | 33.15 |
| 2 | 2020 | 79.3 | 1917 | 73.7 | 2012 | 86.94 | 1927 | 33.69 |
| 3 | 2015 | 79.2 | 1915 | 73.9 | 2020 | 86.57 | 1956 | 37.05 |
| 4 | 2019 | 79.1 | 1920 | 74.0 | 1908 | 85.36 | 1951 | 38.67 |
| 5 | 2017 | 79.1 | 1943 | 74.1 | 1929 | 84.38 | 1975 | 39.1 |
| 6 | 2022 | 79.0 | 1942 | 74.1 | 2023 | 83.43 | 1944 | 40.19 |
| 7 | 2024 | 78.6 | 1916 | 74.1 | 1968 | 83.39 | 1955 | 41.35 |
| 8 | 2025 | 78.3 | 1914 | 74.1 | 2017 | 83.12 | 1961 | 41.7 |
| 9 | 2021 | 78.3 | 1938 | 74.2 | 1966 | 82.06 | 1923 | 41.85 |
| 10 | 2011 | 78.3 | 1968 | 74.3 | 1932 | 79.9 | 1962 | 42.27 |
| Fort Lauderdale Area | ||||||||
| WARMEST | COLDEST | WETTEST | DRIEST | |||||
| YEAR | VALUE | YEAR | VALUE | YEAR | VALUE | YEAR | VALUE | |
| 1 | 2015 | 78.8 | 1969 | 74.0 | 2023 | 113.61 | 1961 | 35.54 |
| 2 | 2024 | 78.7 | 1970 | 74.1 | 1947 | 102.36 | 1971 | 38.69 |
| 3 | 2020 | 78.7 | 1966 | 74.1 | 1994 | 87.25 | 1944 | 39.72 |
| 4 | 2023 | 78.6 | 1914 | 74.7 | 1954 | 85.65 | 2011 | 40.6 |
| 5 | 2019 | 78.5 | 1973 | 74.9 | 1982 | 83.22 | 1988 | 40.66 |
| 6 | 2007 | 78.3 | 1971 | 75.1 | 1922 | 82.56 | 1955 | 41.2 |
| 7 | 2008 | 78.2 | 1954 | 75.1 | 1995 | 82.37 | 2004 | 41.38 |
| 8 | 2021 | 78 | 1980 | 75.3 | 1924 | 80.74 | 1989 | 44.77 |
| 9 | 2017 | 77.9 | 1955 | 75.5 | 1959 | 79.7 | 2009 | 45.55 |
| 10 | 2011 | 77.9 | 1952 | 75.5 | 1997 | 79.45 | 1952 | 45.61 |
| West Palm Beach Area | ||||||||
| WARMEST | COLDEST | WETTEST | DRIEST | |||||
| YEAR | VALUE | YEAR | VALUE | YEAR | VALUE | YEAR | VALUE | |
| 1 | 2020 | 78.2 | 1968 | 72.4 | 1947 | 108.63 | 1955 | 37.31 |
| 2 | 2023 | 78.1 | 1969 | 73.2 | 1897 | 87.07 | 1961 | 37.76 |
| 3 | 2015 | 78 | 1891 | 73.6 | 1994 | 85.89 | 1956 | 38.4 |
| 4 | 2022 | 77.7 | 1976 | 73.7 | 1983 | 82.71 | 1989 | 38.66 |
| 5 | 2024 | 77.6 | 1935 | 73.7 | 1901 | 82.67 | 1907 | 39.09 |
| 6 | 2011 | 77.6 | 1970 | 73.9 | 1982 | 80.62 | 1898 | 39.1 |
| 7 | 2025 | 77.5 | 1966 | 73.9 | 1969 | 79.75 | 2000 | 42.27 |
| 8 | 2019 | 77.5 | 1920 | 73.9 | 1966 | 79.75 | 1894 | 42.32 |
| 9 | 1990 | 77.5 | 2010 | 74.1 | 1991 | 79.36 | 1927 | 43.62 |
| 10 | 2021 | 77.5 | 1984 | 74.1 | 1964 | 79.3 | 1913 | 43.7 |
| Naples Area | ||||||||
| WARMEST | COLDEST | WETTEST | DRIEST | |||||
| YEAR | VALUE | YEAR | VALUE | YEAR | VALUE | YEAR | VALUE | |
| 1 | 2023 | 78.3 | 1968 | 72.5 | 1959 | 72.5 | 2023 | 26.31 |
| 2 | 2020 | 77.8 | 1981 | 72.7 | 1947 | 71.77 | 1944 | 30.6 |
| 3 | 2019 | 77.7 | 1962 | 73.1 | 2003 | 71.12 | 1956 | 33.02 |
| 4 | 2015 | 77.6 | 1970 | 73.2 | 1958 | 70.38 | 2009 | 33.9 |
| 5 | 2022 | 77.0 | 1969 | 73.3 | 2017 | 69.52 | 1996 | 34.18 |
| 6 | 2018 | 76.7 | 1966 | 73.3 | 1983 | 66.89 | 2007 | 34.95 |
| 7 | 2021 | 76.6 | 1963 | 73.3 | 1991 | 66.78 | 1988 | 35.77 |
| 8 | 2017 | 76.6 | 1955 | 73.4 | 1962 | 66.62 | 2012 | 37.91 |
| 9 | 2007 | 76.6 | 2010 | 73.5 | 2005 | 63.4 | 2011 | 38.17 |
| 10 | 1949 | 76.6 | 1977 | 73.5 | 1957 | 61.61 | 2000 | 38.97 |
| Miami Area (last updated 03/02/2026) | ||||||
| WARMEST | COLDEST | WETTEST | ||||
| VALUE | YEAR | VALUE | YEAR | VALUE | YEAR | |
| 1 | 100 | 7/21/1942 | 27 | 2/3/1917 | 14.87 | 11/30/1925 |
| 2 | 98 | 7/23/2023 | 28 | 1/28/1940 | 14.85 | 4/25/1979 |
| 3 | 98 | 7/9/2020 | 28 | 1/27/1940 | 12.58 | 4/16/1942 |
| 4 | 98 | 6/30/2020 | 29 | 1/29/1940 | 12.56 | 10/3/2000 |
| 5 | 98 | 7/2/2019 | 29 | 1/26/1905 | 11.51 | 5/4/1977 |
| 6 | 98 | 6/24/2019 | 29 | 2/14/1899 | 10.42 | 9/28/1929 |
| 7 | 98 | 5/28/2017 | 30 | 12/25/1989 | 10.04 | 9/6/1931 |
| 8 | 98 | 6/22/2009 | 30 | 1/22/1985 | 9.95 | 10/5/1948 |
| 9 | 98 | 7/3/1998 | 30 | 12/12/1934 | 9.7 | 5/22/2012 |
| 10 | 98 | 8/1/1990 | 30 | 2/19/1900 | 9.48 | 10/18/1924 |
| Fort Lauderdale Area (last updated 07/11/2024) | ||||||
| WARMEST | COLDEST | WETTEST | ||||
| VALUE | YEAR | VALUE | YEAR | VALUE | YEAR | |
| 1 | 100 | 06/22/2009 | 28 | 01/20/1977 | 22.5 | 4/12/2023 |
| 2 | 100 | 08/04/1944 | 28 | 01/19/1977 | 14.59 | 4/25/1979 |
| 3 | 99 | 07/13/1980 | 28 | 02/06/1917 | 10.85 | 10/12/1947 |
| 4 | 99 | 07/22/1966 | 29 | 01/22/1985 | 10.45 | 10/5/1948 |
| 5 | 99 | 09/13/1935 | 29 | 12/13/1934 | 10.45 | 11/19/1973 |
| 6 | 99 | 07/23/1924 | 30 | 12/25/1989 | 10.22 | 5/27/2003 |
| 7 | 98 | 05/11/2024 | 30 | 12/24/1989 | 10.00 | 10/31/1969 |
| 8 | 98 | 06/21/2009 | 30 | 12/12/1957 | 9.54 | 6/12/2024 |
| 9 | 98 | 07/13/1998 | 30 | 01/29/1940 | 9.2 | 10/20/1924 |
| 10 | 98 | 07/03/1998 | 30 | 01/28/1940 | 8.6 | 6/2/1930 |
| West Palm Beach Area (last updated 06/02/2024) | ||||||
| WARMEST | COLDEST | WETTEST | ||||
| VALUE | YEAR | VALUE | YEAR | VALUE | YEAR | |
| 1 | 101 | 07/21/1940 | 24 | 12/29/1894 | 15.22 | 4/17/1942 |
| 2 | 100 | 07/03/1927 | 26 | 03/02/1920 | 12.01 | 7/31/1933 |
| 3 | 100 | 07/02/1927 | 26 | 01/26/1905 | 10.4 | 9/24/1894 |
| 4 | 100 | 06/20/1921 | 27 | 01/20/1977 | 9.71 | 6/12/1901 |
| 5 | 99 | 05/28/2024 | 27 | 02/09/1895 | 9.7 | 10/15/1910 |
| 6 | 99 | 08/13/2006 | 28 | 12/25/1989 | 8.79 | 9/25/2004 |
| 7 | 99 | 07/26/1983 | 28 | 12/24/1989 | 8.42 | 6/10/1912 |
| 8 | 99 | 07/16/1981 | 28 | 01/22/1985 | 8.01 | 8/23/1995 |
| 9 | 99 | 04/30/1971 | 28 | 12/17/1920 | 7.36 | 10/19/1924 |
| 10 | 99 | 07/22/1942 | 28 | 02/03/1917 | 7.28 | 5/30/1897 |
These lists were compiled with the help of student volunteer Bryan Herrera.
Last Updated 11/20/24


| Min Temp Below 32 | Min Temp Below 50 | Min Temp Below 60 | Max Temp Above 90 | |
| Earliest | Dec 11, 1934 | Oct 29, 1938* | Oct 1, 1920 | Mar 2, 2003 |
| Latest | Mar 3, 1980 | May 5, 1921 | Jun 3, 1984 | Nov 6, 2002 |
| Longest Stretch | 3 days (Jan 27 - Jan 29, 1940) | 13 days (Jan 24 - Feb 5, 1940) | 38 days (Dec 25, 1980 - Jan 31, 1981) | 56 days (Jul 9 - Sep 22, 2023) |
| Min Temp Below 32 | Min Temp Below 50 | Min Temp Below 60 | Max Temp Above 90 | |
| Earliest | Dec 10, 1917 | Oct 21, 1913 | Oct 1, 1920 | Feb 14, 1948 |
| Latest | Mar 3, 1980 | May 9, 1928 | Jun 9, 1966 | Dec 8, 1919 |
| Longest Stretch | 3 days (Jan 19 - Jan 21, 1977) | 13 days (Jan 4 - Jan 16, 1956) | 44 days (Jan 24 - Feb 5, 1980) | 49 days (Jun 30 - Aug 17, 1932) |
| Min Temp Below 32 | Min Temp Below 50 | Min Temp Below 60 | Max Temp Above 90 | |
| Earliest | Dec 12, 1937* | Oct 20, 1927 | Oct 1, 1920 | Feb 10, 1949 |
| Latest | Mar 3, 1980 | May 12, 1923 | Jun 14, 1920 | Dec 9, 2009 |
| Longest Stretch | 3 days (Dec 23 - Dec 25, 1989) | 14 days (Jan 15 - Jan 28, 2003) | 39 days (Dec 24, 1980 - Jan 31, 1981) | 74 days (Jul 3 - Sep 14, 2022) |
| Min Temp Below 32 | Min Temp Below 50 | Min Temp Below 60 | Max Temp Above 90 | |
| Earliest | Nov 25, 1970 | Oct 15, 1977 | Oct 2, 1976 | Feb 18, 2020 |
| Latest | Feb 26, 1967 | Apr 29, 1992 | Jun 1, 1984 | Nov 28, 1990 |
| Longest Stretch | 3 days (Jan 18 - Jan 20, 1977) | 14 days (Jan 2 - Jan 15, 2010) | 58 days (Jan 12 - Mar 9, 1968) | 80 days (Jul 21 - Oct 8, 1944) |
Please direct any questions or comments to sr-mfl.webmaster@noaa.gov.

