|
|||||
| A tropical wave that moved across the Atlantic from near the west coast of Africa eventually spawned the tropical cyclone that became Hurricane Katrina. The tropical wave became a tropical depression near the central Bahamas late on August 22. The depression moved slowly northwest and became Tropical Storm Katrina on August 24 near the northwest Bahamas then turned west and intensified to a hurricane on August 25, a few hours before making landfall. The center of the ragged 25 mile-wide eye of Katrina made landfall along the southeast Florida coast around 6:30 PM, Thursday, August 25 near the Broward/Miami-Dade County border then moved toward the southwest across central and southwest Miami-Dade County, passing directly over the National Weather Service (NWS) Office in Sweetwater. Katrina weakened to a tropical storm before exiting the Florida peninsula into the Gulf of America early on August 26 just north of Cape Sable in mainland Monroe County then quickly regained hurricane strength in the southeast Gulf of America. The distribution of winds and rain near the center of Katrina while passing across the south Florida peninsula was asymmetrical with the strongest winds and heaviest rain located to the south and east of the center. Measurements from reconnaissance aircraft and Miami Doppler Weather Radar estimated maximum sustained winds to be 80 mph. The maximum reported sustained wind over the south Florida peninsula was 75 mph measured atop a building at the University of Miami Rosenstiel School of Marine and Atmospheric Science (RSMAS) on Virginia Key. This wind value was determined by adjusting the actual wind speed to the standard anemometer height of 10 meters. This same site recorded an unadjusted peak wind gust of 94 mph. The anemometer atop the Miami Weather Forecast Office in Sweetwater measured a sustained wind of 69 mph. Maximum sustained winds measured at NWS Automated Surface Observing System (ASOS) sites included 60 mph at Fort Lauderdale-Hollywood International Airport, 50 mph at Tamiami Airport in West Kendall and 48 mph at Miami International Airport. The maximum ASOS-measured peak wind gusts included 82 mph at Fort Lauderdale-Hollywood International Airport, 78 mph at Miami International Airport and 76 mph at Tamiami Airport in West Kendall. Other unofficial wind gust measurements included 97 mph at Homestead General Airport, 92 mph at Port Everglades, 87 mph at the Miami NWS Office in Sweetwater, 77 mph at Marco Island, 76 mph at the NOAA Facility on Virginia Key and 64 mph at Boca Raton Airport. The minimum central pressure measured over the south Florida peninsula was 983.1 millibars at the NWS site in Sweetwater. Rainfall amounts were extremely heavy across portions of south Miami-Dade County causing flooding of structures, vehicles and crop land. A maximum storm total amount of 16.33 inches was measured by a cooperative observer in Perrine. Other heavy amounts in south Miami-Dade County included 14.04 inches at Homestead Air Reserve Base, 12.25 inches near Florida City and 11.13 inches near Cutler Ridge. Most of the remainder of Miami-Dade and all of the metropolitan areas of Broward and Palm Beach counties generally received amounts of two to four inches. Rainfall over interior south Florida ranged from one to three inches with mostly less than one inch over coastal Collier County. Mostly minor beach erosion and isolated incidences of coastal flooding were observed. The maximum storm tide was estimated at three to five feet along the southwest Florida coast of mainland Monroe County. This caused damage to homes, trailers and vehicles at Flamingo early on August 26. Other maximum storm tide values included 3.0 feet at Naples Pier along the southwest coast and 2.1 feet at Virginia Key on the southeast coast. A total of six persons are known to have died directly as a result of the effects of winds and water in south Florida. Three of the deaths, all in Broward County, were in association with trees or tree limbs that were blown down. The other three deaths, all in Miami-Dade County, were associated with drownings, two on boats and one under unknown circumstances. In addition, at least another six people died from indirect hurricane effects including three from carbon monoxide poisoning caused by generators, one in a vehicle accident, one during cleanup and one associated with a lack of electricity. Several people were injured, including a number related to carbon monoxide poisoning. Preliminary damage estimates include 100 million dollars in damage and 423 million dollars in agricultural losses. |
 Infrared satellite image of Hurricane Katrina approaching south Florida from August 25 at 12:32 PM EDT (1632 UTC). 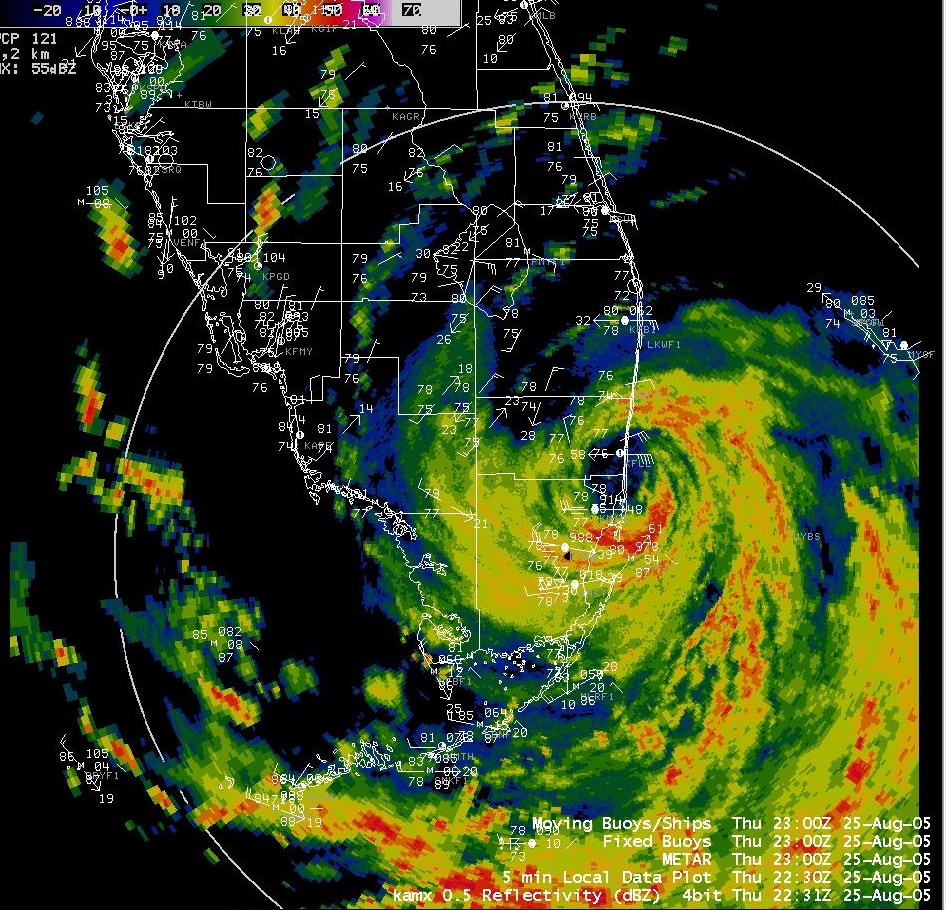 Radar reflectivity image while Katrina was crossing the coast, from August 25 at 6:31 PM EDT (2231 UTC). View animation (caution 11MB file). 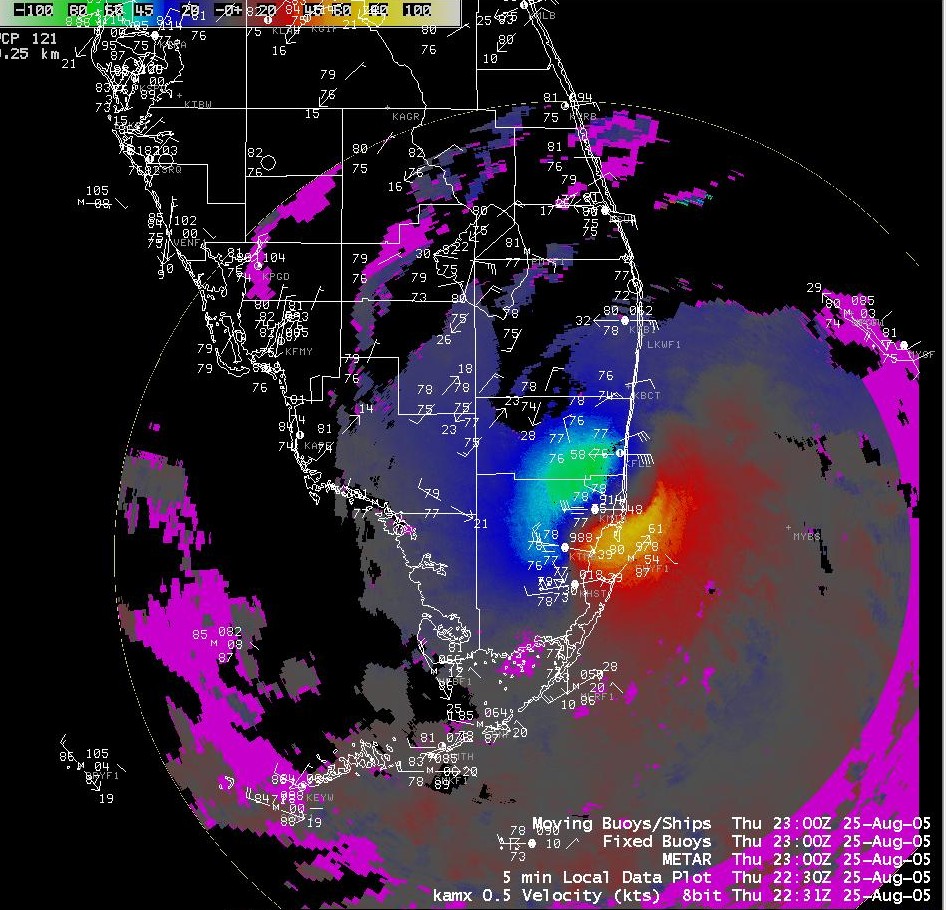 Radar wind velocity image while Katrina was crossing the coast, from August 25 at 6:31 PM EDT (2231 UTC). View animation (caution 11MB file). 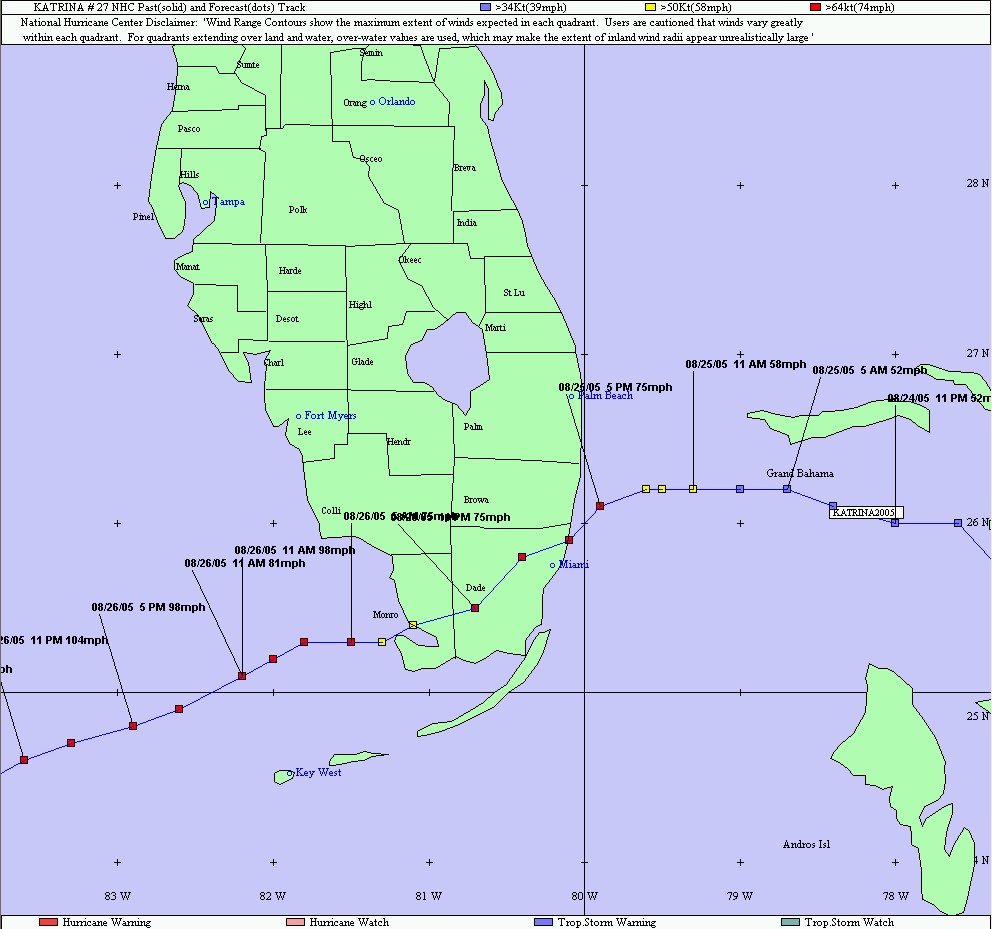 Preliminary track showing the center of Hurricane Katrina as it moved across South Florida. 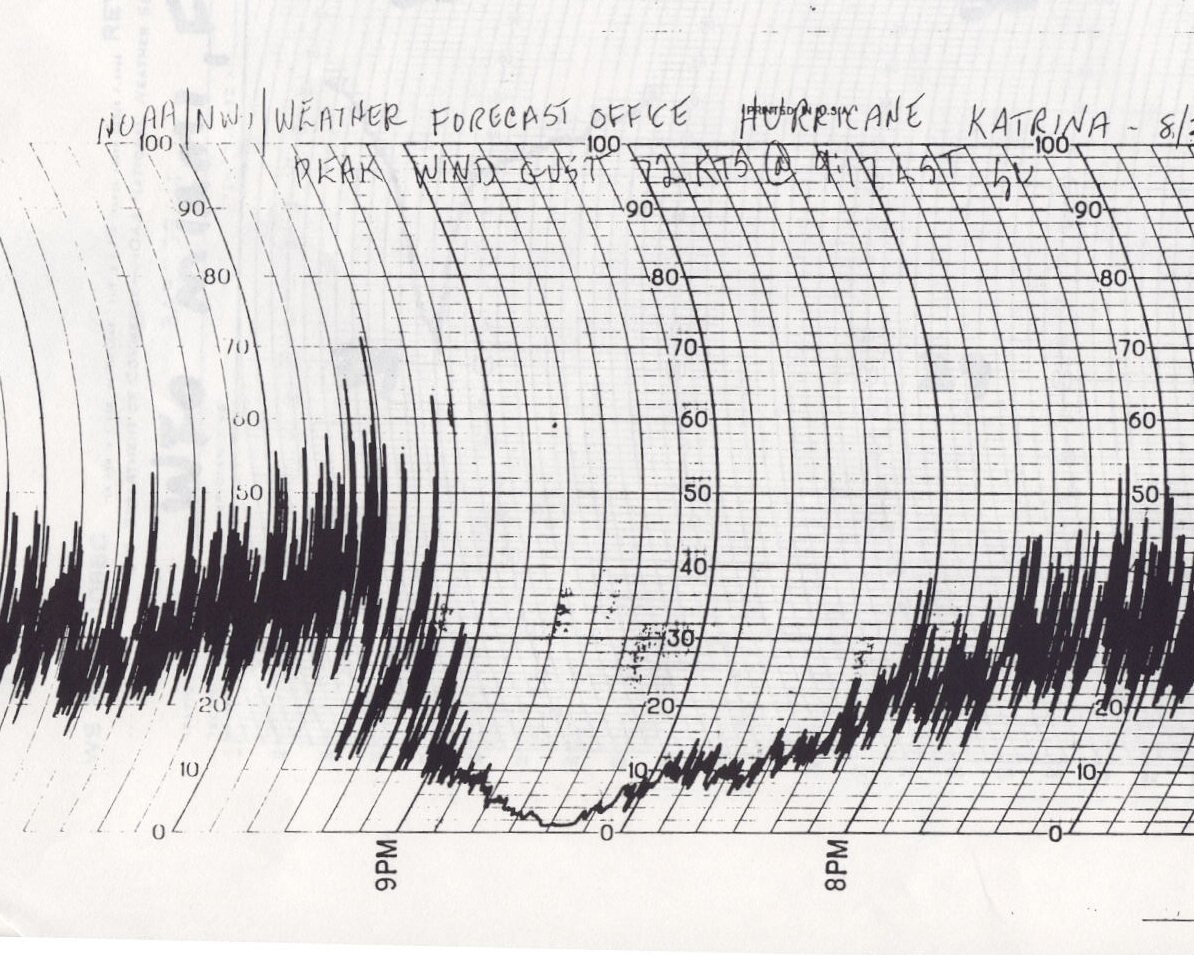 Wind gust recorder trace from WFO Miami showing peak wind during Hurricane Katrina (add 4 kt due to pen drag). 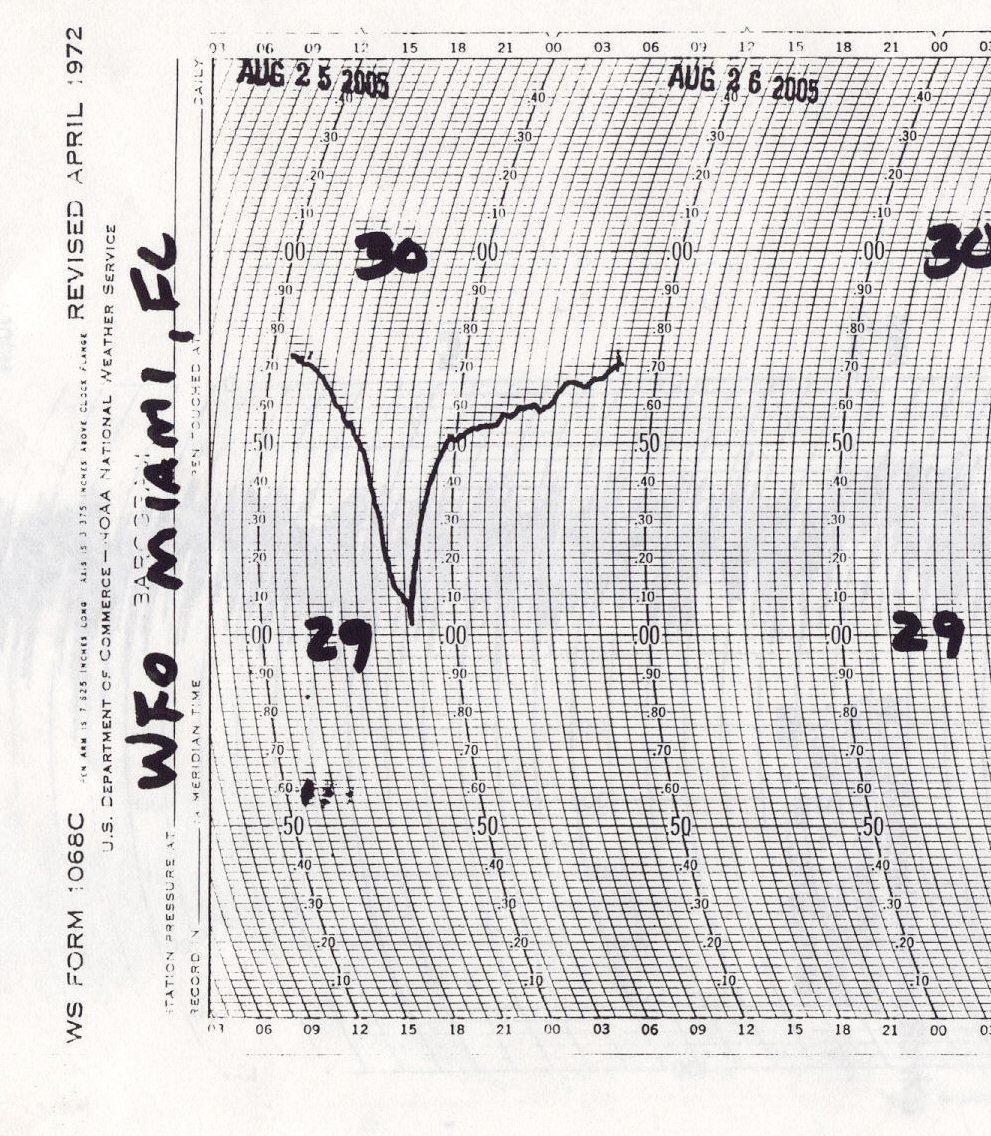 Barograph trace from the NWS Miami Forecast Office, showing lowest pressure. 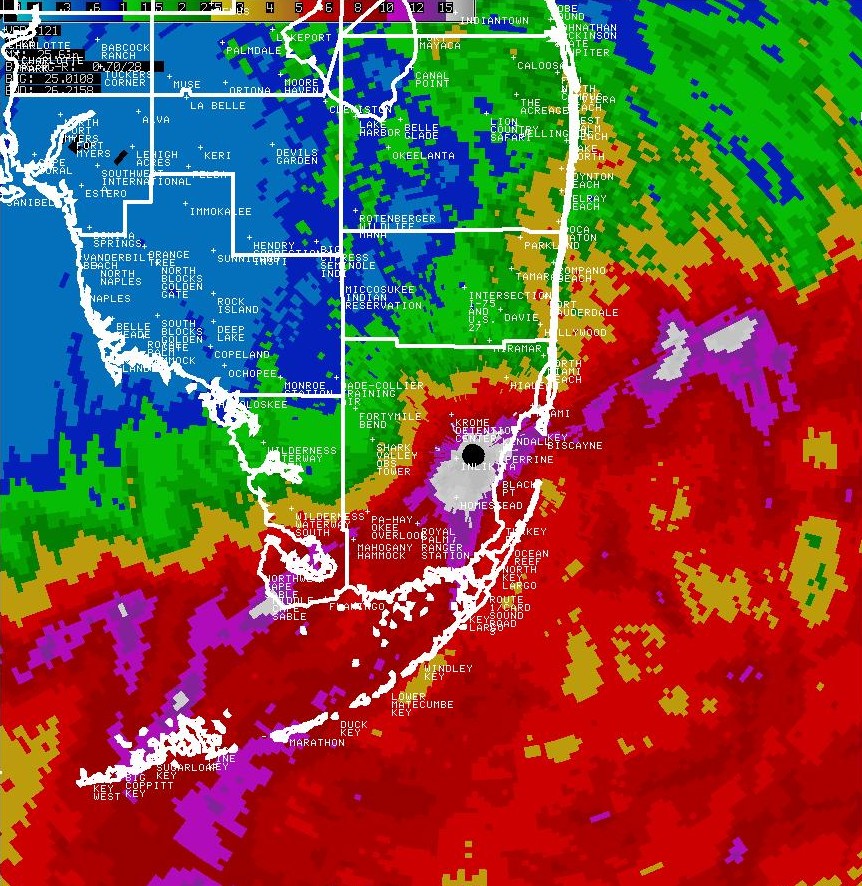 NWS Miami radar (KAMX) storm total precipitation estimate from 9 PM EDT Wed August 24 to 6 PM EDT Fri August 26. 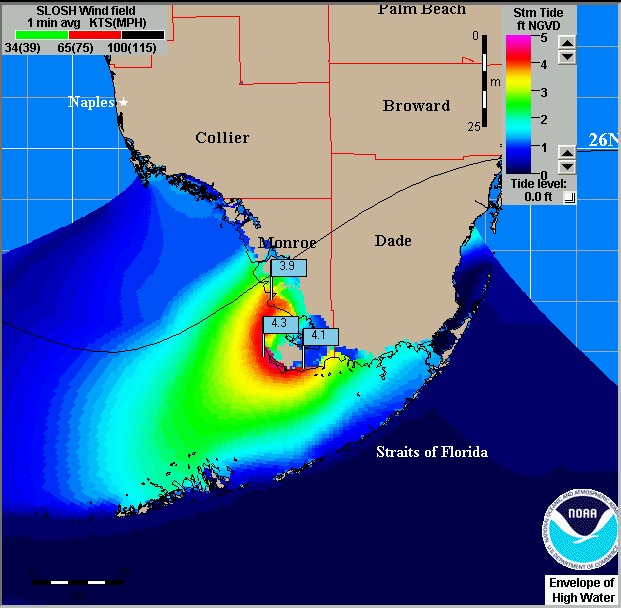 NHC/TPC storm tide simulation for Katrina across portions of South Florida in feet. Notice highest surge in the Cape Sable/Flamingo area as reported also by Everglades National Park. |
||||


