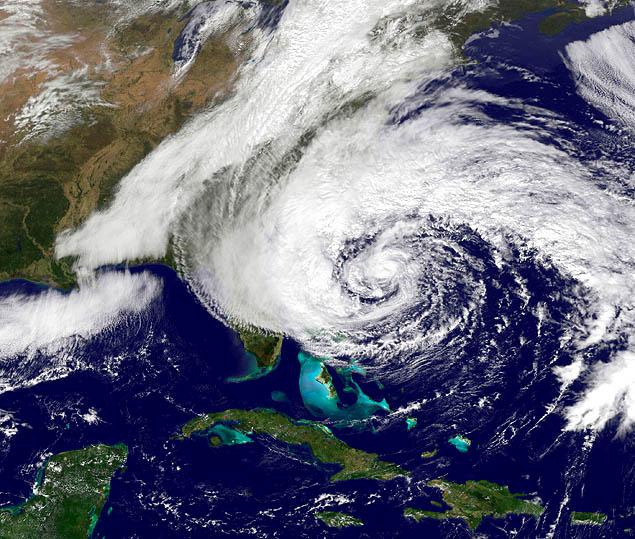
HURRICANE SANDY OVERVIEW Hurricane Sandy will always be remembered for its devastating affects through several states across the northeastern United States. Although, before Sandy became a historic and tragic reminder of the power of Mother Nature, it wreaked havoc along the southeast Florida coast as it paralleled the coastline on its trek to the north. Although Sandy did not make landfall across south Florida, it did have a significant impact, most notably with regard to the large swells produced by Sandy’s large wind field and their impacts on coastal flooding. During the weekend of October 20-21, 2012, an area of disturbed weather just south of Hispaniola began to push to the west and strengthen. By Monday October 22, 2012, this area of convection eventually developed into Tropical Storm Sandy, becoming the 18th named storm of the Atlantic hurricane season. From this point, Tropical Storm Sandy turned and moved northward, making landfall in Jamaica as a category 1 hurricane on October 24th. Sandy then further intensified into a category 2 hurricane over the waters north of Jamaica and slammed into eastern Cuba at strong Category 2 intensity. Sandy eventually weakened back down to a Category 1 hurricane while tracking across the Bahamas. Sandy then began to take on a slight northwestward motion near the northern Bahamas. It is during this time frame that the offshore Atlantic waters were heavily impacted by Sandy’s passing.
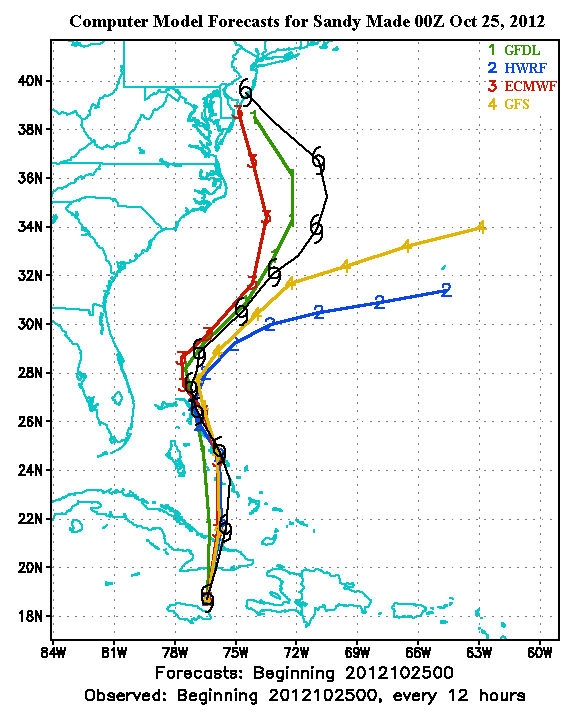
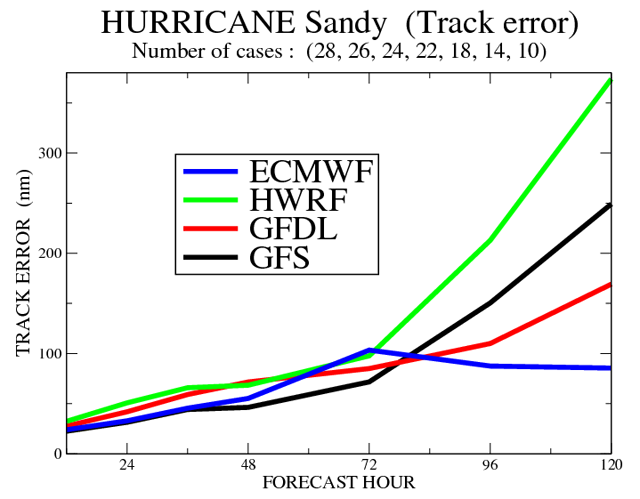
MODEL PERFORMANCE The track guidance from various forecast models was consistent, taking Sandy on a course across the Bahamas, but then deviated largely thereafter. Some models were tracking Sandy out to sea upon exiting the Bahamas, while others tracked Sandy onto the Delaware or New Jersey coast, as seen in Figure 1. The black line in the figure represents the actual storm track. Sandy’s track into New Jersey ultimately proved correct. Figure 2 shows the model performance associated with Sandy. The best model was the ECMWF (European), especially beyond 72 hours.
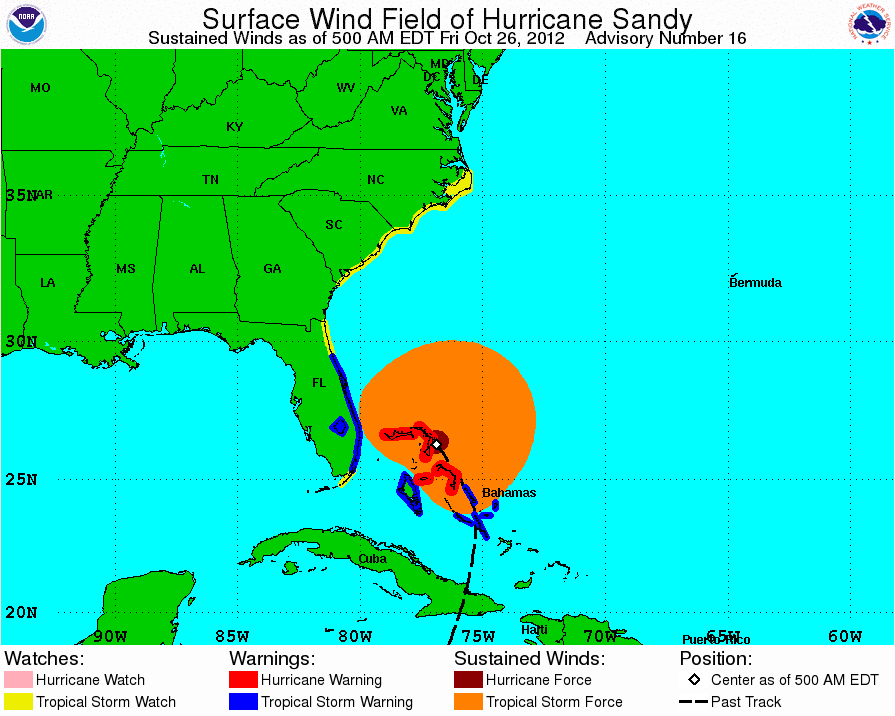
Since the models were consistent in showing a track over the Bahamas, NWS Miami forecasters were confident that a direct hit to South FL would be avoided. However, there were some differences noted. The ECMWF model generally depicted higher winds across the local Atlantic waters and the possibility of an intense rainband hitting the Palm Beach coast, while the GFS overall kept this offshore. In the end, Sandy’s western side did not become as pronounced as either model indicated, though tropical storm force winds did affect portions of the local Atlantic waters, particularly the Palm Beach waters as seen in Figure 3, although there were a few reports of tropical storm force winds further south to the Miami-Dade County coast and adjacent waters. Figure 4 is an interactive Google Map track of Hurricane Sandy.
SOUTH FLORIDA IMPACTS Sandy’s primary impact to the NWS Miami service was the large surf which resulted in significant beach erosion along with some coastal flooding (Figure 5). The wind trajectory around Sandy produced an optimal fetch which lead to the development of a large, long period NE swell which affected the waters off of the Southeast Florida coast. The swell peaked Saturday 10/27- Sunday 10/28. The pounding surf led to large breaking waves, estimated to have been as high as 10 feet at the Miami-Dade County beaches to around 20 feet, perhaps even higher, at the Palm Beaches.
Figure 5: SlideShow of waves, beach erosion, and
Large waves pummeled the entire Southeast Florida coast, resulting in significant beach erosion. Some coastal flooding also occurred. Along the Miami-Dade County coast, coastal flooding was mostly minor with the main impact being a few roads with minor ponding of water. However, coastal flooding was much worse along the Broward County coast. Significant coastal flooding occurred along A1A in Fort Lauderdale Beach, mainly between Las Olas Boulevard and NE 20th Street. This resulted in this stretch of road being closed the entire weekend, along with a few others, as well as some neighborhoods being cut off. A few homes even sustained water damage. The large waves brought sea water and sand a couple of feet deep onto A1A with the inland extent being about 2 city blocks in some locales. In Palm Beach County, the most significant impacts were experienced in the Manalapan area where beachfront structures were threatened by water intrusion. The Lake Worth Pier also sustained damage from the large waves. In all, there was an estimated $14 million in damage sustained in Palm Beach county from Sandy. Winds did not have a significant impact on the area. However, there were a few strong wind gusts observed over the Atlantic and immediate Southeast Florida coast as seen in Table 1.
Table 1: Peak Wind Gusts from Hurricane Sandy
NWS MIAMI PERFORMANCE NWS Miami began discussing the potential hazards associated with Sandy as early as the evening of Sunday, October 21st, or about 5 days prior to the event. From that point forward, the Hazardous Weather Outlook and Area Forecast Discussion products were updated to reflect the potential impacts. Eventually, Hurricane Local Statements (HLSs) were issued, with the first being issued on the evening of October 23rd and the last being on the evening of October 28th. Potential impacts were discussed with the expectation of the primary impacts being along the coast and over the Atlantic waters. Once the HLS’s were discontinued, the high surf, rip current risk, beach erosion, and coastal flood threat was addressed in Coastal Flood Statements. Eventually a Coastal Flood Warning was issued on the morning of Sunday, October 28th, when reports of a few homes and businesses being flooded came in. Also, NWS Miami dispatched on-site meteorologists to the Fort Lauderdale International Boat Show both Saturday and Sunday to provide on-site support. This decision proved very beneficial in coordinating Coastal Flood Warnings that were issued in helping the city of Fort Lauderdale manage the event.
|
|||||||||||||||||||||