|
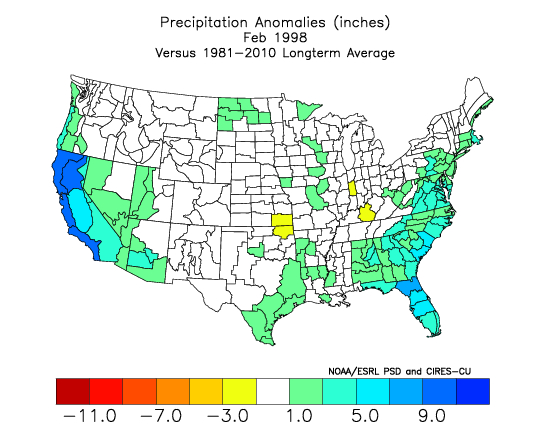
Florida Dry Season Rainfall and El Nino-Southern Oscillation (ENSO) Bart Hagemeyer The relationship between ENSO and rainfall is perhaps the most straightforward and statistically significant of all weather parameters. Daily thunderstorms on the sea breezes fueled by tropical moisture during the wet season gradually end as the transition to the Florida dry season takes place in late October and November. Occasionally a late season tropical system will bring excessive rainfall to Florida in November such as was the case with Tropical Storm Gordon in mid-November 1994. But generally, during the Florida dry season, substantial rainfall is only provided by passing extratropical disturbances in the westerlies or stalled frontal boundaries. See discussions on storminess and seasonal aspects of Florida climate for more details. Rainfall Patterns and ENSO Strong El Nino During strong EL Ninos such as in 1982-83 and 1997-98, storminess is greatly increased over Florida and the Gulf of America leading to well above average rainfall and perhaps widespread flooding. The map below shows rainfall greatly exceeding normal (in the blue areas) over Florida and California for the month of February 1998 during a strong El Nino. |
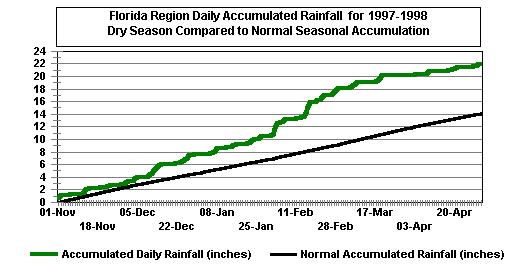
The graph below shows accumulated dry season rainfall (green) versus normal for the Florida grid from 1 November 1997 to 30 April 1998 during strong EL Nino conditions. The dry season began with above normal rainfall, and the rainfall surplus continued to build until late in the dry season when a transition to La Nina conditions began.
|
Strong La Nina Conditions were nearly the opposite during the dry season of 1999-2000 when strong La Nina conditions prevailed. The map below shows well below normal rainfall (blue) for Florida and the southeast states for the month of February 1999 when the storm track moved well to the north of the state. Note the excessive rainfall in the west also shifted northward out of California into the Pacific Northwest. |
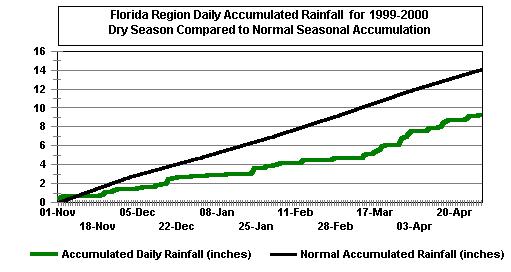
The graph below shows accumulated dry season rainfall (green) versus normal for the Florida grid from 1 November 1999 to 30 April 2000 during strong La Nina conditions. The dry season began with below normal rainfall and the rainfall deficit continued to build throughout the dry season, the opposite of the strong EL Nino case.
Predictability and Accuracy for Decision Makers
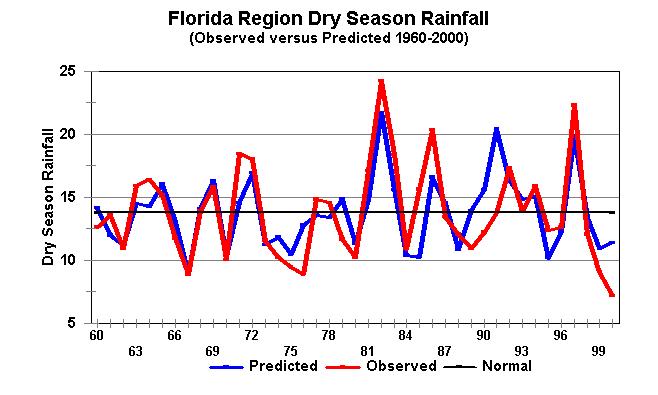
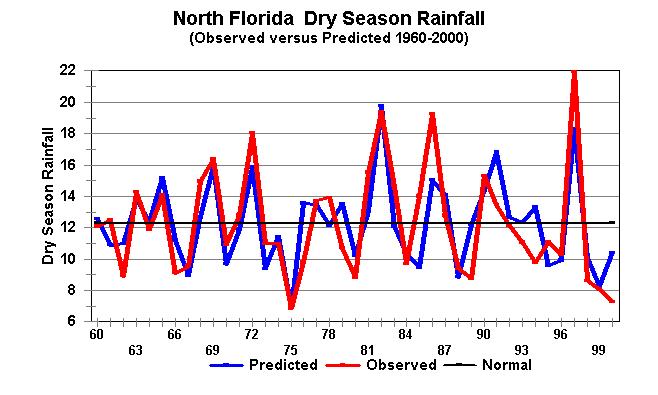
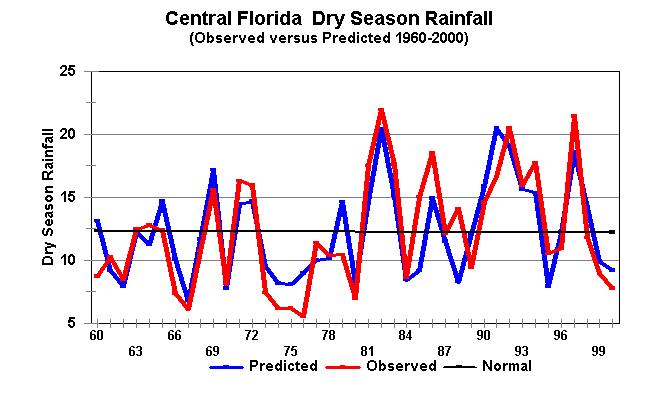
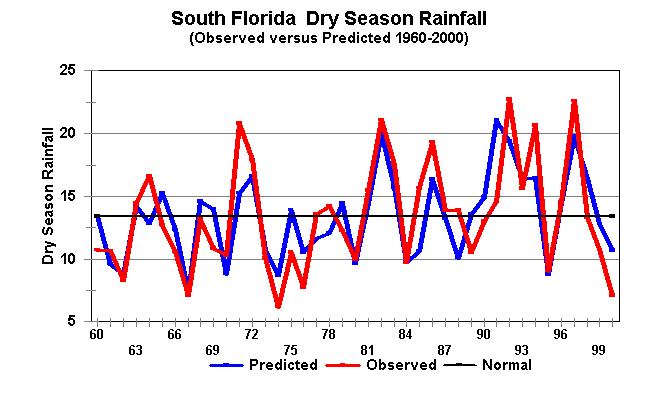
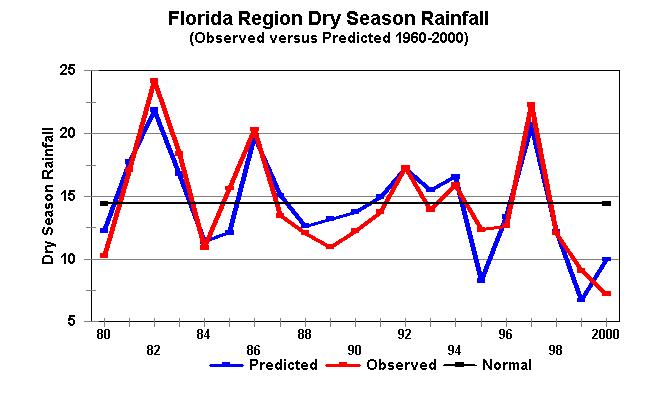
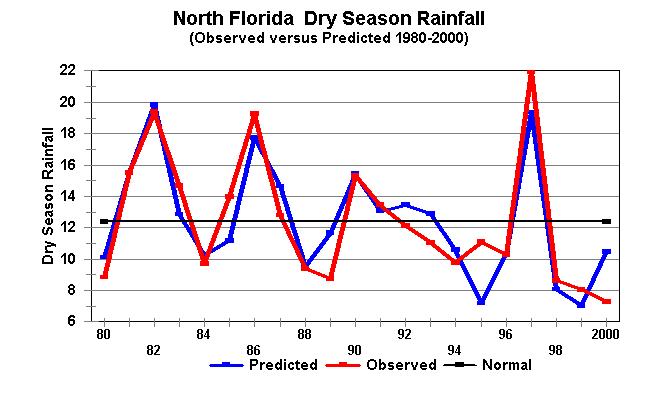
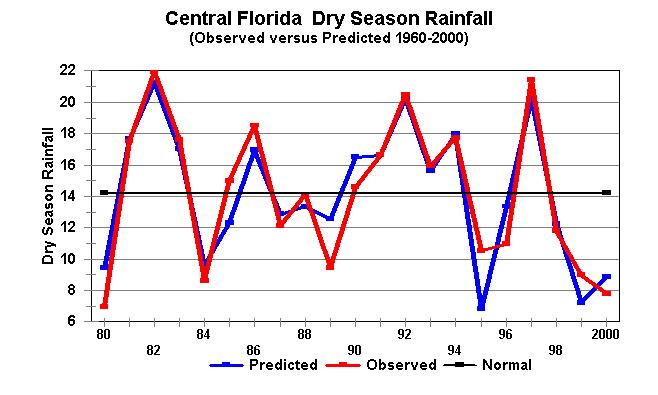
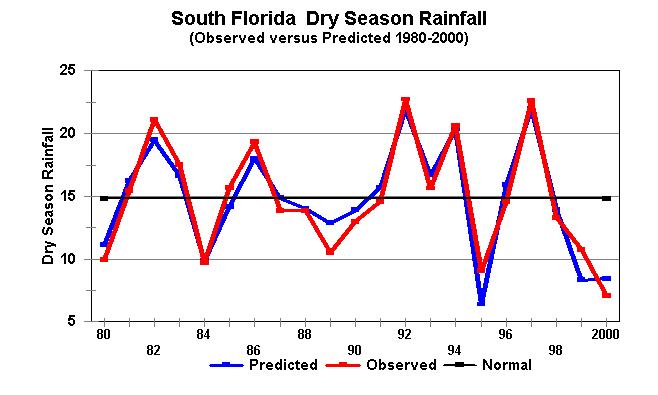
To assist potential users in evaluating the experimental dry season forecasts, charts of seasonal rainfall predictions plotted against actual rainfall are presented on the left hand side of the table below. These charts are useful for getting a feel for season-to-season variability, and a general sense of the accuracy of seasonal predictions, but they are difficult to use quantitatively. A better method of looking at the predictions is to use Taylor-Russell Diagrams as explained in:
Pielke, R. A. Jr., et al, 2000: Prediction - Science, Decision Making, and the Future of Nature.
Island Press. 405 pages. ISBN 1-55963-776-5.
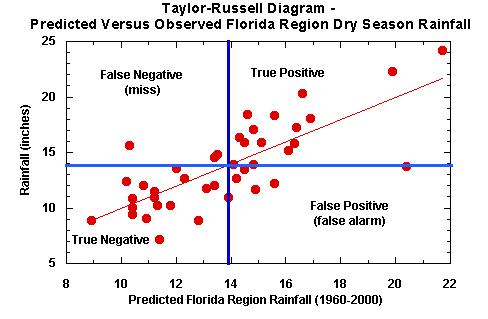
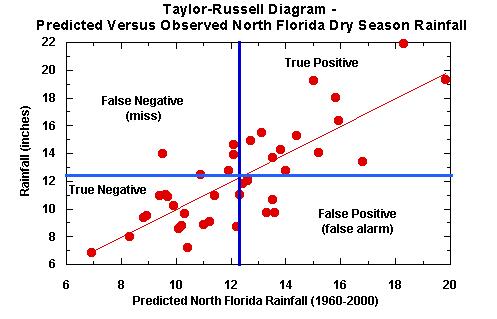
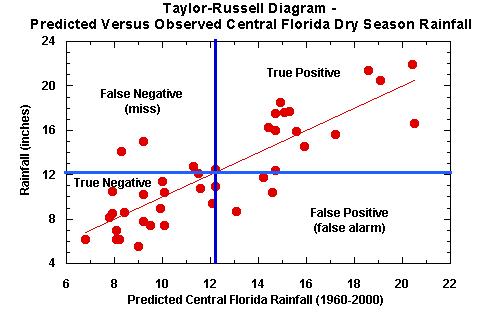
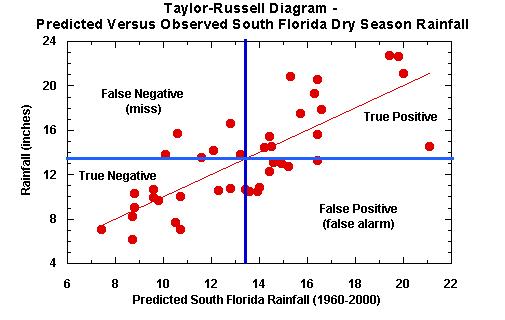
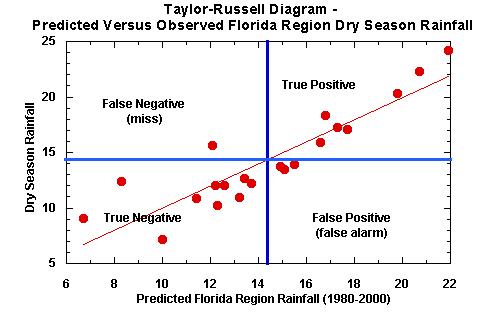
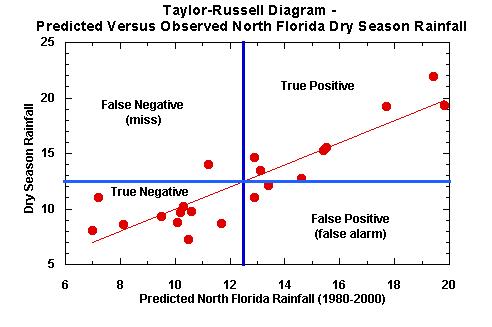
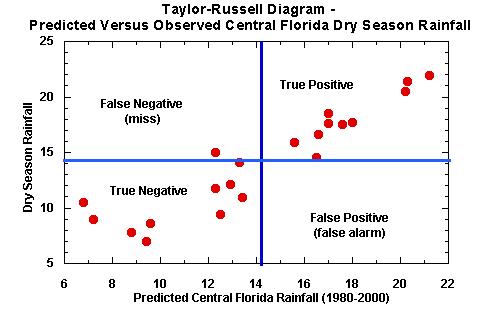
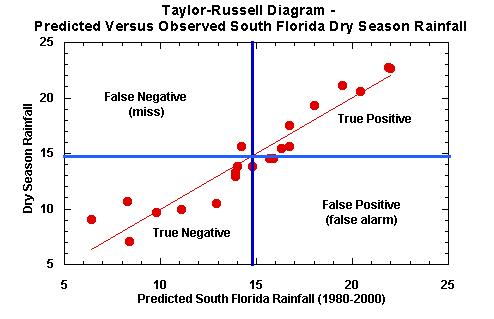
Taylor-Russell Diagrams: The scatterplot charts in the right-hand column of the table below show predicted dry season rainfall (x-axis) versus observed dry season rainfall (y-axis) for the Florida region and north, central, and south Florida from the 1960-2000 and 1980-2000 equations. These charts are designed to depict the uncertainty in the experimental predictions and assist in the decision making process. The horizontal line across the chart represents a boundary between situations requiring action, which are above the line, and situations requiring no action, which are below the line. This line is called the criterion. If the actual event exceeds the criterion, then some sort of preventative or protection action is required. The vertical line on the chart is the decision cutoff. Because decision makers cannot wait for an event to occur to take action, decisions must be made based on a prediction. It has been recognized that this type of chart can apply to almost any policy problem where decisions must be made in the face of uncertainty.
The two lines on the Taylor-Russell diagrams divide the scatterplot into four regions. The regions are labeled according to standard decision research terminology:
-True Positive: Appropriate action is taken. For example, people are warned of severe weather, and it actually occurs.
- False Positive: Inappropriate action is taken. This is often called false alarm. For example, people are warned of severe weather, but none occurs.
- False Negative: Action should have been taken but wasn't. For example, people were not warned of severe weather, but severe weather occurs.
-True Negative: No action was taken, and that was appropriate. For example, no warning was issued, and the storm did not become severe.
On these Taylor-Russell diagrams the criterion and decision cutoffs have been set for normal seasonal rainfall amounts and a line representing the theoretical perfect forecast equation has been added. Thus these diagrams reflect the uncertainty of an above or below normal dry season rainfall forecast. Individual users could set thresholds to whatever criteria was important to their particular issue.
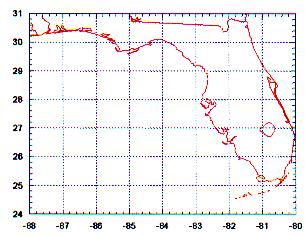
Map of Forecast Grid Areas Referred to in Charts
|
Comparison of Predicted Dry Season Rainfall to Observed |
Taylor-Russell Diagrams |
|
Florida Region 1960-2000 |
|
|
North Florida 1960-2000 |
|
|
Central Florida 1960-2000 |
| South Florida 1960-2000 | South Florida 1960-2000 |
|
|
|
| Florida Region 1980-2000 | Florida Region 1980-2000 |
|
|
|
|
North Florida 1980-2000 |
|
|
Central Florida 1980-2000 |
| South Florida 1980-2000 | South Florida 1980-2000 |
|
|
|
| Actual Rainfall Comparisons by Region (1980-2000) | Actual Rainfall Comparisons by Region (1960-2000) |
|
|
|
Schmocker, G. K., D. W. Sharp, and B. C. Hagemeyer, 1990: Three initial climatological studies for WFO Melbourne, Florida: A first step in the preparation for future operations. NOAA Tech. Memo. SR-132. 52 pp.
Hagemeyer, B. C., 2000:Development of a Low Pressure Index as a Proxy for Dry Season Severe Weather in Florida and its Relationship with ENSO. Preprints, 20th Conference on Severe Local Storms, Amer. Meteor. Soc., Orlando, FL, 439-442.
Hagemeyer, B.C. and R.A. Almeida, 2004: Extreme Interseasonal and Intraseasonal Variability of Florida Dry Season Storminess and Rainfall and the Role of the MJO, PNA, and NAO, Preprints, 15th Symposium on Global Change and Climate Variations, Amer. Meteor. Soc., Seattle, WA, CD-ROM P7.1.
Hagemeyer, B.C., 2006: ENSO, PNA and NAO Scenarios for extreme storminess, rainfall and temperature variability during the Florida dry season, Preprints, 18th Conference on Climate Variability and Change, Amer. Meteor. Soc., Atlanta, GA, CD -ROM P2.4.
Hagemeyer, B. C., 2007: Attribution of extreme variability of temperature and rainfall in the Florida dry season. NOAA 32nd Annual Climate Diagnostics and Prediction Workshop. Tallahassee, FL (10/07).
Hagemeyer, B.C., 2007: The relationship between ENSO, PNA, and AO/NAO and extreme storminess, rainfall, and temperature variability during the Florida dry season: thoughts on predictability and attribution, Preprints, 19th Conference on Climate Variability and Change, Amer. Meteor. Soc., San Antonio, TX, CD-ROM JP2.16.
Florida region seasonal forecast development: Bart Hagemeyer.
Updated 8/10/10 / last update: 10/25/13


