| Florida ENSO Education Info |
ENSO's Relationship with Florida's Climate and Predictability
Florida Dry Season Forecast and El Niño-Southern Oscillation (EÑSO)
Bart Hagemeyer
National Weather Service
Melbourne, Florida
Why a Wet and Dry Season?
Everyone agrees that Florida does not experience the four seasons of Spring, Summer, Fall, and Winter like northern latitudes, but that's about where the agreement ends. A seasonal forecast for Florida requires the definition of the seasons. There is generally an agreement that the seasons in Florida can be divided into two; the first extending from May through October, and the other from November through April. These seasons are sometimes referred to as warm and cool seasons or wet and dry seasons. Part of the problem of classifying Florida's seasons is from Florida's geographic location, which puts it squarely in a climatic transition zone. Climatology text books generally put south Florida and the Keys in the "wet and dry tropics" category and north Florida in the "humid subtropical" category, which also includes much of the southeast United States. As you move from extreme south Florida to extreme north Florida you transition from classic tropical wet and dry seasons to what is more aptly described as cool and warm seasons. This is because extreme north Florida is subject to more extratropical cyclone passages in the northern winter months, receiving more rainfall during the time that south Florida is experiencing its true "dry season". In addition, northern Florida's temperature difference between seasons is more noticeable compared to southern Florida. Central Florida is the transition zone and research at NWS Melbourne has led to the concept that the Florida peninsula south of 30 degrees north latitude clearly experiences wet and dry seasons on a consistent basis, while north of 30 degrees experiences more variability in seasonal types from year to year. In north Florida, at the southern limit of the humid subtropical climatic region, some years could be more aptly described by wet and dry seasons and others by cool and warm seasons. To attempt seasonal forecasts representative of the Florida region it was decided to use the wet and dry convention that applies to the great majority of the state of Florida, and is perhaps a better descriptor of the significance of seasonal impacts. While some debate may continue on this issue, it is largely a matter of semantics as we need to call the two 6-month seasons by some name, and it allows forecasting to go on and does not seriously effect the interpretation of the results.
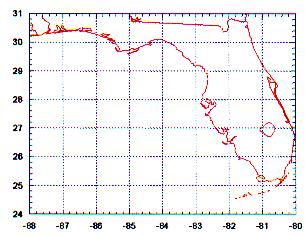
Florida Forecast Grid
Reduced to their simplest terms, climatic controls in Florida are due to the effects of solar radiation on the land and water, the resultant local circulations modified by regional wind regimes, and the effects of passing tropical and extratropical disturbances in the atmosphere.
The following five graphs of monthly environmental variables averaged over the Florida forecast grid illustrate these seasonal climatic controls affecting the Florida region.
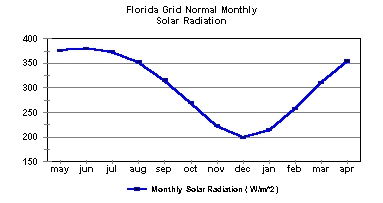
Mean solar radiation (at top) is highest during the 6-months from April through September and lowest from October through March. It reaches a maximum in June and a minimum in December which corresponds to the summer and winter solstices.
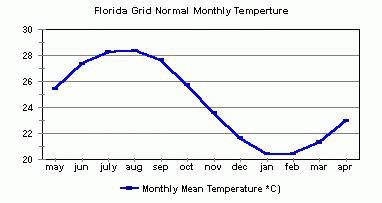
Mean Florida temperature (at bottom) is highest in July/August and lowest in January/February; showing temperature maximums and minimums lagging behind the mean solar radiation by about two months. Analyzing these two graphs, we see that mean temperature over the Florida region is largely determined by the amount of solar radiation received (i.e. Incoming Solar Radiation which is known as insolation).
East Central Florida Wet/Dry Season Onset Study
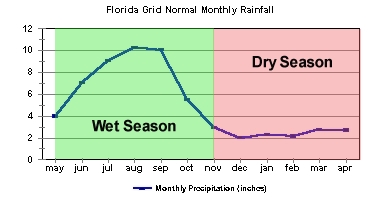
However, when looking at Florida's average monthly rainfall a different relationship emerges. Precipitation increases dramatically in May, peaking in August and September, then drops rapidly until November. Precipitation then remains steady between 2 and 3 inches a month for the 6-month period from November through April. The "Wet Season" rainfall (from May through October) is dominated by daily solar radiation induced sea breeze thunderstorms that are fueled by the increase in available moisture from the warmer waters surrounding Florida and from passing tropical disturbances. During the "Dry Season" (from November through April) there is not enough solar radiation and available low level moisture to produce daily cycles of rainfall from local circulations. During the dry season Florida is almost entirely dependent on passing extratropical cyclones or disturbances in the westerlies to bring rainfall.
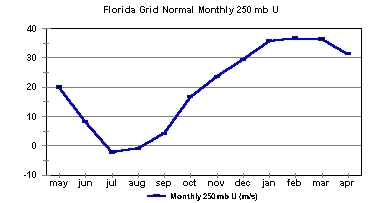
Next we look at the mean monthly westerly winds (U) at jet stream levels (250 mb or about 35,000 feet) to expand further on the above concepts. In the wet season (May - October) the jet stream's influence steadily weakens. The upper level winds reach a minimum (actually below zero, or easterly) in July and August. During much of the wet season local circulations such as sea breezes dominate rainfall production. This is also the time when the high level westerly shear is at its weakest and most likely to allow for development of tropical cyclones which could otherwise be destroyed by strong upper level westerlies. In contrast, the dry season (November - April) is characterized by strong jet stream winds that reach their maximum from January to March. These strong jet stream winds signify the dominance of large scale disturbances in the westerlies over Florida's weather. Average rainfall is low at this time because the daily sea breeze rainfall has stopped and passing disturbances in the westerlies are on average not that common.
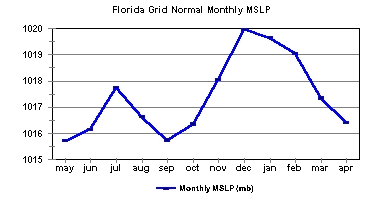
A look at monthly mean sea level pressure (MSLP) broadly illustrates the two major "stormy" periods over the Florida region. The first is during the transition from the dry season to wet season (from March to June) when disturbances in the westerlies increase late in the dry season and increasing moisture and solar radiation early in the wet season combine to form violent weather. The second is deep in the wet season (from August through October) when tropical disturbances are most likely to come near Florida. Climatologically July is unique because it is too late to have the passage of any disturbances in the westerlies and too early for tropical cyclones in the easterlies and storm activity in the Gulf of America is less likely. November is a transition month that has seen both tropical and extratropical cyclone activity, but a little later in the the dry season (December and January) passing tropical disturbances are less likely.
It is important to remember that all of the above discussion refers to Florida's "normal" conditions. This is useful information for understanding the "big picture" of why Florida's weather is the way it is and for setting benchmarks, but the weather is rarely "normal". There is great benefit to everyone if significant deviations from "normal weather" could be predicted. Larger scale weather phenomena such as the El Nino-Southern Oscillation (ENSO) can greatly affect the normalcy of Florida's seasons. Our understanding of how ENSO affects Florida dry season weather is rapidly advancing and we'll focus our efforts on predicting dry season weather first. The ability to understand and predict ENSO's affect on Florida's wet season, outside of its well-established affect on Hurricane Season, is not as advanced. There are many more subtle regional and local factors involved in the wet season than those of the predominantly large-scale climatic controls of the dry season.
Florida Dry Season Forecast and El Nino-Southern Oscillation (ENSO) - How ENSO Works
Bart Hagemeyer
National Weather Service
Melbourne, Florida
The EL Nino-Southern Oscillation or ENSO is a complex phenomena and an excellent ENSO Tutorial is available from the Climate Prediction Center. ENSO relates to changes in sea surface temperature and sea level pressure over the equatorial regions of the Pacific Ocean. ENSO has a warm phase (El Nino) and a cold phase (La Nina). The focus in this discussion will be the atmospheric responses over the Northern Hemisphere and Florida region to ENSO.
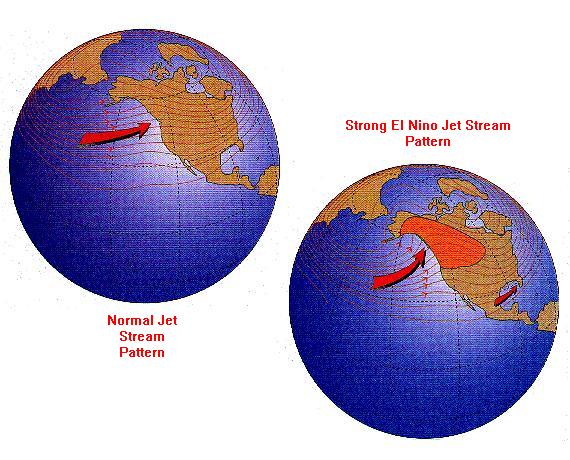
The concept of strong El Nino's affecting the normal jet stream pattern is fairly well known and generally accepted. Our goal is to quantify this relationship and further analyze how Florida is affected by it so the relationship can be better understood.
The jet stream is a global phenomena that has perhaps the greatest influence on Florida dry season weather. The picture above is a jet stream chart for a single day in February 1998. You can see the jet stream as it circles the Northern Hemisphere around approximately 30 degrees north
So how does ENSO, or more specifically the sea surface temperatures (SSTs) in the central equatorial Pacific, affect Florida's dry season? To answer this, environmental variables averaged over the NINO 3.4 area (the commonly used measurement of ENSO) and the Florida region were correlated using multiple linear regression techniques to objectively determine if a relationship exists and to attempt to forecast it.
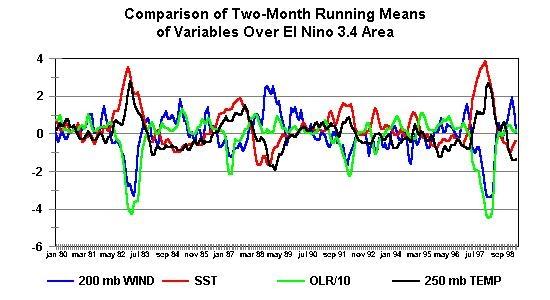
The graph above compares mean monthly 200 mb wind, SST, Outgoing Longwave Radiation (OLR), and 250 mb temperatures from 1980 through 1998 averaged over the Niño 3.4 area. It is obvious that even though we are looking at an equatorial area there is significant month to month and year to year variability in the parameters. Two significant anomalies where all the variables appear closely linked stand out centered around the dry seasons of 1982-83 and 1997-98 - the two great El Niño's of the last half of the 20th Century.
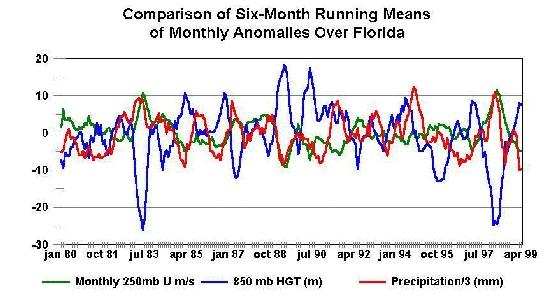
Now we look at a graph of mean monthly jet stream winds (250 mb U), 850 mb heights, and precipitation averaged over the Florida grid and compare it to the same graph for the Niño 3.4 region. From this graph we see that there was a Florida response to the NIÑO 3.4 conditions during the strong El Niño's of 1982-83 and 1997-98. This then leads to the questions: "Does this relationship generally hold true for all EÑSO conditions and can it be forecasted?"
In the Niño 3.4 region increasing SST's mean an increase in the development of thunderstorm complexes along the Intertropical Convergence Zone (ITCZ). The resulting widespread deep convection (which typically reaches its peak in the northern hemisphere winter) results in extensive cloudiness, upper tropospheric warming, and strong upper level divergence. The net effect greatly reduces outgoing longwave radiation and a reduction of equatorial upper level winds. The below infrared GOES satellite image of 21 February 1998 further illustrates this relationship.
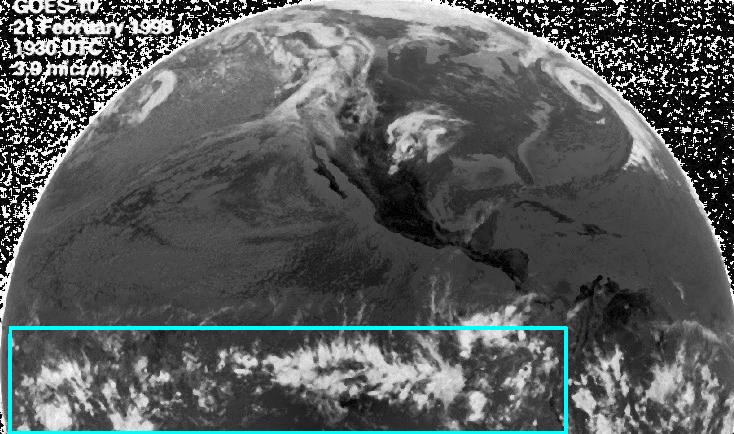
Numerous Thunderstorm Clusters in the EÑSO Source Region of the Tropical Pacific
These next few images relate changes in EÑSO to our Northern Hemisphere variables.
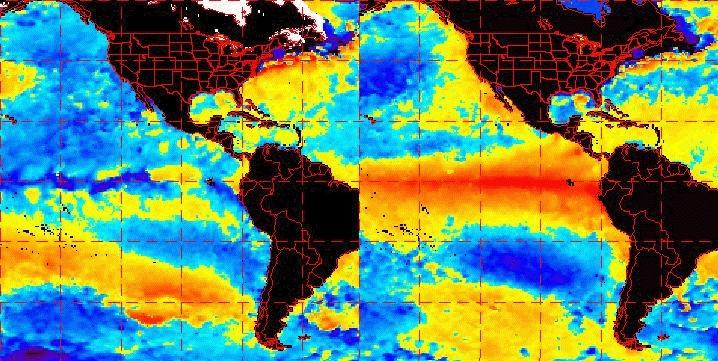
The image above compares the mean monthly SST anomalies for February 1989 on the left during strong La Niña conditions (cold phase) with the anomalies for February 1998 on the right during strong El Niño conditions (warm phase).
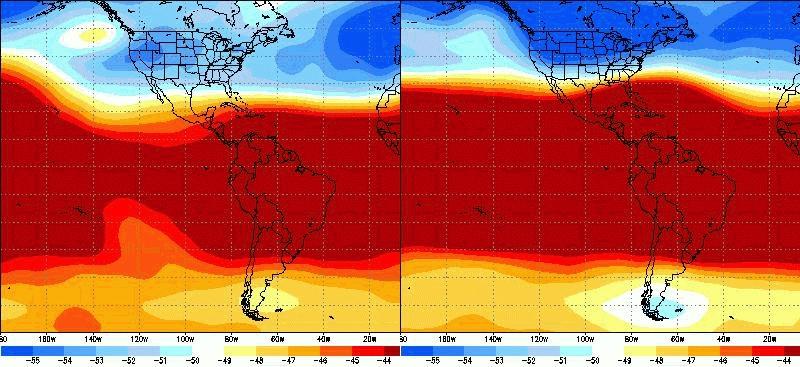
This image (above) compares the mean monthly upper tropospheric temperatures (250 mb) for the strong La Niña (left) and strong El Niño (right). As mentioned previously the net effect of warmer/cooler SSTs is warmer/cooler than normal temperatures at high levels. Strong EL Niño conditions (such as on the right) results in a much stronger temperature gradient between the equator and the northern pole at approximately 30 degrees north latitude.
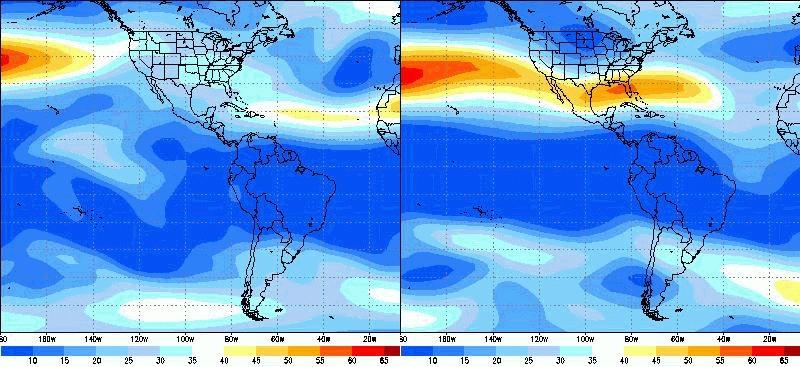
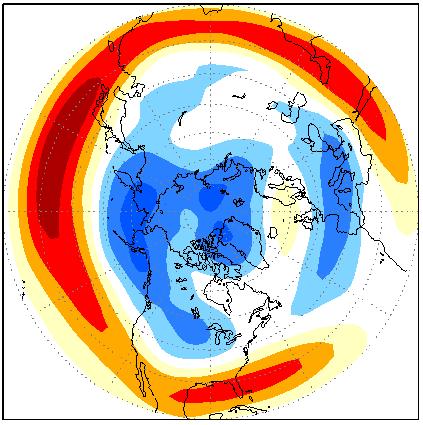
In basic meteorology we learn that the jet stream exists along the extreme temperature gradient between the equator and the northern hemisphere pole. The above jet stream charts for the strong La Niña (left) and strong El Niño (right) show this concept at work when you compare the location and strength of the temperature gradient (from 2 images above) to the location and strength of the jet stream (above). The two coincide in both position and intensity.
Another way to view this temperature/jet stream link is in this next image below. It presents a close-up view of the effects of El Niño (top) and La Niña (bottom) over the Gulf of America and Florida region. Now compare the upper tropospheric temperature gradient of the La Niña (bottom left) with El Niño (top left) and their corresponding 250mb winds. Note that the mean jet stream controls the location of the storm track or passage of disturbances in the westerlies and that these passing disturbances largely control Florida's dry season weather. Putting all of this together we find that Florida is a lot more stormy during El Niño conditions (top) when there is a strong jet located close to Florida than with La Niña conditions (bottom) when there is very little jet stream action. Remember that the jet stream is a result of the upper level temperature gradient which is affected by EÑSO conditions in the tropical equatorial pacific. A more rigorous explanation of how EÑSO affects the northern hemisphere storm tracks is referenced below. However, the above discussion and illustration are sufficient to explain the EÑSO influence for our purposes of education and understanding.
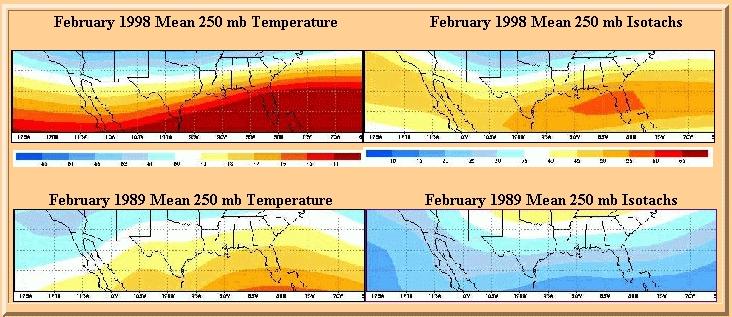
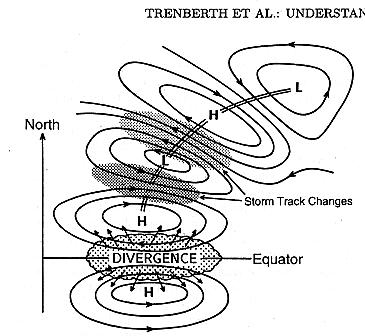
(from: Trenberth et. al.,1998: Progress during TOGA in understanding and modeling global teleconnections associated with tropical sea surface temperatures. Journal of Geophysical Research, Vol. 103. NO. C7, 14291-14324.)
The net effect of a strong La Niña and a strong El Niño is to influence the mean storm track which affects the passage of highs and lows over the Florida region and their attendant weather. La Niña's bring in fewer storms and more persistent high pressure systems which results in a greater than normal threat of drought and wildfire to Florida. El Niño's bring in more frequent and stronger storms which results in a greater than normal threat of severe weather, excessive rainfall, and coastal storms.
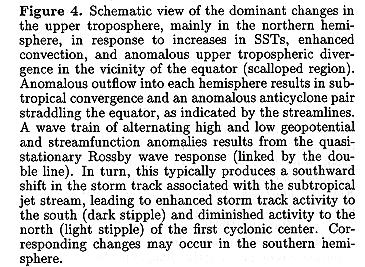
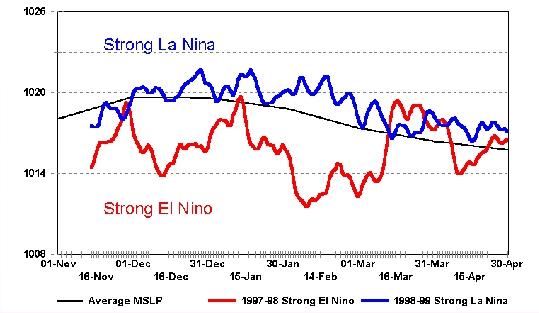
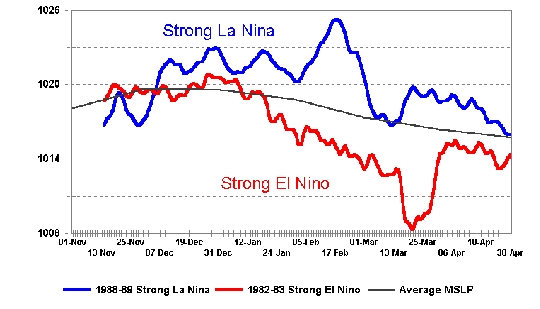
The graphs below illustrate the impact of La Niña and El Niño on daily Mean Sea Level Pressure (MSLP) over the Florida grid. They show that strong El Niño's result in much lower than normal MSLP due to the more frequent passage of extratropical cyclones, while strong La Niña's result in higher than normal MSLP due to less frequent passage of extratropical cyclones and the dominance of higher pressure.
This brings the effects of EÑSO down to a common measure of the atmosphere that both lay persons and professionals can relate to. Specific discussions of "storminess" and severe weather are included in separate sections. If these departures from normal could be reliably forecast for the dry season then preparedness and mitigation activities could be greatly improved which is the ultimate goal of this web page.
Stanley A. Chagnon ("Impacts of 1997-98 El Niño-Generated Weather in the United States" Bulletin of the American Meteorological Society, Vol. 80., #9,1819-1827) noted that there are positive as well as negative impacts in the United States from extremes of EL Niño and La Niña. For example the strong EL Niño of 1997-98 brought devastating storms to Florida and the southeast, but saved billions in heating oil costs in the northern United States. El Niño and La Niña extremes cause regional imbalances in weather extremes - some benefit - some suffer. Unfortunately, Florida is a region that can suffer greatly at the hands of both La Niña and El Niño.
Florida Dry Season Forecast and El Niño-Southern Oscillation (EÑSO) - Predictability
Bart Hagemeyer
National Weather Service
Melbourne, Florida
As we have discussed there are strong relationships between Florida weather and the two extreme phases of ENSO (El Nino and La Nina), but can they be forecast for all ENSO conditions? In other words, can the Florida dry season variables be reliably and routinely forecast from Nino 3.4 measurements? A more complete discussion can be found in Hagemeyer (2000) and Hagemeyer (2002).
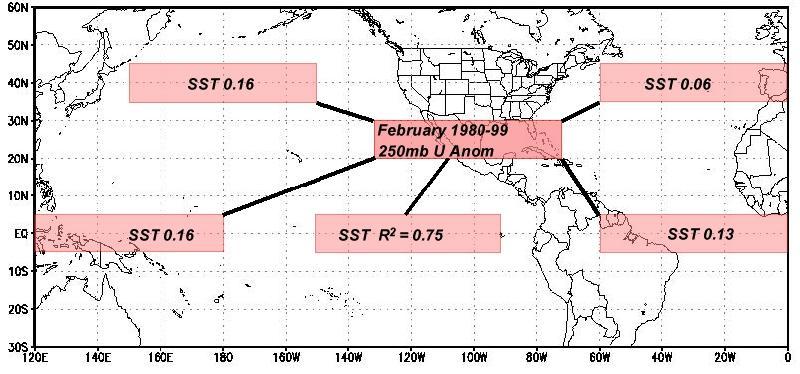
As an experiment, mean monthly February 250 mb jet stream winds over an area including Florida, northern Mexico and the Gulf of America were correlated with SST's over several areas of the north/south Atlantic and Pacific Oceans including the Nino 3.4 area to see if relationships might be random. The areas compared are indicated above with the correlation coefficients for SST versus Florida region jet stream. The Nino 3.4 area shows a high and significant correlation of .75 (1.0 being perfect) while other regions show very low and insignificant correlations (0.0 being no correlation). This adds weight to the idea that Nino 3.4's relationship to Florida weather is not a result of random chance, but rather based on a physical relationship that is predictable.
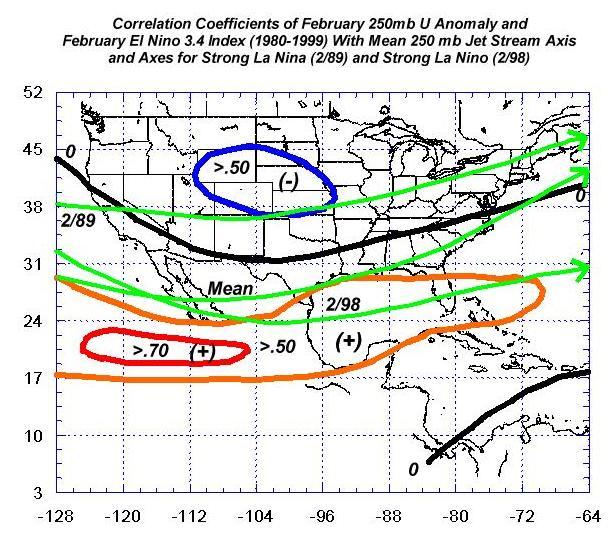
To further investigate the issue of predictability, mean February jet stream winds from 1980-1999 for the Florida grid and other areas equal to the Florida grid indicated on the map above were correlated with mean February SST over the Nino 3.4 area. An analysis of the gridded correlation coefficients was completed and an area of significantly higher positive correlation was found from the eastern Pacific Ocean, across Mexico and the Gulf of America to Florida (i.e. higher/lower Nino 3.4 - higher/lower jet stream winds) while an area of high, but less significant, negative correlation was found over the central plains (i.e. higher/lower Nino 3.4 - lower/higher jet stream winds). The green lines are the jet streams for 2/98 (strong El Nino), 2/89 (strong La Nina) and mean conditions. It would appear promising that the state of ENSO can be reliably used to predict the mean position of the jet stream relative to Florida during the dry season.
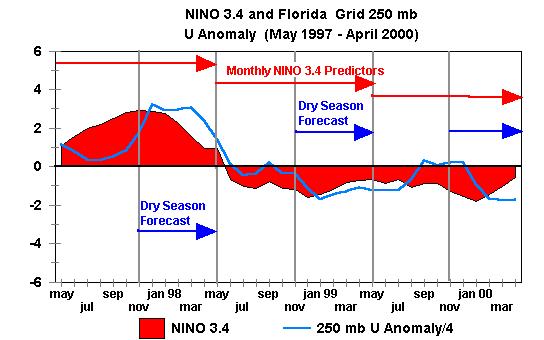
Hagemeyer (2000) and Hagemeyer (2002) contains extended commentary on exploratory data analysis and multiple linear regression tests leading to experimental dry season forecasts that will not be repeated here. However, the graphic above illustrates how the seasonal forecasts are made by using 250 mb U anomaly as an example.
Observed and forecast monthly SST anomaly values of the Nino 3.4 region from May through April (indicated by red arrows) are used to predict the value of 250 mb U anomaly averaged over the Florida grid from the following November through April (indicated by blue arrows). Trends in ENSO values are very important in the prediction of subsequent weather as they act as leading indicators. The intent is to forecast Florida dry season variables as far in advance as possible using CPC Nino 3.4 forecasts . For example in May of 2001 the first forecast for the 2001-2002 dry season will be made (November 2001 - April 2002). However, there are two significant issues involved: 1) the accuracy of the multiple linear regression equations in accounting for the relationship between the Nino 3.4 region and Florida regional variables, and 2) the accuracy of the CPC Nino 3.4 predictions themselves. Any users of this information should read and understand the forecast disclaimer.
Researchers have found that the skill of a forecast often depends on the phase of the ENSO cycle. For example, it is well known that periods with strong SST anomalies (either positive or negative) are more predictable than periods with weak or neutral SST anomalies. In other words, with strong anomalies and well-established trends, forecasting should be more accurate than during weak anomalies and no clear trends developing. The skill of the forecast may well depend on the period of record. The experimental forecasts here are based on the period of record from 1980 -1999 for severe weather variables and from 1960-2000 for storminess and rainfall variables. Certain time periods have stronger correlations than other time periods and there seems to be about a 20 year periodicity in prediction accuracy.
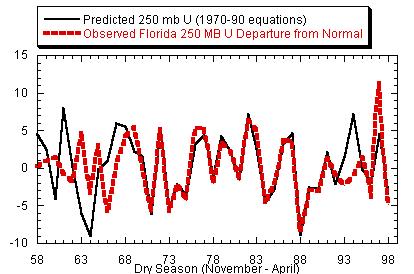
The period from 1970-90 showed the highest correlation to the Nino 3.4 region. The graph above is an example of a test of forecasting 250 mb U anomaly for the 1958 - 1998 dry seasons using the equations from just 20 years of data between 1970 and 1990. In other words forecasting backward and into the future. Notice the results are very accurate for the 70-90 period, and noticeably worse before 1970 and after 1990. Using 41 years of data for the forecasts give more reliable results; however, there is no guaranty that there are not other physical cycles that may change the accuracy of the equations in the future.
Landsea and Knaff (2000: How Much Skill Was There in Forecasting the Very Strong 1997-98 El Nino? BAMS Vol. 81, No. 9, September 2000) discuss in some detail the accuracy of various statistical and dynamical models in predicting the recent strong EL Nino of 1997-98. There are statistical models (such as the multiple linear regression model used in this experimental forecast), and dynamic and coupled ocean-atmosphere models of varying complexity. Many of these models work on a large scale, but smaller scale, regional, statistical models may offer the best hope in the near future. If forecasting ENSO itself is a challenge - then more so are the effects of ENSO on a regional scale. This discussion highlights the potential for improved short-term climate forecasts in the extratropics, although with the caveat that predictability is somewhat limited.
The relationship between Florida weather and ENSO is not just a simple "one-to-one" relationship, but more likely a "tangled system" in which other environmental factors such as Pacific North American Oscillation (PNA), North Atlantic Oscillation (NAO), Arctic Oscillation (AO), and the Madden Julian Oscillation (MJO) may play a role from time to time. The relationship of such tangled systems are illustrated below:
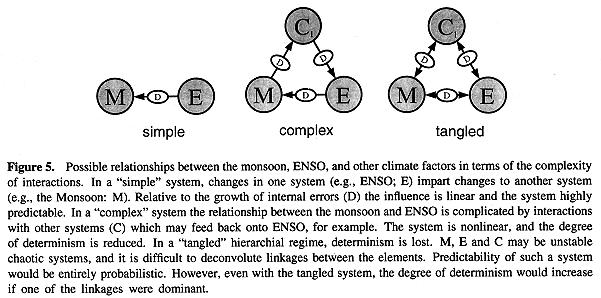
(from Webster et al., 1998: Monsoons: Monsoons:Processes, predictability, and the prospects for prediction. Journal of Geophysical Research, Vol. 103, NO. C7, 14451-14510.)
"A major challenge will be to utilize the uncertain forecast information in the best way possible throughout the different sectors of society. The need for regional specificity presents a particular challenge. Both the applications communities and the social science communities require regional information that is as detailed as possible. Yet Predictability inherently becomes less on smaller space and timescales because the natural variability is larger." Trenberth et al (1998).
Electronic-Publications on Florida Climatology
_____, and J. S. Carney, 1996:Florida Weather History Interactive Resource Library (WHIRL). Preprints, 12th International Conference on Interactive Information and Processing Systems for Meteorology, Oceanography and Hydrology. Atlanta, GA, Amer. Meteor. Soc.
Schmocker, G. K., D. W. Sharp, and B. C. Hagemeyer, 1990: Three initial climatological studies for WFO Melbourne, Florida: A first step in the preparation for future operations. NOAA Tech. Memo. SR-132. 52 pp.
Hagemeyer, B. C., 2000:Development of a Low Pressure Index as a Proxy for Dry Season Severe Weather in Florida and its Relationship with ENSO. Preprints, 20th Conference on Severe Local Storms, Amer. Meteor. Soc., Orlando, FL, 439-442.
Hagemeyer, B. C., 2001: Communicating experimental Florida dry season forecasts and regionalized climatic information to users via the Internet. Presented to National Weather Association 26th Annual Meeting. Spokane, WA and NOAA 26th Annual Climate Diagnostics and Prediction Workshop. San Diego, CA (10/01).
Hagemeyer, B. C., and R. A. Almeida, 2002: Experimental Forecasting of Dry Season Storminess over Florida and the Southeast United States from the ENSO Signal using Multiple Linear Regression Techniques. Preprints, 16th Conference on Probability and Statistics in the Atmospheric Sciences and 13th Symposium on Global Change and Climate Variations, Amer. Meteor. Soc., Orlando, FL, J3.10.
Hagemeyer, B.C. and R.A. Almeida, 2003: Experimental forecasting of dry season storminess over Florida from the ENSO signal: latest results and advancements, Preprints, 14th Symposium on Global Change and Climate Variations, Amer. Meteor. Soc., Long Beach, CA,
Hagemeyer, B.C. and R.A. Almeida, 2004: Extreme Interseasonal and Intraseasonal Variability of Florida Dry Season Storminess and Rainfall and the Role of the MJO, PNA, and NAO, Preprints, 15th Symposium on Global Change and Climate Variations, Amer. Meteor. Soc., Seattle, WA, CD-ROM P7.1.
Hagemeyer, B.C. and R.A. Almeida, 2005: Towards greater understanding of inter-seasonal and multi-decadal variability and extremes of extratropical storminess in Florida, Preprints, 16th Conference on Climate Variability and Change, Amer. Meteor. Soc., San Diego, CA, CD-ROM P5.19.
Hagemeyer, B.C., 2006: ENSO, PNA and NAO Scenarios for extreme storminess, rainfall and temperature variability during the Florida dry season, Preprints, 18th Conference on Climate Variability and Change, Amer. Meteor. Soc., Atlanta, GA, CD -ROM P2.4.
Hagemeyer, B.C., 2007: The relationship between ENSO, PNA, and AO/NAO and extreme storminess, rainfall, and temperature variability during the Florida dry season: thoughts on predictability and attribution, Preprints, 19th Conference on Climate Variability and Change, Amer. Meteor. Soc., San Antonio, TX, CD-ROM JP2.16.
Florida region seasonal forecast development: Bart Hagemeyer.
last updated 8/10/10

