December 2019 Climate Summaries
2019 Annual Recap
Mobile Alabama and Pensacola Florida Area
National Weather Service Mobile Alabama
January 5, 2020
December 2019 in Review - Outside of a couple brief cold spells where low temperatures dipped to between 8 and 12° below normal during the first and middle portion of the month, it was overall very un-December like with several days surging to well above 70°. Monthly temperatures were some 3 to 5 degrees above seasonal averages. Two record temperatures were set in Pensacola. Mobile and Pensacola both saw a surplus in rain with Pensacola seeing the most above the monthly normal by well over two inches.
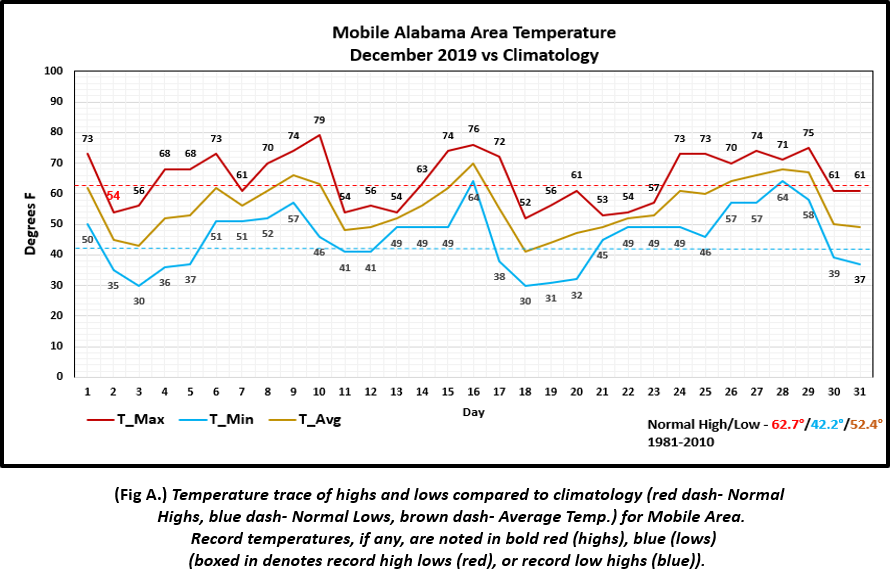
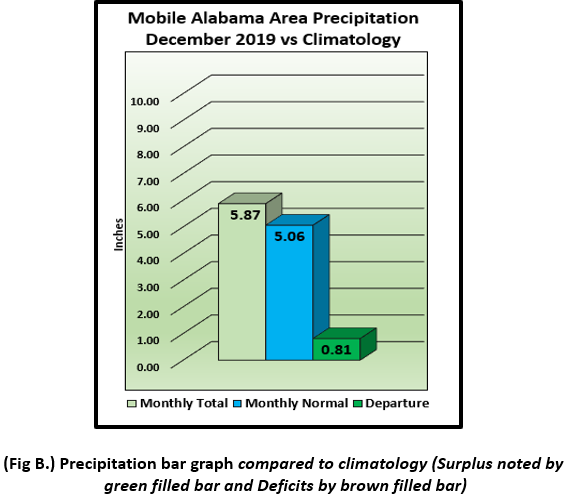
Mobile Alabama Area- The average monthly high was 65.0° or 2.3° above normal. The average monthly low was 45.8° or 3.6° above normal. The average monthly temperature was 55.4° or 3.0° above normal. No record temperatures were observed for the Mobile area during the month. (Fig. A) shows how temperatures compared to the seasonal normal monthly highs and lows, which are shown by the colored dashed lines. December rainfall measured 5.87" or 0.81" above normal (Fig. B).
Click on the Mobile Alabama area climate graphics below to expand:
|
|
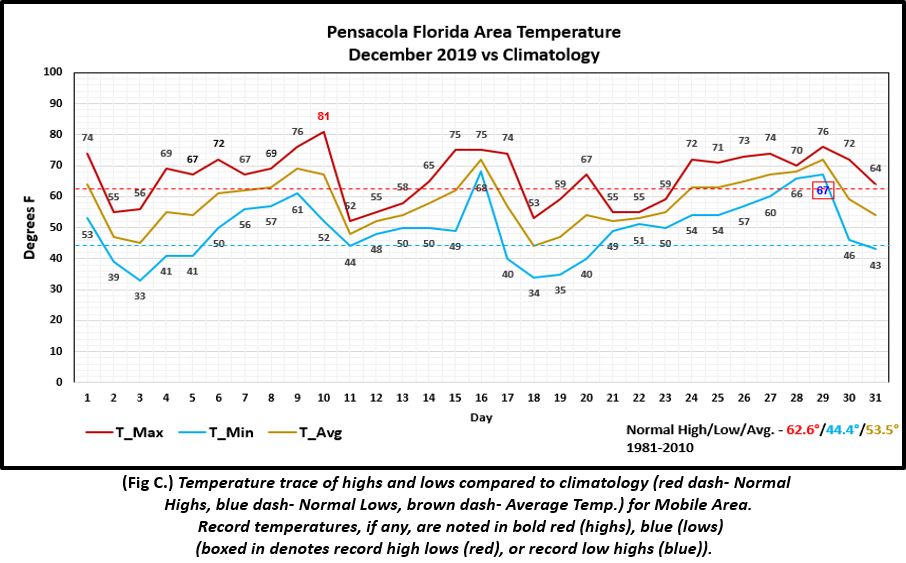
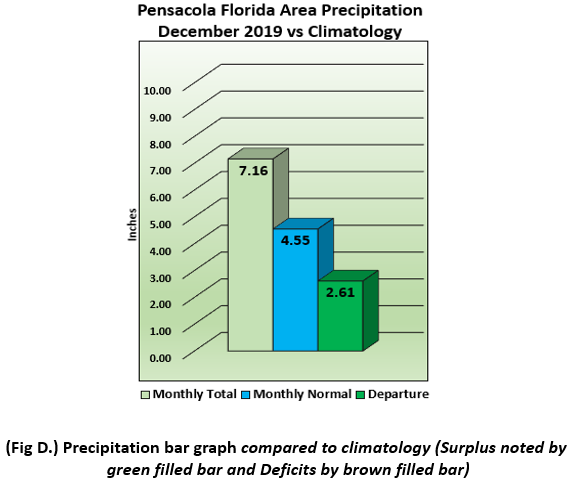
Pensacola Florida Area- The average monthly high was 66.5° or 3.9° above normal. The average monthly low was 49.6° or 5.2° above normal. The average monthly temperature was 58.0° or 4.5° above normal. Two record temperatures were set during the month. The most notable is the record high of 81° on the 10th which surged past the previous record of 78° set on this date back in 2012. The high of 81° ties the highest temperature for the month of December with four other dates where it occurred on the 3rd back in 1978, the 6th back in 2014, the 18th back in 2016, and the 29th back in 1974. Secondly, a record high low temperature of 67° on the 29th broke the previous record of 65° set on this date back in 1996. (Fig. C) shows how temperatures compared to the seasonal normal monthly highs and lows, which are shown by the colored dashed lines. The Pensacola area saw a greater surplus in rainfall above the seasonal normal. 7.16" added up in the rain gauge equaling 2.61" above normal (Fig. D).
Click on the Pensacola Florida area climate graphics below to expand:
|
|
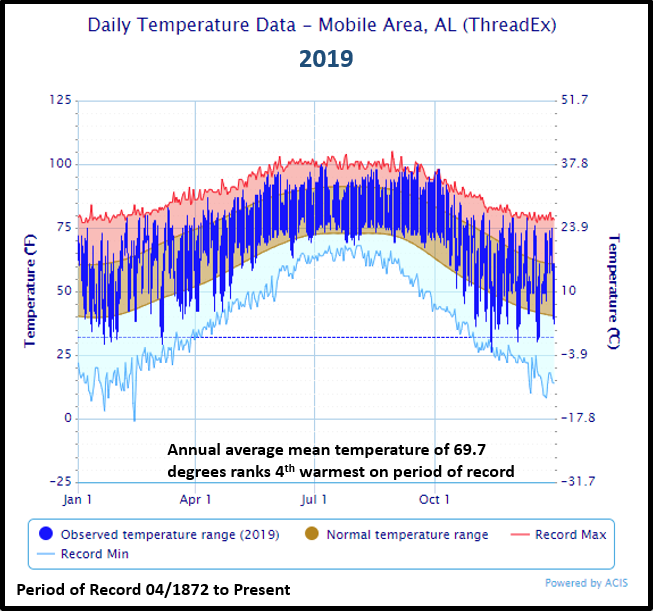
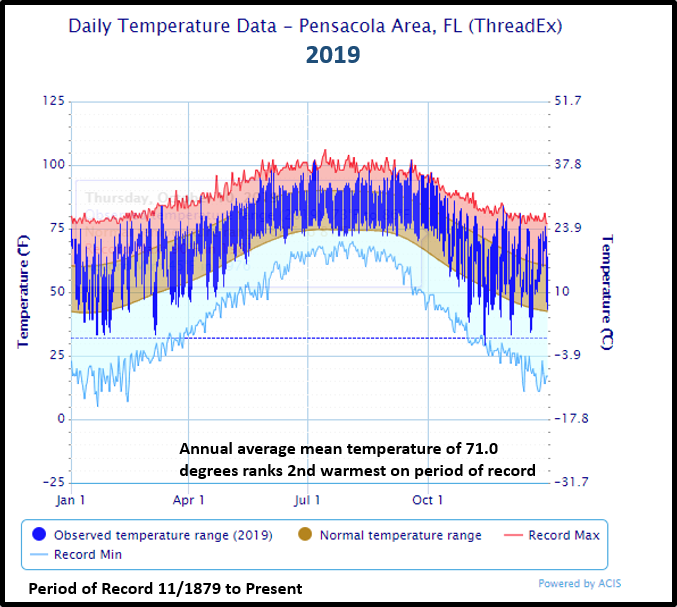
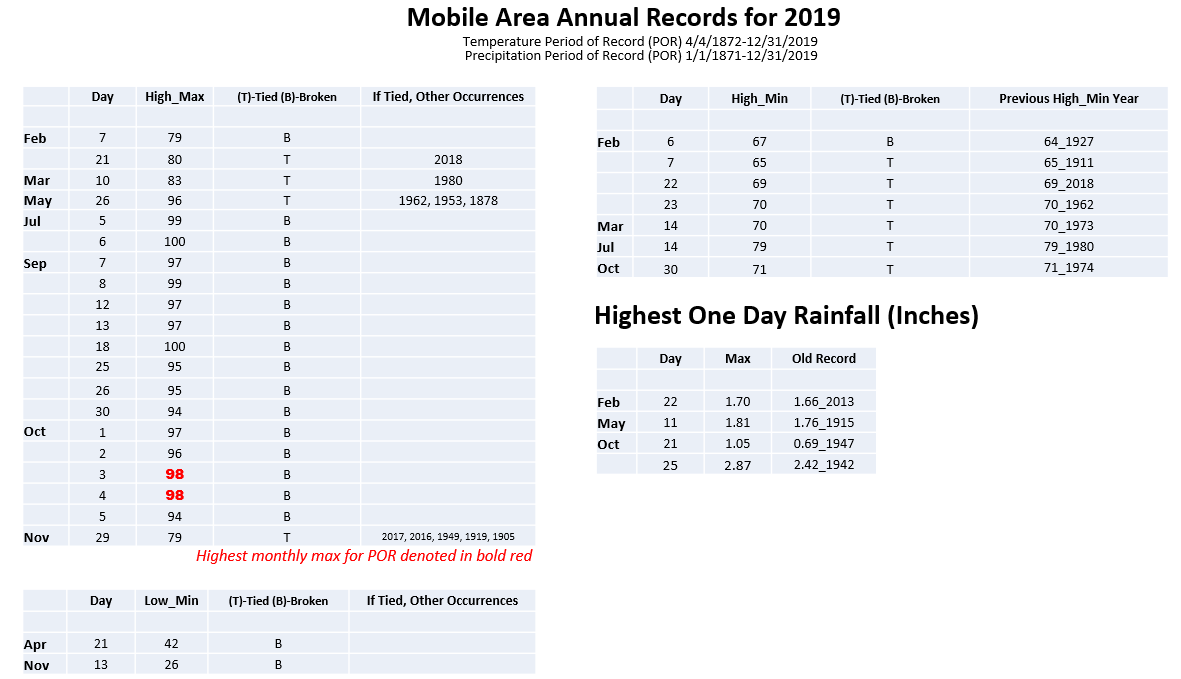
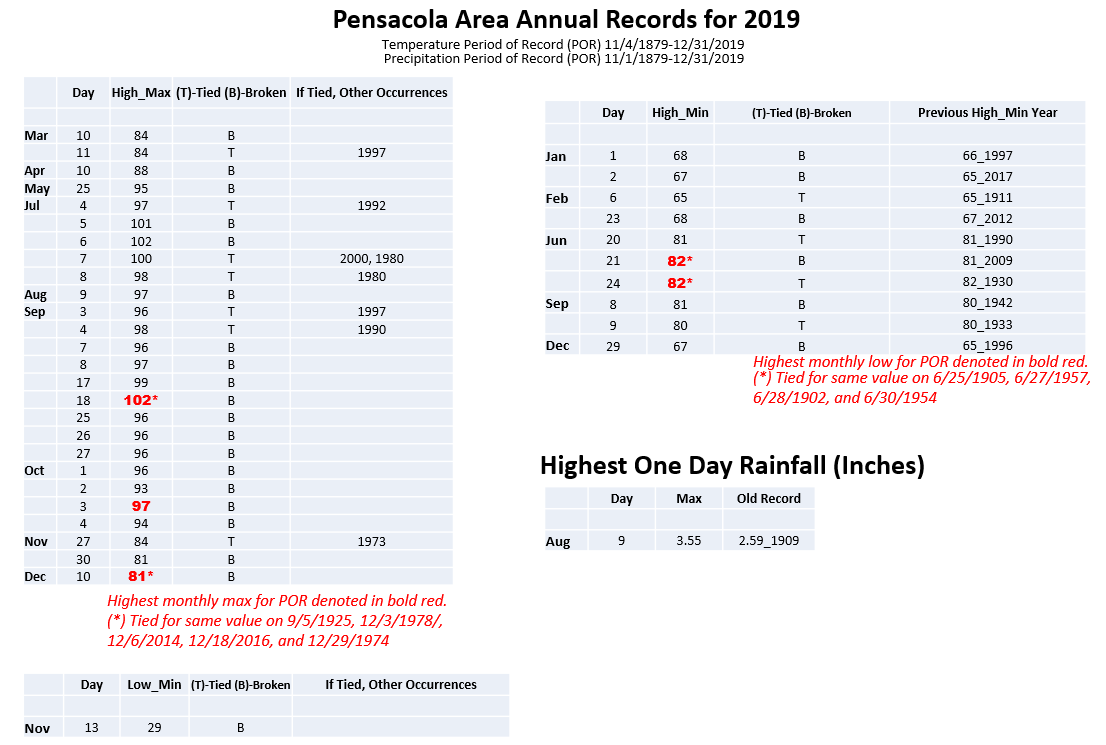
2019 (A Recap) - 2019 continued where 2018 left off with even more number of days of record heat. Mobile saw 20 days of record highs and Pensacola observed a little over three times the amount as observed in 2018 with the occurrence of record highs adding up to 26 days there. The average annual temperature of 69.7° for Mobile broke into the top five warmest on the period of record dating back to 1872 at number four. The average annual temperature of 71.0° for Pensacola rose two spots higher in its period of record dating back to 1879 at second warmest. The second most notable set of records were high low temperatures with Mobile seeing seven occurrences of those and Pensacola, ten which bested 2018's numbers. Of these records, 82° on June 21st and 24th at Pensacola tied for the highest low temperature for the month with other occurrences in previous years occurring on the 25th, 27th, 28th and 30th. The Mobile area saw two mornings of record low temperatures and Pensacola, one.
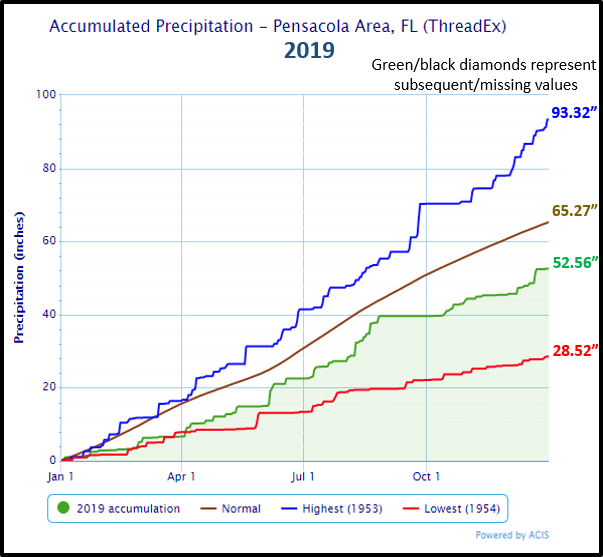
As far as rainfall, Mobile saw four days of record one day rainfall and Pensacola only one. The Mobile area was shy of reaching normal rainfall by near 1.5" while the Pensacola area saw annual rainfall just over a foot below normal. The break-out of the annual temperature/precipitation graphs and local records for the Mobile and Pensacola area is provided below.
2019 Temperature/ Precipitation Traces and Tabular Record Breakout:
|

|
|
|
|
|
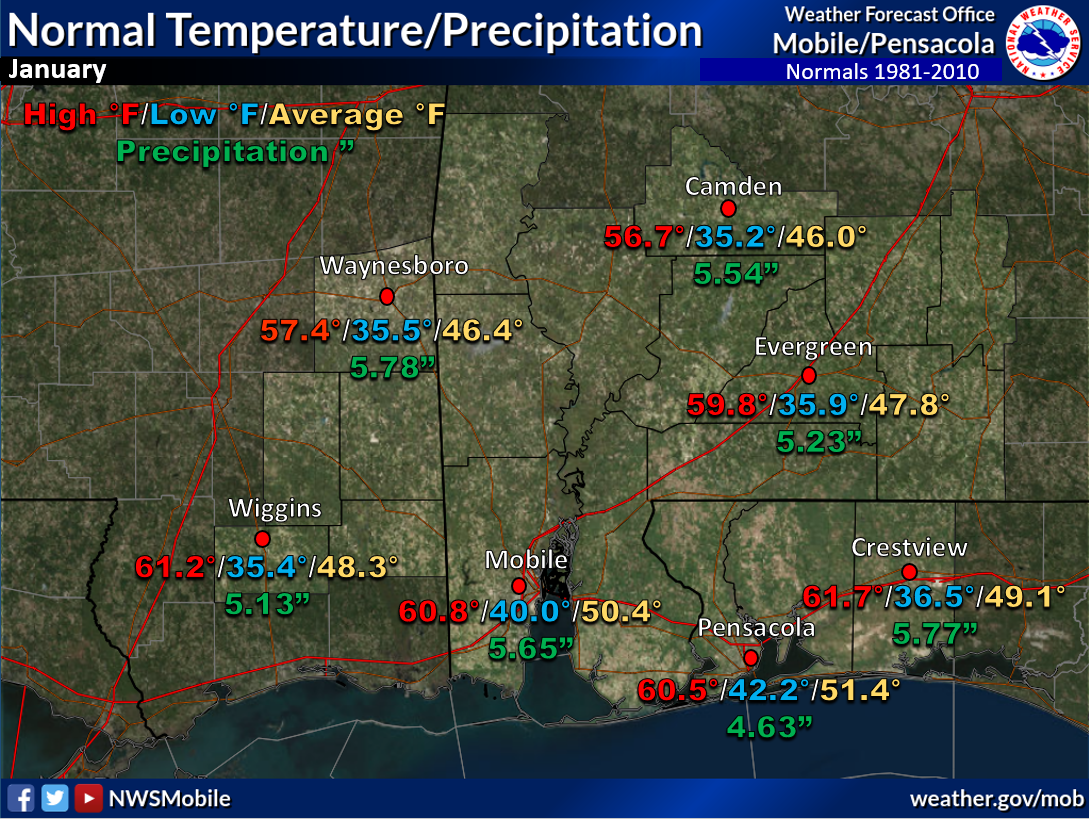
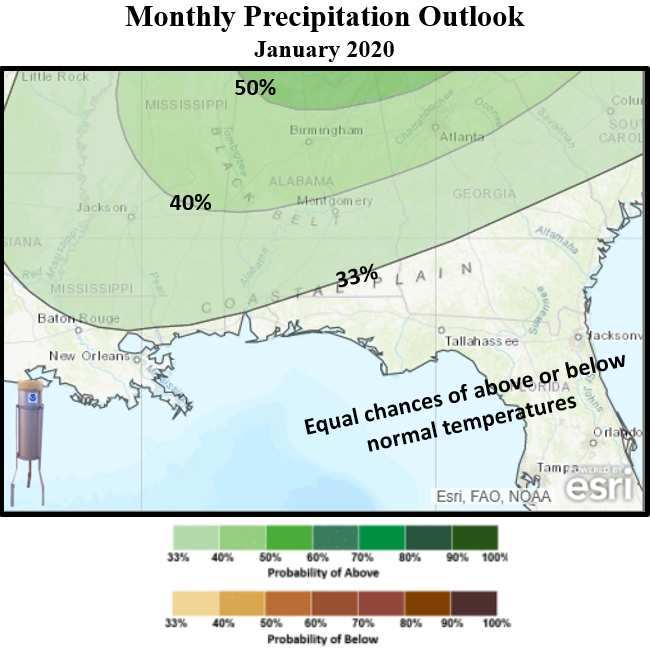
January Climatology and Outlooks:
Click on the snap shots below to expand:
|

Outlook |
Outlook |
|
Climate Prediction Center's Interactive Long Range Outlooks
Additional Climate Links:
The links below are intended to provide additional climate information, education and outlooks. The National Weather Service Mobile Alabama's Climate and Past Weather page provides climate data at your fingertips for many observation points in the local forecast area by accessing the NOWData tab as well as many other climate resources. The Climate Prediction Center Link provides short and longer range climatic outlooks and education about the larger scale global circulations that impact temperatures and weather. With the large agriculture and farming presence along the central Gulf coast, the Drought Monitor link provides updates on drought trends and impacts. Another very helpful resource is the Community Collaborative Rain Hail and Snow (CoCoRaHS) network, which is a large group of volunteers working together to measure and map precipitation (rain, hail and snow). The aim of CoCoRaHS is to provide the highest quality data for natural resource, education and research applications. You can be a part of the CoCoRaHS team by becoming a volunteer rainfall observer. To learn more click on the CoCoRaHS link below.
National Weather Service Mobile AL Climate and Past Weather
Climate Prediction Center (CPC)
CoCoRaHS Network Water Year Summaries


