November 2020 Climate Summaries
Mobile Alabama and Pensacola Florida Area
National Weather Service Mobile Alabama
December 11, 2020
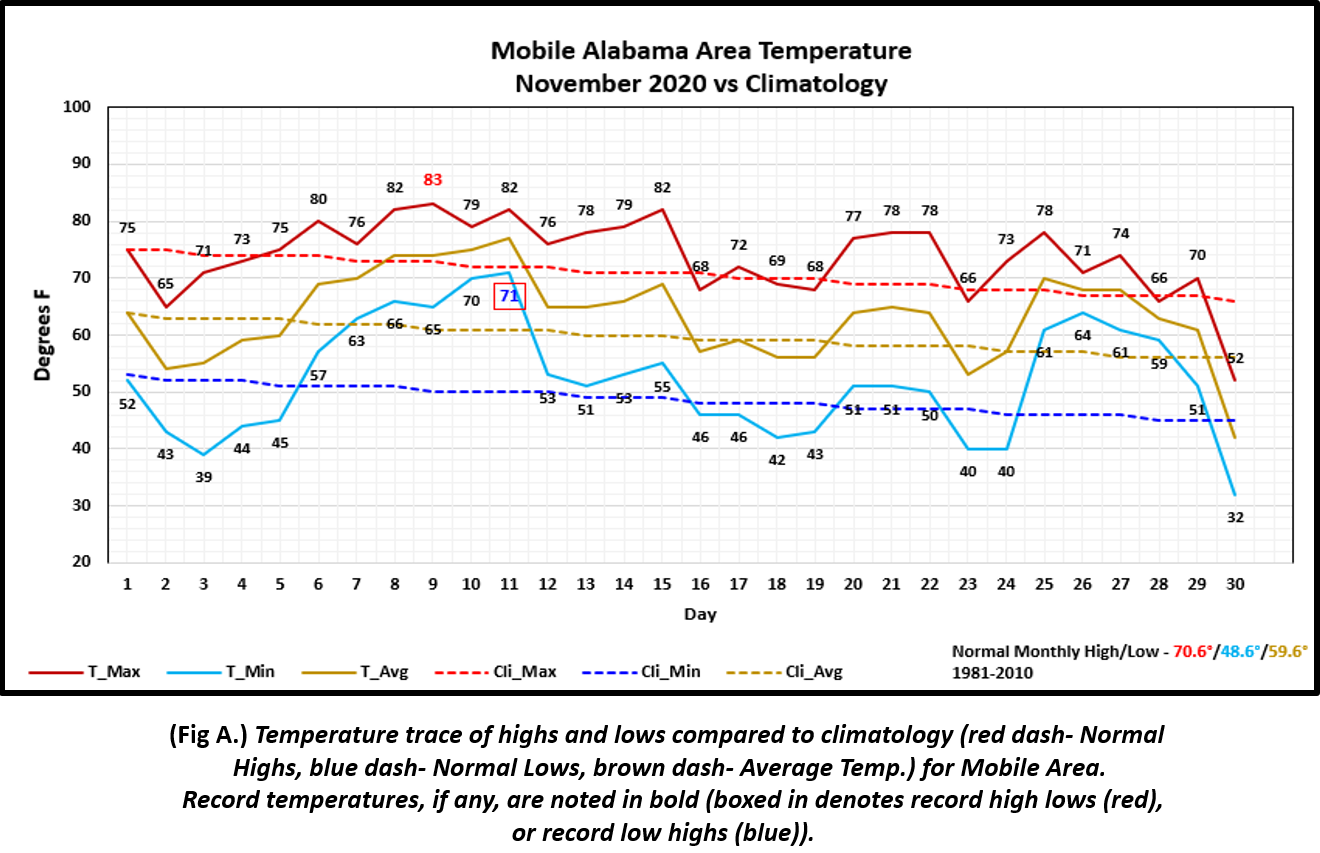
November 2020 in Review - Outside of a brief notable dip in low temperatures to below normal the first week of the month and for the final day of the month, November was warm with average temperatures well above the climatological means by 3 to 7 degrees. The warmest monthly temperatures were at Pensacola where highs and lows averaged nearly 6 degrees above normal. In fact, six record highs were recorded at Pensacola in an eight day span from November 8th to the 15th. Highs and lows were only a few degrees above normal at Mobile with two record temperatures reached, one a record high and the other a record high low temperature entering the middle of the month. Precipitation was lacking by a few inches off the monthly normal for both the Mobile and Pensacola areas. Mobile continues to see a large annual deficit in rainfall by several inches which has led to an abnormally dry pattern over portions of the central Gulf Coastal Plain.
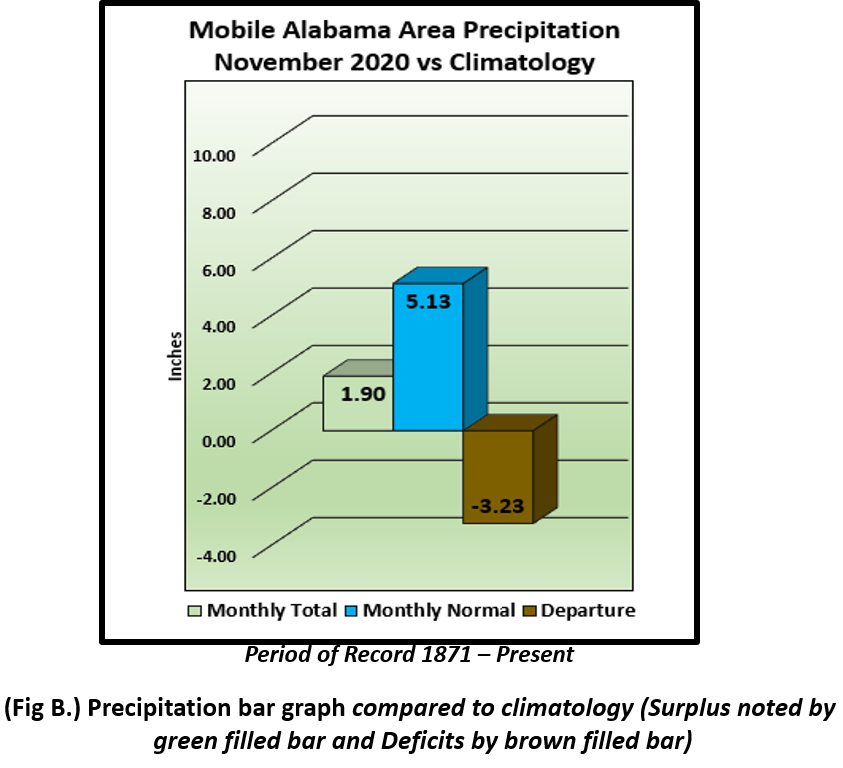
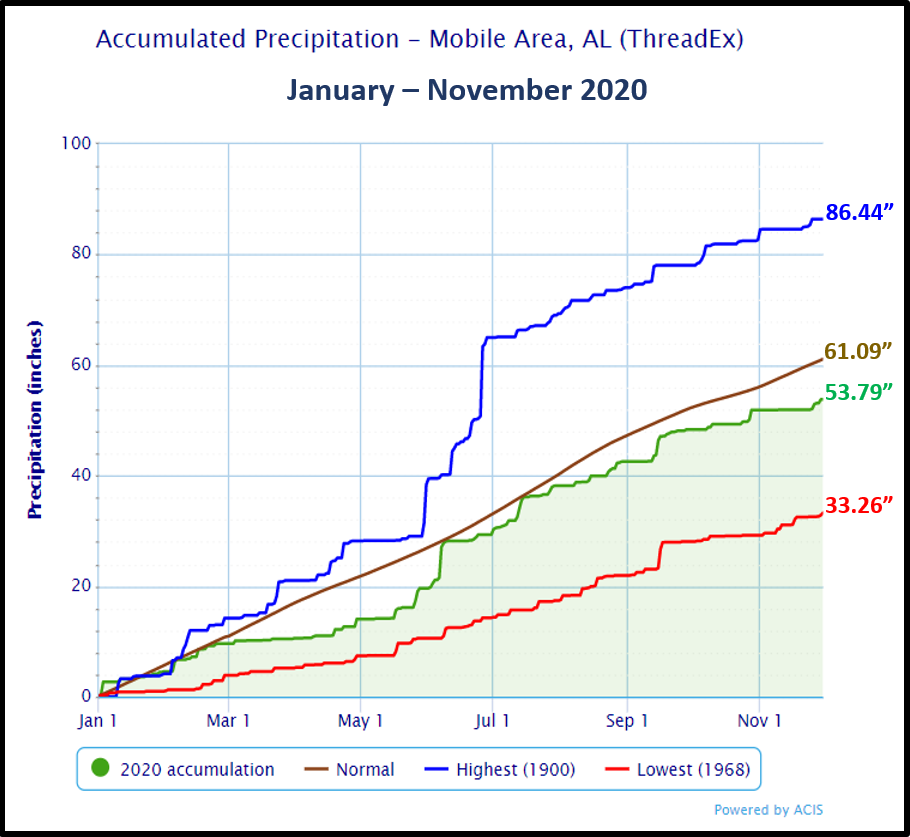
Mobile Alabama Area [Climate Normal Period 1981-2010, Climate Record Period 1872 to Present]- The average monthly high of 73.9° was 3.3° above normal. The average monthly low was 52.1° or 3.5° above normal. The average monthly temperature of 63.0° was 3.4° above normal. The highest temperature for the month, 83°, occurred on the 9th which tied the previous record high for this date set in 1986. Similar to that of October, the lowest temperature for the month occurred on the morning of the 30th, 32°. A record high low temperature of 71° on the 11th tied the previous occurrence on this date set in 1911. (Fig. A) shows a graphical representation of how the Mobile area temperatures compared to the seasonal normal monthly highs and lows, which are shown by the colored dashed lines. Total rainfall for November (Fig. B) measured 1.90", 3.23" below normal. A precipitation trace for the Mobile area since January 1st is provided in the graphics below showing how it compares to normal year to date totals. The Mobile area has observed 53.79" of rain which remains at a substantial annual deficit which has increased 7.30".
November top records for the month during the Period of Record for the Mobile Area:
Click on the Mobile Alabama area climate graphics below to expand:
|
|
|
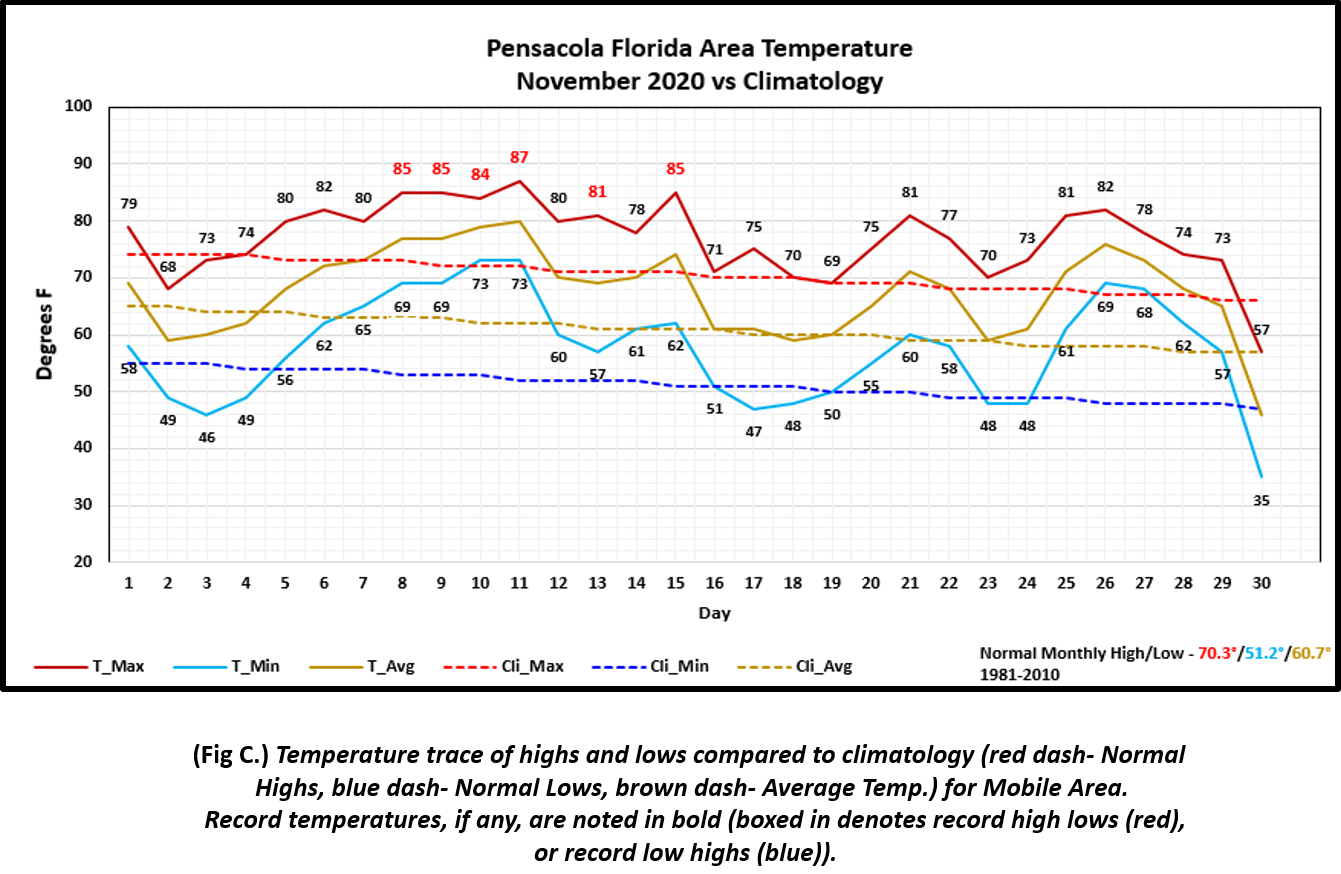
Pensacola Florida Area [Climate Normal Period 1981-2010, Climate Record Period 1879 to Present] - The average monthly high of 76.9° was 6.6° above normal. The average monthly low of 57.5° was 6.3° above normal. The average monthly temperature of 67.2° was 6.5° above normal. The highest temperature for the month was 87°, occurring on the 11th, also smashed the previous record of 82° set on this date in 2006. Five other record highs were tied or broken during the month and are provided in the table:
| Record High / Date of Occurrence | Record Tied (T) or Broken (B) / Previous Year of Occurrence |
| 85 / 8th | B / 82-2017 |
| 85 / 9th | B / 83-1986 |
| 84 / 10th | B / 82-2002 |
| 87 / 11th | B / 82-2006 |
| 81 / 13th | T / 1985 |
| 85 / 15th | B / 84-1951 |
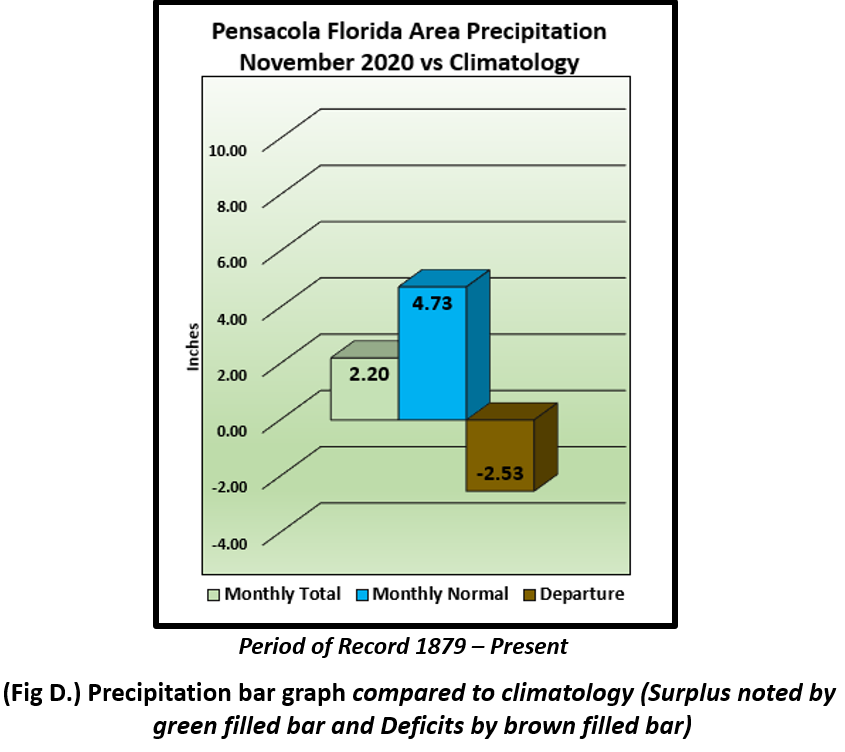
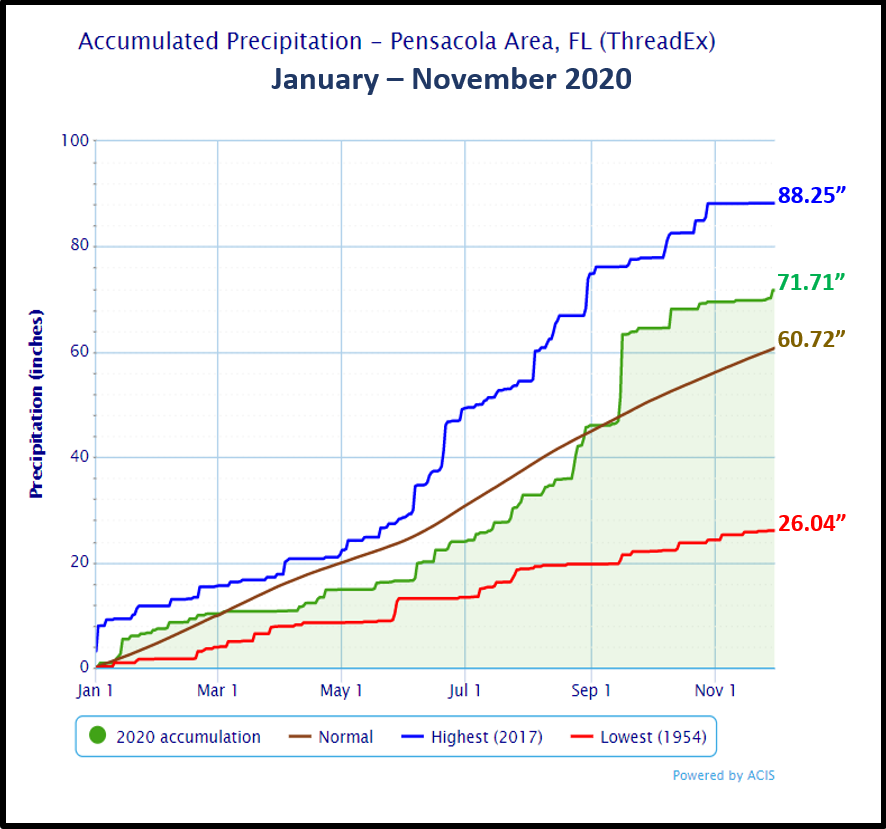
The lowest temperature for the month, 35°, occurred on the 30th. (Fig. C) shows a graphical representation of how the Pensacola area temperatures compared to the seasonal normal monthly highs and lows, which are shown by the colored dashed lines. The rain gauge measured 2.20" which was a little over 2.5 inches below normal. An annual precipitation graph for the Pensacola area is provided in the graphics below showing how it compares to normal year to date totals. Pensacola has measured over 71 inches in annual rainfall.
November top records for the month during the Period of Record for the Pensacola Area:
Click on the Pensacola Florida area climate graphics below to expand:
|
|
|
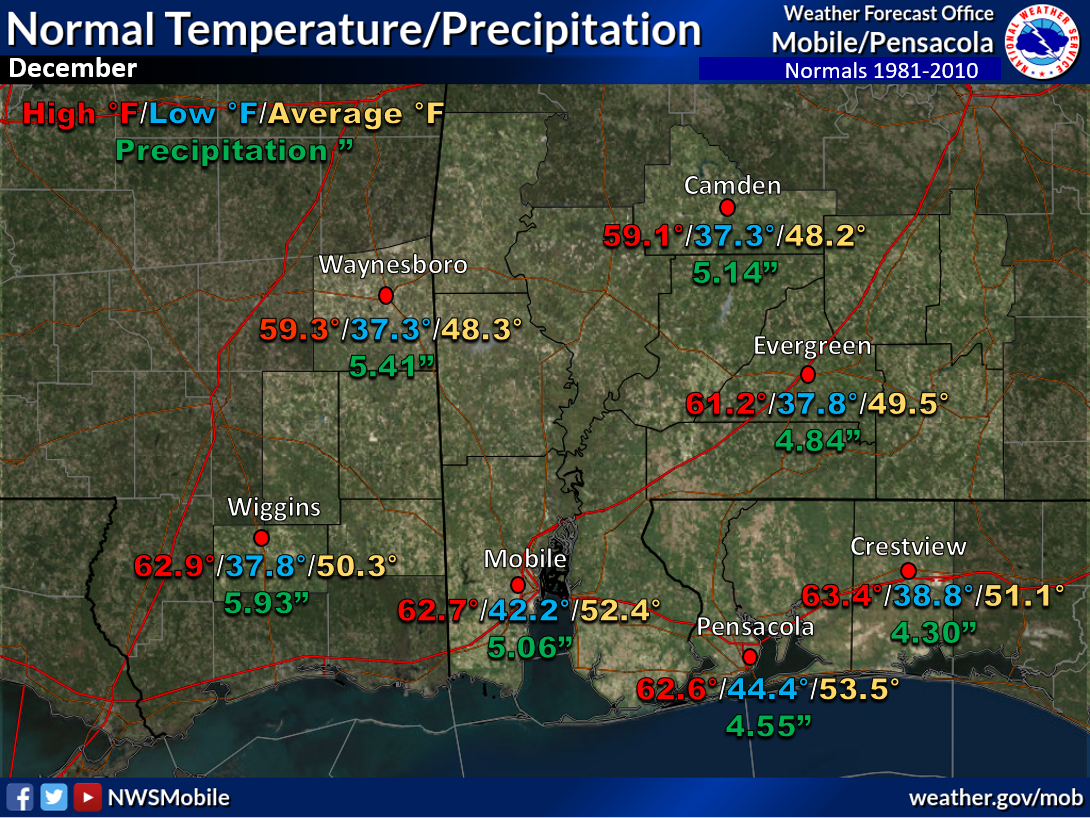
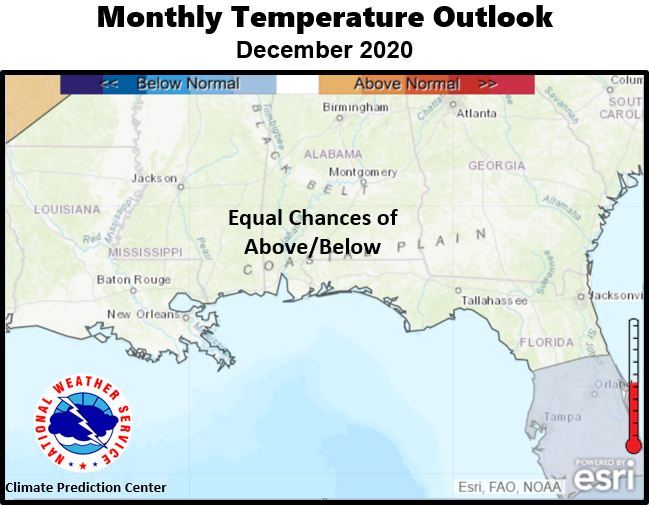
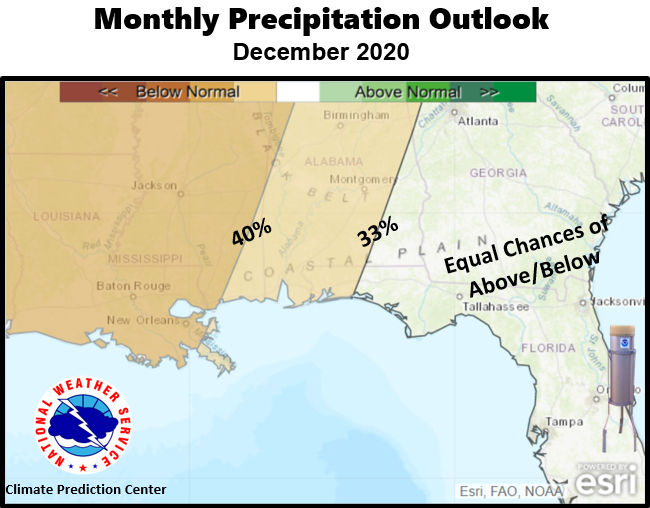
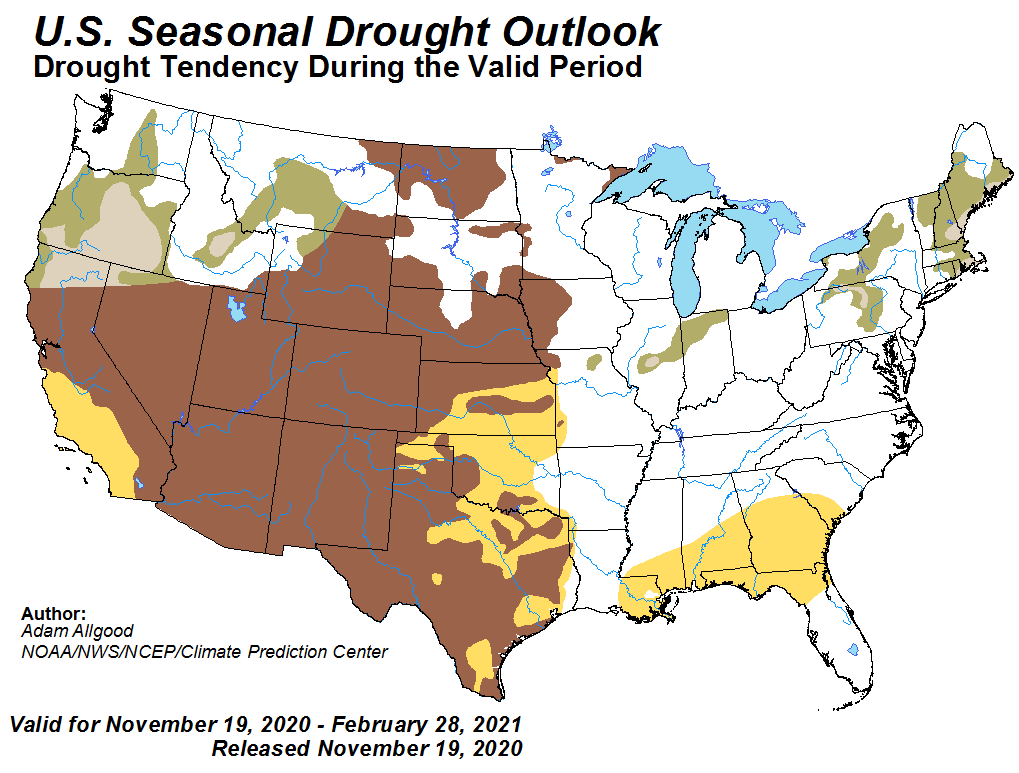
December Climatology and Outlooks:
The long range weather pattern favors equal chances of above or below normal temperatures and below normal precipitation over the deep south during the month of December. Due to abnormally dry conditions over portions of the central Gulf coast and latest precipitation outlooks, there is a likelihood of developing drought over the southeast as we move into the beginning of 2021. As we close the official tropical weather season, a recap of the historical Atlantic Basin Tropical season is provided below.
Click on the snap shots below to expand:
|
Outlook |
Outlook |
|
|

|
Climate Prediction Center's Interactive Long Range Outlooks
Additional Climate Links:
The links below are intended to provide additional climate information, education and outlooks. The National Weather Service Mobile Alabama's Climate and Past Weather page provides climate data at your fingertips for many observation points in the local forecast area by accessing the NOWData tab as well as many other climate resources. The Climate Prediction Center Link provides short and longer range climatic outlooks and education about the larger scale global circulations that impact temperatures and weather. With the large agriculture and farming presence along the central Gulf coast, the Drought Monitor link provides updates on drought trends and impacts. Another very helpful resource is the Community Collaborative Rain Hail and Snow (CoCoRaHS) network, which is a large group of volunteers working together to measure and map precipitation (rain, hail and snow). The aim of CoCoRaHS is to provide the highest quality data for natural resource, education and research applications. You can be a part of the CoCoRaHS team by becoming a volunteer rainfall observer. To learn more click on the CoCoRaHS link below.
National Weather Service Mobile AL Climate and Past Weather
Climate Prediction Center (CPC)
CoCoRaHS Network Water Year Summaries