July 2026 Climate Summaries
Mobile Alabama and Pensacola Florida Area
National Weather Service Mobile Alabama
August 3, 2026
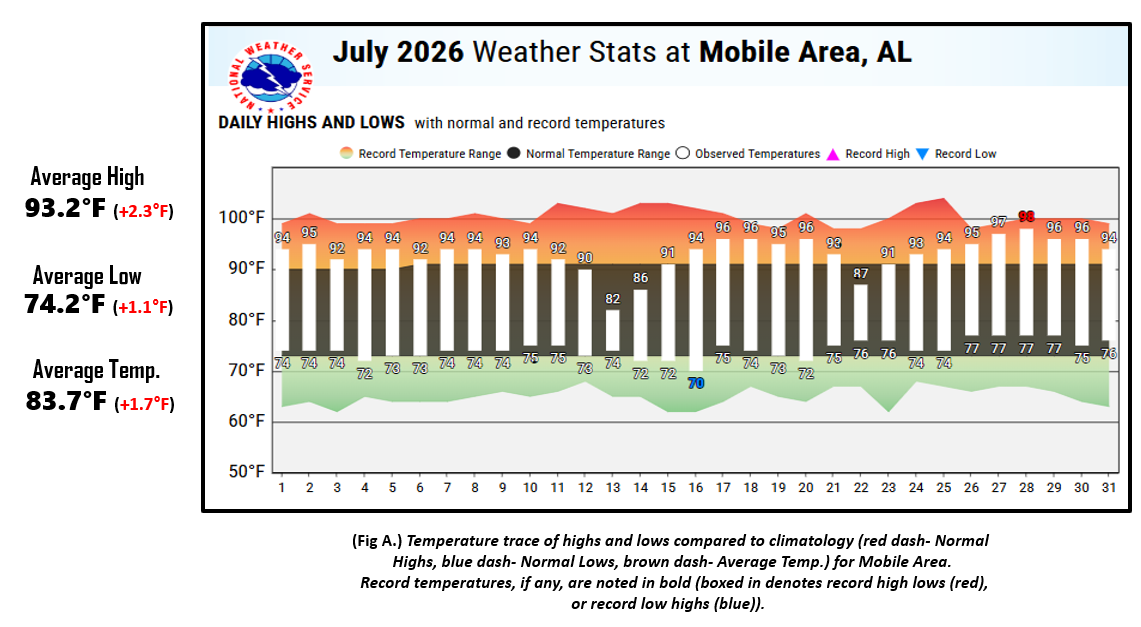
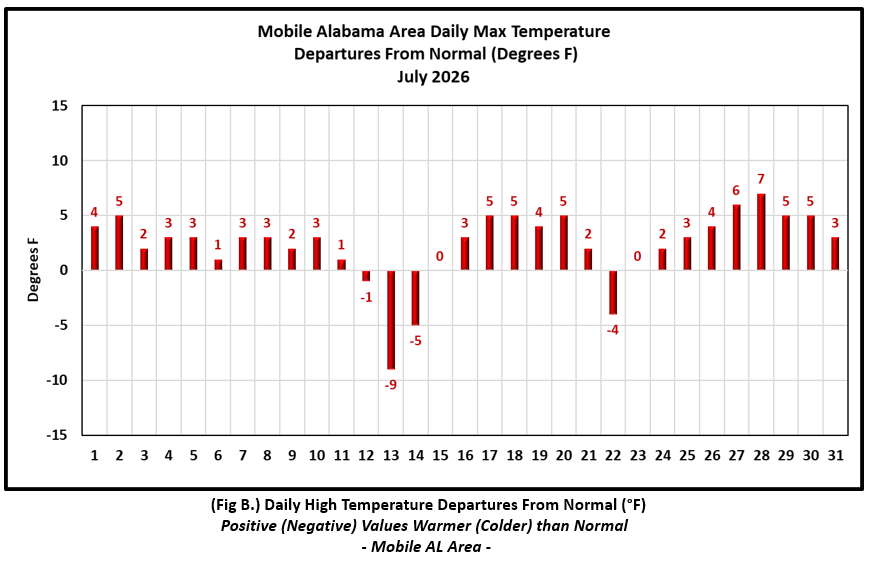
July 2026 in Review - Temperatures were not too far off from seasonal July normal values at less than two degrees above normal in all three metrics, that being the average highs, lows and means. There were only three days of noticeably lower high temperatures than July normal at Mobile, that being the 13th, 14th and the 22nd when highs in the lower to mid 80's averaged 6.0° below normal on these dates. Otherwise, daily highs were above normal. Overnight lows were nearly steady state in the mid 70's and close to normal much of the month. No record temperatures were reached at Mobile. At Pensacola, despite more variability in daily high temperatures about the means, the average high was nearly a half degree from normal for the month. Overnight lows were mostly in the mid to upper 70's and averaging close to normal for the month of July. There were, though, four consecutively record warm nights where the thermometer did not dip below 80.0°, matching or setting new record high temperatures for the mornings of the 26th to the 29th. The overnight low averaged 6.5° above normal on these days.
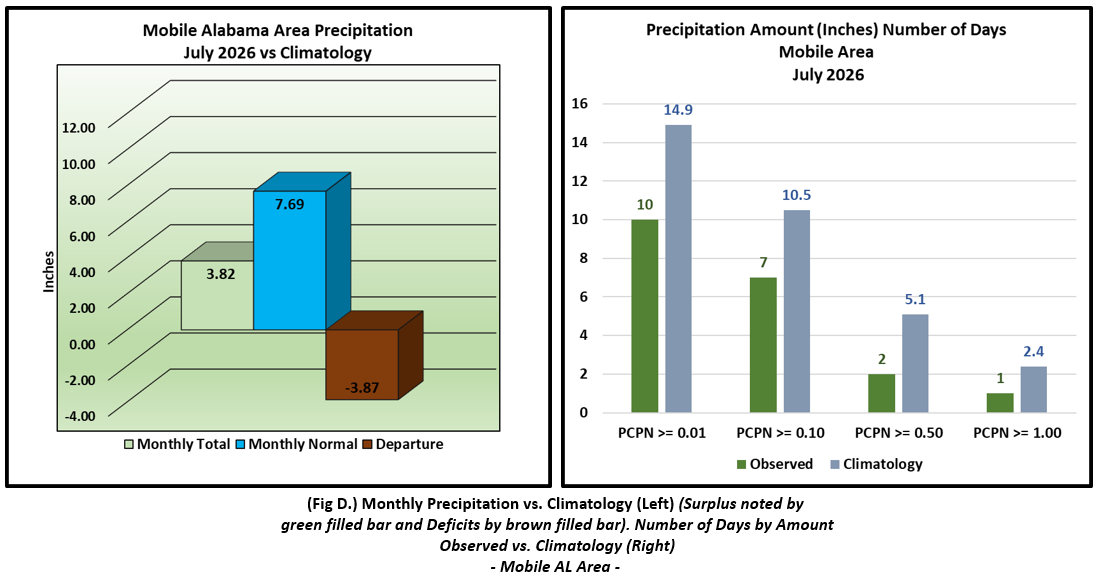
Tropical Storm Bertha formed on the evening of Monday July 20th 190 miles SE of Mobile. Bertha tracked on a general westward heading roughly between 65 and 75 miles south of the AL/NW Florida Gulf coast from Tuesday AM July 21st to Wednesday AM July 22nd. During its life span, Bertha struggled with moderate to strong north to northeasterly deep layer winds which resulted in most of the showers and storms and better organized bands primarily off to the south and southeast of the center of the circulation. This evolution limited the heavy rain impact across the northern Gulf coast. If it wasn't for this, the monthly rainfall story for Mobile for July would've likely been quite different, but ended in a deficit. Pensacola did see a small monthly surplus.
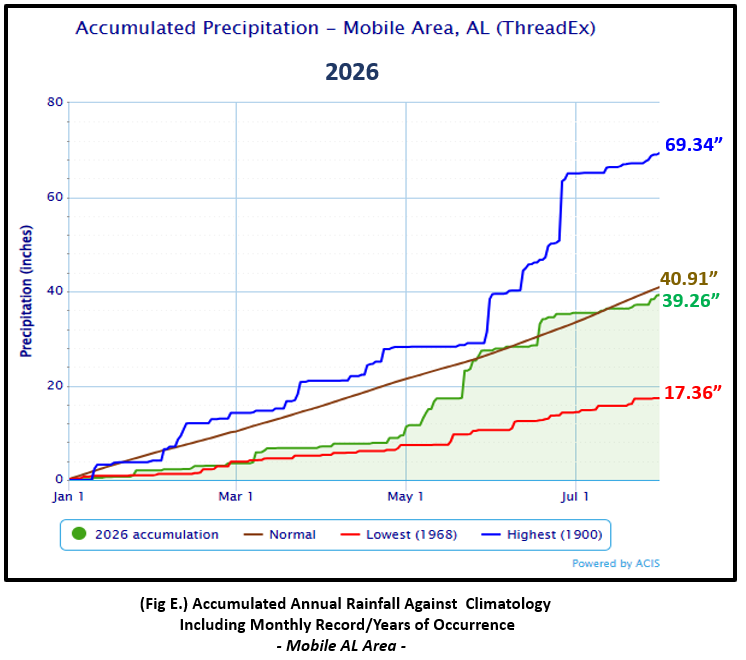
Mobile Alabama Area [Climate Normal Period 1991-2020, Climate Record Period 1872 to Present]- The average monthly high of 93.2° was 2.3° above normal. The average monthly low was 74.2° or 1.1° above normal. The average monthly temperature of 83.7° was 1.7° above normal. The highest temperature for the month, 98° on the 28th was 7° above the normal for this date. There were 28 days where the daily high reached or surpassed 90°, six days above the normal occurrence. The lowest temperature for the month, 70°, occurred the morning of the 16th and was just 3° below normal for this date. No record temperatures were set at Mobile. (Fig. A) shows a bar graphical representation of how the Mobile area daily temperatures compared to the seasonal normal daily highs and lows. The extremes are also shown. (Figs. B and C) shows the daily high/low temperature departures from normal in the table below. Despite the passage of Tropical Storm Bertha, the rain gauge was short of normal monthly rainfall by a few inches. 3.82" was collected (Fig. D), 3.87" below normal. A bar graph showing the number of days of occurrence of select precipitation amounts compared to climatological normal is also provided in (Fig. D). Annual rainfall, 39.26" (Fig. E) to date, is in deficit by well over an inch against the means at 1.65" below normal.
July top records for the month during the Period of Record for the Mobile Area:
Click on the Mobile Alabama area climate graphics below to expand:
|
|

|
|
|
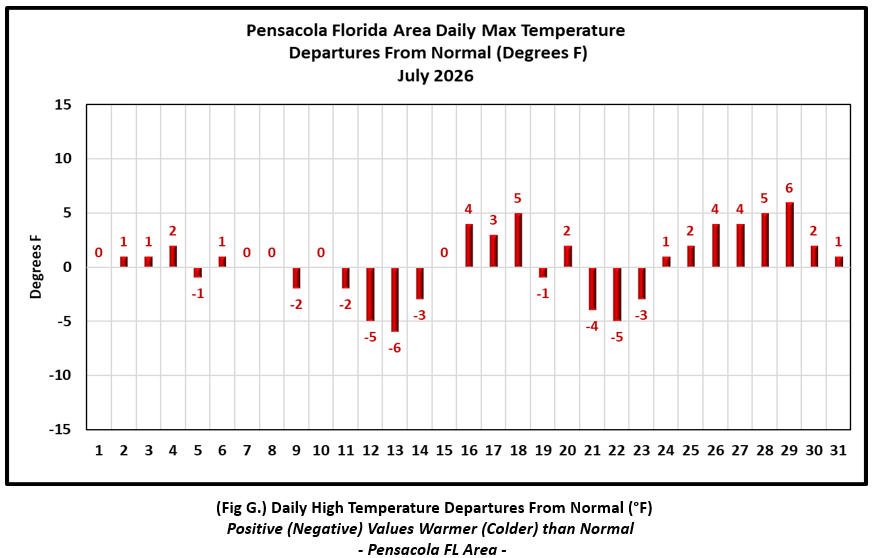
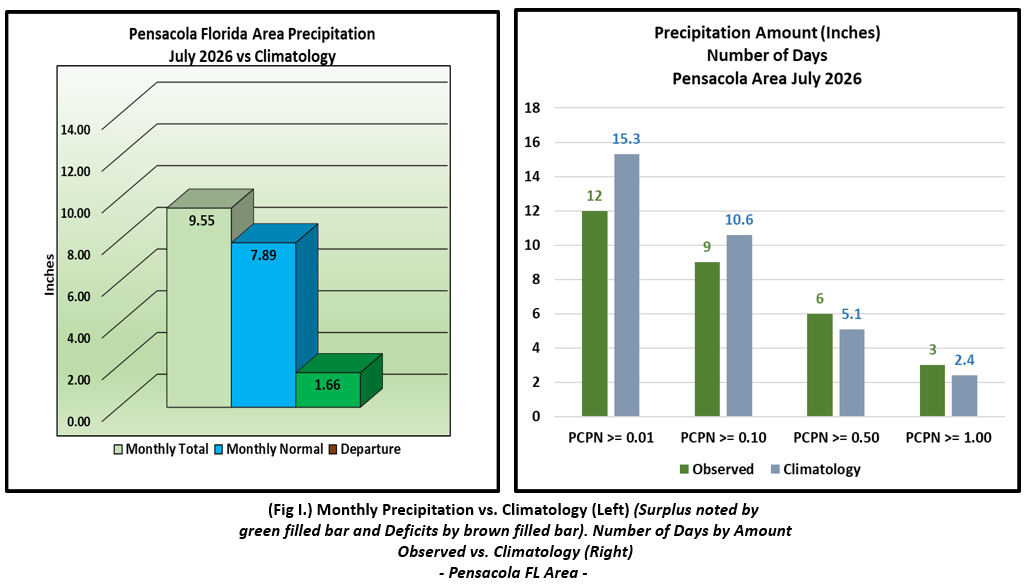
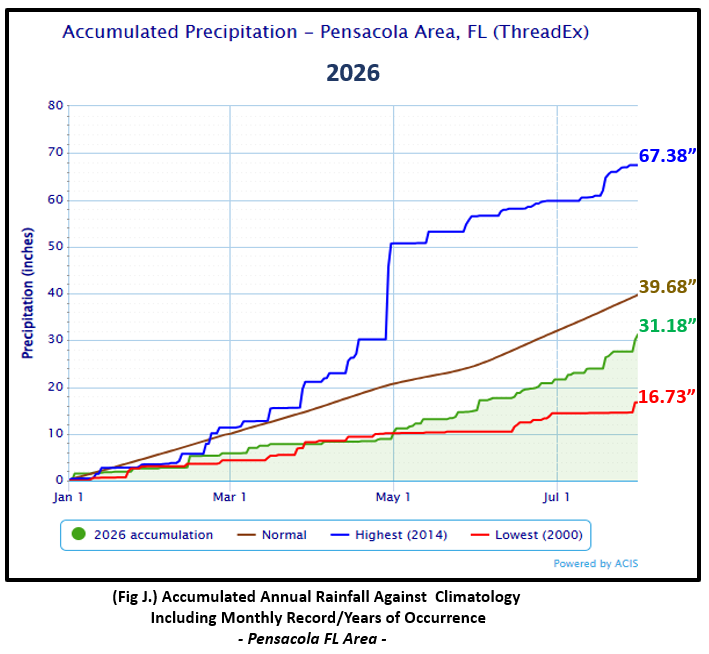
Pensacola Florida Area [Climate Normal Period 1991-2020, Climate Record Period 1879 to Present] - The average monthly high of 92.2° was 0.6° above normal. The average monthly low was 76.7° or 1.7° above normal and places in the top ten warmest average July low temperatures on record at number nine. There were four record high low daily temperatures reached. 81° on the morning of the 26th broke the previous record on this date of 80° occurring in 2012, 1969, 1943, 1925, and 1912. The second was 82° on the morning of the 27th which tied the previous daily high low on this date with the other in 1936. The third was also 82° on the morning of the 28th which tied the previous daily high low on this date with the other set way back in 1901 and the fourth was 81° on the morning of the 29th which tied the previous daily high low on this date with the other in 2017. The average monthly temperature of 84.5° was 1.0° above normal and shares the 7th spot as warmest July average temperature with 2015 being the other year. The highest temperature for the month, 98°, on the 29th was 6° above the normal daily high temperature for this date. There were 25 days where the daily high reached or surpassed 90°, five days above the normal occurrence. The lowest temperature for the month, 70°, on the 12th was 5° below the normal daily low temperature on average for the date. (Fig. F) shows a bar graphical representation of how the Pensacola area daily temperatures compared to the seasonal normal daily highs and lows. The extremes are also shown. (Figs. G and H) shows the daily high/low temperature departures from normal. The rain gauge collected nearly ten inches for the month at 9.55" (Fig. I), 1.66", above normal for July rainfall. A bar graph showing the number of days of occurrence of select precipitation amounts compared to climatological normal is also shown in (Fig. I). Annual rainfall, 31.18", is in deficit by 8.50" below normal to date. (Fig. J).
July top records for the month during the Period of Record for the Pensacola Area:
Click on the Pensacola Florida area climate graphics below to expand:

|
|

|
|
|
Additional July 2026 Climatology and Topics
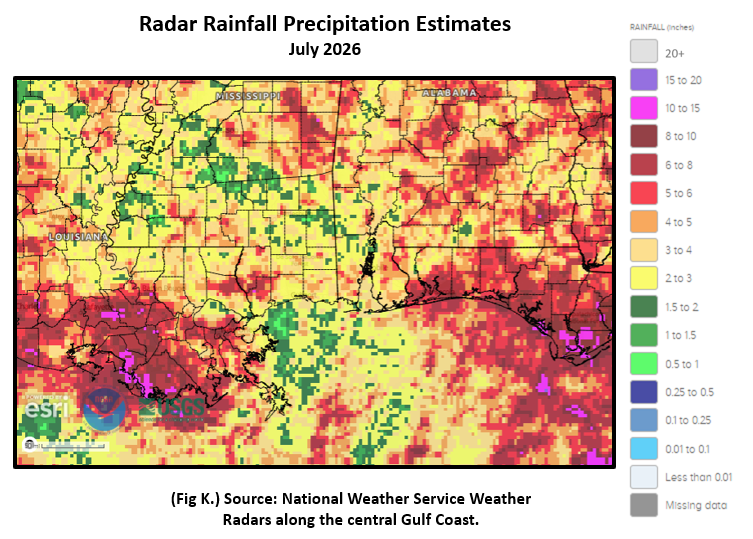
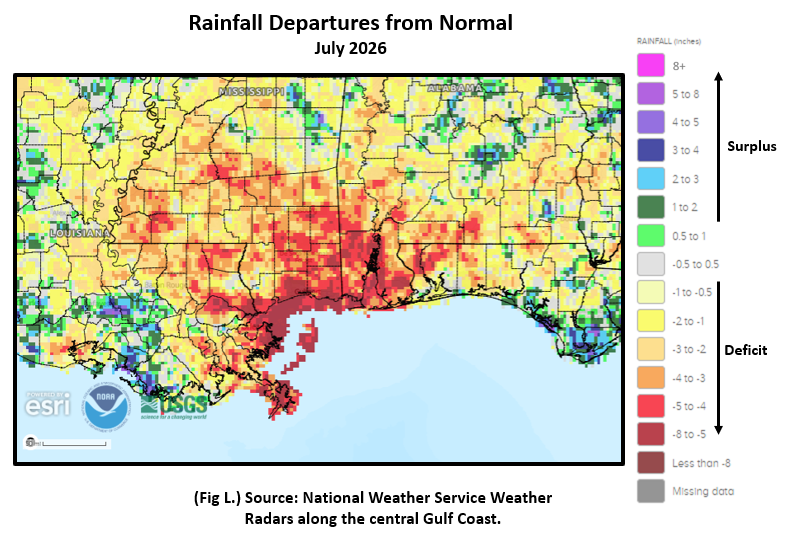
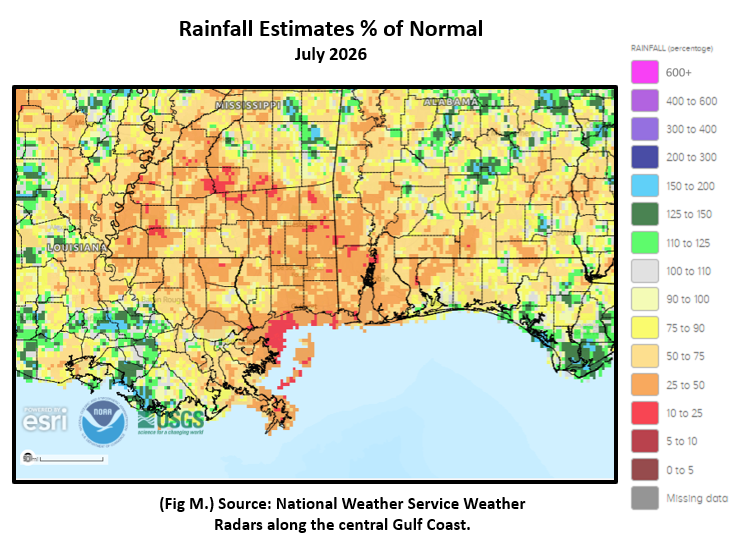
After coming out of a very wet two month period from May and June, July was much drier with much of the local area seeing monthly rainfall deficits greater than 2". In fact, the hot spots for much more significant deficits resided over the southwest half of the local area, focused more over interior Southeast Mississippi and Southwest Alabama and portions of the western sections of the Northwest Florida Panhandle where some 4 to 8" below monthly normal and 25 to 50% of normal rainfall came to pass. (Fig. K) shows the areal distribution of monthly rainfall, (Fig. L) shows the areal rainfall departures from normal and (Fig. M), the areal percent of normal rainfall.
|
|
|
August 2026 Climatology, Seasonal Climatology and Outlooks:
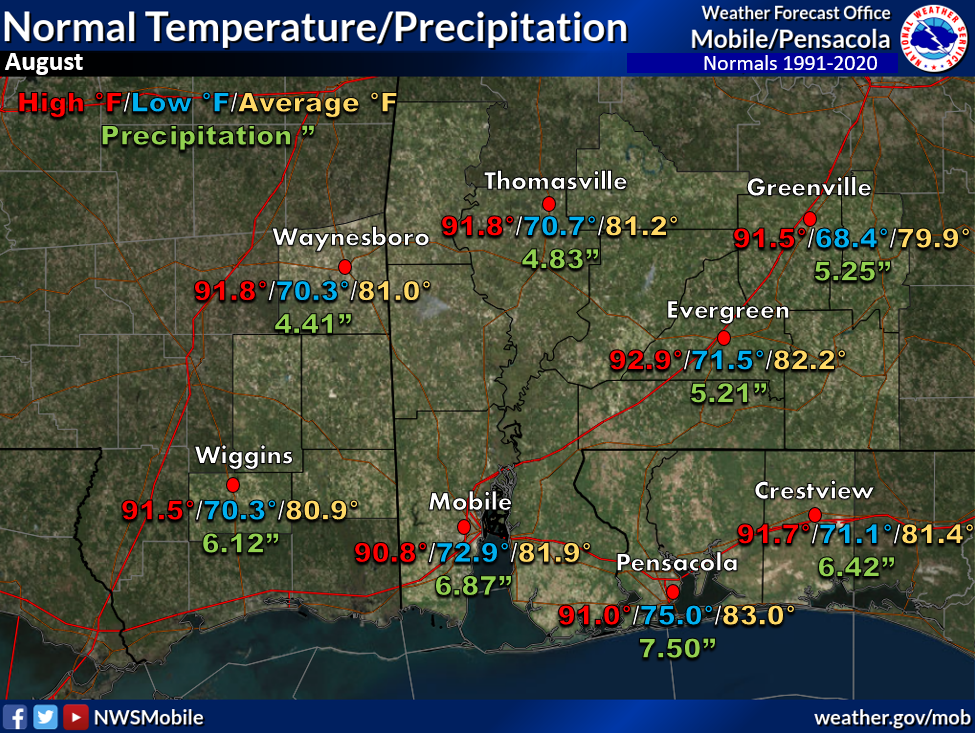
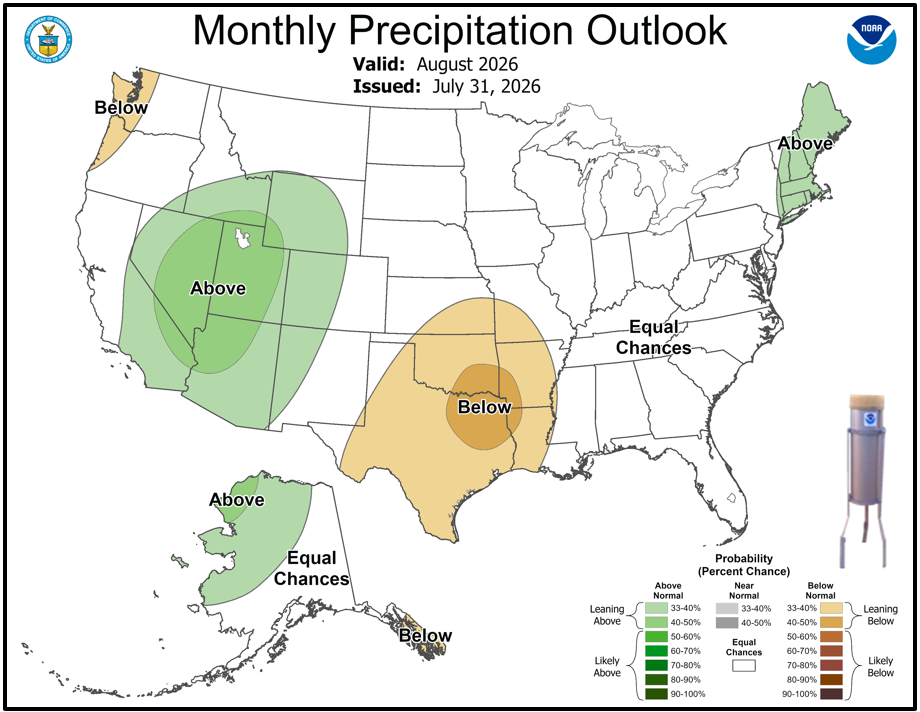
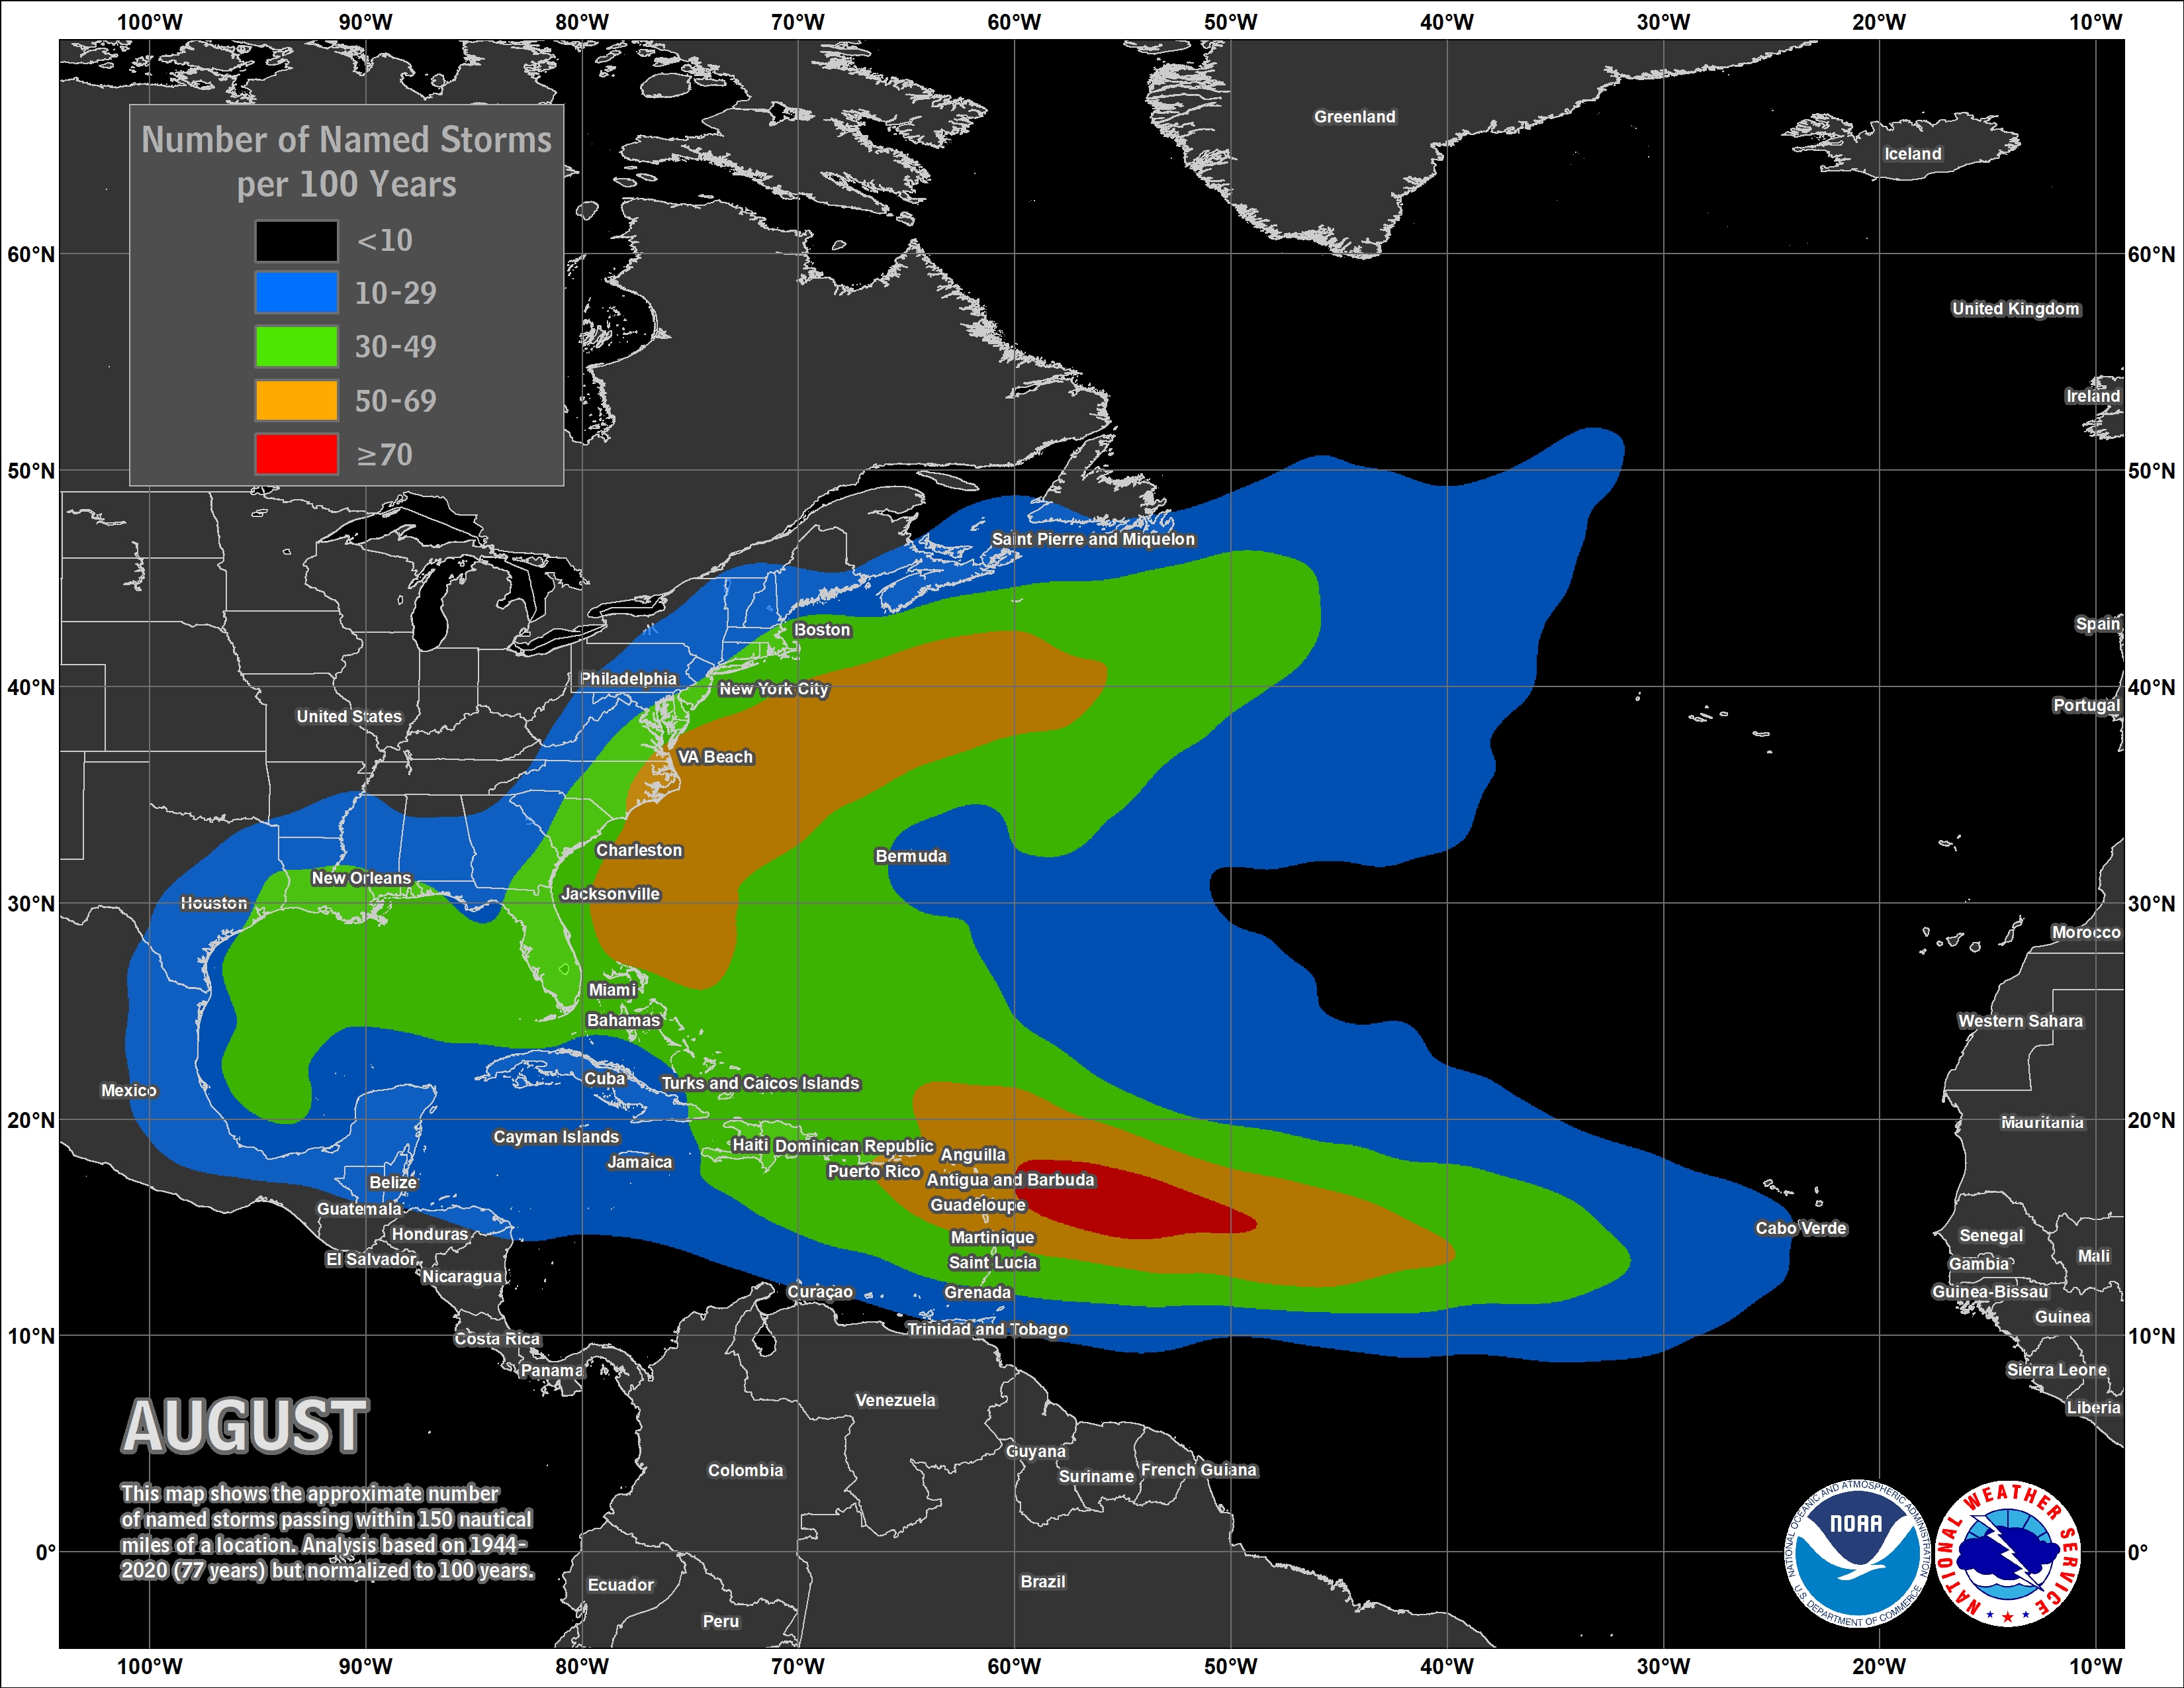
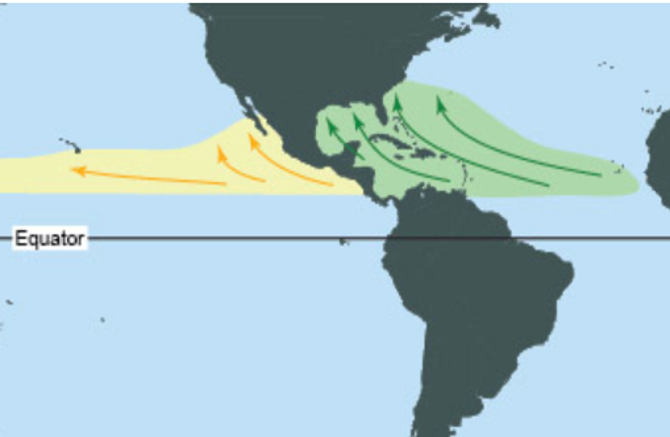
Much of the Continental U.S is favored for above normal temperatures. The southern half of the U.S. is favored to lean 40-50% above normal in August temperatures. Equal chances of above or below normal August rainfall is outlooked over the southeast U.S. and Coastal Plain. We are now moving into the beginning of the peak of the Atlantic Basin Hurricane Season where August sees typical development of tropical cyclones encompassing the Gulf to the western Atlantic to east of the Caribbean Islands known as the Main Development Region or MDR. The 2026 Atlantic Basin Hurricane Season Outlook is provided in the link below. It's highly encouraged to review your hurricane preparedness. Click on the Preparedness Tab on the NWS Mobile Tropical Webpage.
Click on the snap shots below to expand:
 August Normals August Normals |

|
Outlook |

|
|
|
Additional Climate Links:
The National Weather Service Mobile Alabama's Climate and Past Weather page provides climate data at your fingertips for many observation points in the local forecast area by accessing the NOWData tab as well as many other climate resources. The Climate Prediction Center Link provides short and longer range climatic outlooks and education about the larger scale global circulations that impact temperatures and weather. With the large agriculture and farming presence along the central Gulf coast, the Drought Monitor link provides updates on drought trends and impacts. Another very helpful resource is the Community Collaborative Rain Hail and Snow (CoCoRaHS) network, which is a large group of volunteers working together to measure and map precipitation (rain, hail, and snow). The aim of CoCoRaHS is to provide the highest quality data for natural resource, education and research applications. You can be a part of the CoCoRaHS team by becoming a volunteer rainfall observer.






 Follow us on X
 Follow us on Facebook
 Follow us on YouTube
 MOB RSS Feed
