On High Winds and Foehn Warming associated with Mountain-Wave Events in the Western Foothills of the Southern Appalachian Mountains
by
David M. Gaffin
ABSTRACT
- Extremely high winds of 40 to 49 m s-1 (90 to 110 mph) were reported across the western foothills of the southern Appalachian Mountains on 22-23 December 2004, 17 October 2006, 24-25 February 2007, and 1 March 2007. The high winds in all four of these events were determined to be the result of mountain waves, as strong southeast winds became perpendicular to the mountains with a stable boundary layer present below 750 hPa and a veering wind profile that increased with height. Adiabatic warming of the descending southeasterly winds was also observed at the Knoxville airport during all four events (although of varying intensities), with the 850-hPa air mass immediately upwind of the Smoky Mountains determined to be the source region of these foehn winds. An interesting similarity among these four events was the location of the strongest 850-hPa winds northwest of the region, with a rapidly decreasing speed gradient observed over the mountains. These 850-hPa winds northwest of the mountains were also stronger than the 700-hPa winds in the region. It was hypothesized that strong low-level divergence developed in the foothills, as the stronger 850-hPa winds on the western side accelerated away from the mountains while the mountains prevented a rapid return flow from the eastern side. This low-level divergence likely helped to further strengthen the mountain-wave-induced mesolow and high winds in the western foothills.
A twelve-year climatology of high wind events induced by mountain waves at Cove Mountain was also constructed. This climatology revealed that these events occurred primarily at night between November and March. Composite maps of mountain-wave events that produced warning-level and advisory-level winds revealed that an axis of stronger 850-hPa winds was typically located west of the mountains (away from the foothills). This finding (using reanalysis data instead of model data) further suggested that low-level divergence normally contributed to the intensity of mountain-wave-induced mesolows and winds in the western foothills of the southern Appalachian Mountains.
1. INTRODUCTION
Widespread reports of wind damage (large trees and power lines down) occurred in the southern Appalachian region
(Figure 1) on 23 December 2004, 17 October 2006, 25 February 2007, and 1 March 2007. Especially hard hit were the western foothills of the Great Smoky Mountains National Park and the Camp Creek area in the foothills of Greene County, Tennessee
(Figure 2), where numerous trees were reported down, which closed almost all roads in these areas. In addition, several homes were damaged and a few barns were destroyed in the Camp Creek area. While high winds were expected in the higher elevations during these events, the magnitude of the winds in the foothills (up to 49 m s
-1 or 110 mph) was surprising since they far exceeded the wind speeds forecasted by the operational computer models. Another surprising finding was that most of the severe damage was confined to a narrow area along the foothills of the mountains, rather than in the higher elevations where stronger winds normally occur. It was ultimately determined that the cause of the high winds in the foothills was due to mountain waves that accelerated the winds in the foothills. While mountain-wave events that have produced extremely high winds have been well documented near the Rocky Mountains of the western United States (i.e. Blier 1998; Colle and Mass 1998; Colman and Dierking 1992; Durran 1990), these events remain largely undocumented near the southern Appalachians (except for Manuel and Keighton 2003) since the southern Appalachians have fewer observation sites in and near the western foothills. Also, these mountain-wave events near the southern Appalachians are likely less frequent than their Rocky Mountain counterparts. Besides the high winds in the foothills, mountain-wave events also create a significant aviation hazard due to extreme turbulence and a temperature forecast challenge in the central and northern Great Tennessee Valley due to the adiabatic foehn warming normally associated with these events.
- Previous research has found that downslope winds generated by mountain waves are stronger on the sides of mountain ranges that have steeper leeward slopes (Queney et al. 1960; Lilly and Klemp 1979). Mountain-wave events are likely more frequent on the eastern side of the southern Appalachians, since northwest winds are climatologically more prevalent than southeasterly winds in the region. However, the steeper slopes on the western side of the southern Appalachian Mountains should theoretically generate stronger mountain waves and downslope winds than the more gently rising slopes on the eastern side (Figure 3). Unfortunately, there are not enough observation sites in the foothills and higher elevations of the southern Appalachian region to adequately verify this theory. While mountain waves can reasonably be predicted by recognizing the synoptic conditions that typically produce them, those events that resulted in extremely high winds up to 49 m s-1 (110 mph) along the western foothills of the southern Appalachians remain difficult to predict. The purposes of this study are to (1) examine the similar characteristics of the four extreme mountain-wave events of 23 December 2004, 17 October 2006, 25 February 2007, and 1 March 2007, (2) examine their associated foehn warmings in the Great Tennessee Valley, and (3) determine how operational forecasters can better anticipate and predict extreme mountain-wave events and foehn warming in the western foothills of the southern Appalachian Mountains.
2. DATA
While there are several observation sites around the southern Appalachian region, there are no Automated Surface Observing System (ASOS) sites maintained by the National Weather Service (NWS) in the mountains on the western side of the southern Appalachians or their immediate foothills. However, the National Park Service Air Resources Division maintains a network of wind observations within the Great Smoky Mountains National Park (Figure 4), including sites at Cades Cove (elevation of 564 m or 1,850 ft MSL), Look Rock (823 m or 2,700 ft MSL), Cove Mountain (1,265 m or 4,150 ft MSL), and Clingmans Dome (2,033 m or 6,670 ft MSL). The Clingmans Dome observation was only available for the 17 October 2006 event. The anemometers at these four sites not only record hourly averaged wind speeds, but they also record the peak one-second wind gusts measured during the hour.
Since an observed sounding does not exist immediately upwind of the Smoky Mountains and at the times needed to evaluate the four events, the Rapid Update Cycle (RUC) model (Benjamin et al. 2004), with a grid spacing of 40 km, was used to construct soundings for this study, as well as to analyze upper-level winds and temperatures. Previous research (Thompson et al. 2003) has found that the RUC model soundings provided a reasonable proxy for observed soundings in supercell environments. The North American Mesoscale (NAM) model (Black 1994), with a grid spacing of 12 km, was also examined to further determine the existence of mountain waves and possible reasons for the extreme winds in these events. While models with grid spacing of less than 10 km are necessary for adequately simulating mountain waves, the RUC40 and NAM12 models were ultimately used in this study since they are the best models available to operational forecasters. Model and satellite data used in this study were displayed using the Warning Event Simulator (WES) utilized by the NWS to train forecasters with archived weather events.
3. FOUR HIGH WIND EVENTS INDUCED BY MOUNTAIN WAVES IN THE WESTERN FOOTHILLS OF THE SOUTHERN APPALACHIAN MOUNTAINS
a) Damage reports and surface observations
- Strong pressure gradients were located across the southern Appalachian Mountains during the four high wind events of 23 December 2004, 17 October 2006, 25 February 2007, and 1 March 2007, as a deep low pressure area was located to the northwest of east Tennessee with a large high pressure area over the northeastern United States (Figure 5). These synoptic settings were similar to those normally expected with foehn wind events in the southern Appalachian region (Gaffin 2007), where strong southeasterly winds are observed across the mountains. Wind reports from the Great Smoky Mountains National Park revealed extremely high wind gusts of 40 to 49 m s-1 (90 to 110 mph) at Cove Mountain in the foothills of the Smoky Mountains during all four events (Figure 6). In fact, these winds at Cove Mountain were much stronger than any other observation site in the national park, including Clingmans Dome (only available for the 16-17 October 2006 event), where stronger winds are normally expected (outside of mountain-wave events) due to its higher elevation. While higher winds are normally expected at Cove Mountain compared to Cades Cove and Look Rock (due to Cove Mountain's higher elevation), the location of Cove Mountain in the foothills of the highest mountain ridges in the Great Smoky Mountains National Park likely caused Cove Mountain to experience the strongest mountain waves. In contrast to the extremely high winds reported in the foothills, winds in the Great Tennessee Valley during all four events were lighter at the four ASOS sites in the Great Tennessee Valley (Chattanooga airport, Knoxville airport, Oak Ridge, and Tri-Cities airport). During all four events, sustained southeast winds at the Chattanooga, Knoxville, and Tri-Cities airports were generally between 2.5 and 8 m s-1 (6 and 17 mph) with a few gusts to between 10 and 14 m s-1 (23 and 31 mph). The winds at Oak Ridge remained light and variable during all four events with wind speeds generally less than 2.5 m s-1 (6 mph).
- Satellite images during three of the four events (Figure 7) revealed the existence of mountain waves as evidenced by the narrow break in the clouds oriented parallel to the mountains ridges and located immediately downwind of the mountain ridges over the foothills. The times of the satellite imagery shown in Figure 7 are generally later than when the highest wind gusts were observed at Cove Mountain, since the cloud breaks first became visible at these times without the impedance of high clouds. On 25 February 2007, high clouds covered the southern Appalachian Mountains throughout the entire event, which made it impossible to determine whether any cloud breaks had developed at lower elevations around the foothills. Since these cloud breaks occur around the foothills only after mountain-wave activity has developed, it should be noted that satellite imagery can only provide operational forecasters with evidence that a mountain wave event is occurring (rather than being a predictive tool).
In addition to the high winds in the foothills, foehn warming was observed during all four cases in the central and northern Great Tennessee Valley, although with varying degrees of magnitude (Figure 8). Moderate foehn warming was observed at both the Knoxville and Tri-Cities airports during the night of 22-23 December 2004 with temperatures around 6 to 150 F (3 to 8 0C) above the surrounding sites. On 17 October 2006, minimal foehn warming observed at the Knoxville airport around sunrise, with temperatures around 1 to 70 F (1 to 4 0C) above the surrounding sites. Minimal foehn warming was again observed at the Knoxville airport during the night of 25 February 2007, with temperatures around 3 to 80 F (2 to 4 0C) above the surrounding sites. On the morning of 1 March 2007, moderate foehn warming was observed at the Knoxville and Tri-Cities airports, with temperatures around 5 to 100 F (3 to 6 0C) above the surrounding sites.
A temporal analysis (Figure 9) of temperatures and dewpoints at the Knoxville airport (TYS) compared to the Chattanooga airport (CHA) revealed the adiabatic warming at TYS during the periods of southeasterly winds. TYS was compared to CHA, since CHA normally doesn't experience foehn warming with strong southeasterly winds. With CHA's location around 130 km (78 miles) southwest of TYS and its elevation (204.5 m or 671 ft) slightly lower than TYS (293.2 m or 962 ft), CHA's temperatures are typically a few degrees warmer than TYS's throughout the year. In addition, CHA's lower temperatures during the foehn warming periods at TYS during all four events revealed that the warming at TYS was not the result of a warm frontal passage, since a warm front would have had to pass through CHA first before affecting TYS. On 23 December 2004, the temperatures at TYS rose several degrees above the temperatures at CHA during the period of southeast winds between 04 and 08 UTC. This trend was also seen during the other southeast wind periods on 17 October 2006 between 08 and 12 UTC, 25 February 2007 between 05 and 09 UTC, and 1 March 2007 between 12 and 16 UTC.
Previous research of foehn winds in the southern Appalachian region (Gaffin 2002) had determined that the 850-hPa air mass was the source region for foehn warming in the lee of the southern Appalachian Mountains. An air parcel forced down the average descent of the Smoky Mountains of around 1000 m (3300 ft) should theoretically warm 9.80 C (17.80 F) adiabatically, using the dry-adiabatic lapse rate of 9.80 C km-1 (5.40 F 1000 ft-1). In a saturated environment, the moist-adiabatic lapse rate of around 6.00 C km-1 (3.30 F 1000 ft-1) would result in 6.00 C (10.90 F) of adiabatic warming near the Smoky Mountains. By initially examining the 850-hPa temperatures immediately upwind of the Smoky Mountains, forecasters can reasonably predict the amount of foehn warming observed in the central Great Tennessee Valley.
- An examination of the 850-hPa temperatures during all four events (Figure 10) revealed that adding an adiabatic warming term of 9.80 C (17.80 F) to the 850-hPa temperatures immediately upwind of the Smoky Mountains (just to the right of the Tennessee-North Carolina border) compared well with the observed temperature at the Knoxville airport (TYS) for two of the four cases (Table 1). While the observed TYS temperature on 1 March 2007 at 15 UTC [10 local standard time (LST)] was less than the predicted TYS temperature (using the dry-adiabatic lapse rate), the observed TYS temperature had actually risen to 17.0 C (63.0 F) at 12 UTC (07 LST) before showers arrived and cooled the air between 14 and 15 UTC (09 and 10 LST). Rain was also occurring around TYS at 12 UTC on 17 October 2006, and thus the adiabatic warming would have likely followed the moist-adiabatic lapse rate, resulting in a smaller degree of warming. The observed TYS temperature of 17.0C (63.0F) compared well to the adiabatic warming of 6.00 C (10.90 F) expected using the moist-adiabatic lapse rate. Overall, the four events in this study confirmed that the 850-hPa temperatures immediately upwind of the Smoky Mountains were the likely source region of the foehn winds observed at TYS.
b. Sounding and upper-level analyses
RUC40 soundings upstream of the Smoky Mountains during all four events
(Figure 11) revealed a stable boundary layer extending up to around 750 hPa with weaker stability observed above 750 hPa. The weaker stability observed above 750 hPa in all four events was in agreement with Queney et al. (1960), who concluded that weaker stability at higher levels in the upstream environment can lead to low-level amplification of the mountain wave. A veering wind profile was also observed during each event with winds also increasing in speed with height. Winds were nearly perpendicular to the mountains up to around 750 hPa in each event, but then became parallel to the mountains around 750 hPa and above. Clark and Peltier (1984) found in a numerical modeling study that critical levels (where the flow reverses direction at some height) can reflect large-amplitude mountain waves, and, under the proper conditions, such a reflection can lead to a low-level amplification of the mountain wave, which in turn will strengthen the flow along the lee slopes. Thus, as these veering winds became parallel with the southwest-to-northeast-oriented mountain ridges, they likely formed a reflective critical-layer surface, which amplified the mountains waves and resulting winds. Previous research by Smith (1985) produced an equation to estimate the wind speeds induced by nonlinear amplification below wave-induced critical levels:
- u = U0 (1 + d coslz)
where d = p/2 - H0l and l = N0/U0. The parameter N0 is the Brunt-Vaisala frequency, U0 is the average stable-layer wind upstream of the mountain barrier, and H0 and z are the height of the dividing streamline. The estimated winds derived from this equation during all four events were an average of 8 m s-1 (18 mph) too slow compared to the observed hourly averaged winds and 26 m s-1 (58 mph) too slow compared to the observed wind gusts. While the Smith model's winds are only a qualitative estimate, this theoretical underestimation could indicate that other processes possibly contributed to the intensification of the extremely high winds in the western foothills of the southern Appalachian Mountains.
- An interesting similarity in all four events was the location of the strongest 850-hPa winds (Figure 12) west of the southern Appalachian Mountains, with a strong decreasing gradient located directly over the mountains. Since RUC40 model data were used for this 850-hPa analysis, some of the increase in the 850-hPa winds to the west of the mountains may have resulted from the model-simulated mountain waves. Thus, the 850-hPa winds generated by the higher-resolution NAM and Nested Grid Model (NGM; Hoke et al. 1989) were checked and found to have also included a strong 850-hPa jet in the same locations and close to the same intensities as the RUC40 analysis. Since both the NAM80 and NGM80 models have a grid spacing of 80 km (and thus a lesser ability or inability to simulate mountain waves), they should have less or possibly no mountain-wave contamination in their 850-hPa winds. The NAM80 850-hPa winds were generally 2.5 to 5 m s-1 (5 to 10 kt) faster than the RUC40 winds, while the NGM80 850-hPa winds were generally 2.5 to 5 m s-1 (5 to 10 kt) slower. Thus, it appeared that the RUC40 850-hPa winds were likely close to reality with minimal contamination from the model-simulated mountain waves. The stronger 850-hPa winds located west of the southern Appalachian Mountains may have helped to strengthen the mountain-wave-induced mesolow and high winds by creating strong low-level divergence in the foothills of the Smoky Mountains. This low-level divergence was likely created as the stronger 850-hPa winds accelerated away from the mountains, while the mountains inhibited the southeast winds on the windward side from quickly replacing the departing 850-hPa air on the leeward side. Observations of pressure and wind from Cove Mountain during all four events (Figure 13) appeared to confirm the existence of a mesolow in the foothills. While pressures were falling across the entire southern Appalachian region as cold fronts approached during all four events, the pressure values at Cove Mountain dropped more quickly near the time of peak wind gusts as the mountain waves developed in the foothills and the 850-hPa winds strengthened to the west. While mesolows are normally created by mountain waves in the lee of mountain ranges, the mesolows observed near the western foothills of the southern Appalachian Mountains were likely strengthened further by the low-level divergence created by the stronger 850-hPa winds to the west of the mountains.
The 700-hPa winds (Figure 14) were generally the same speed as the 850-hPa winds over the mountains, but were much weaker west of the Appalachians where the stronger 850-hPa winds were observed. The southwesterly 700-hPa winds (which were parallel to the mountain ridges in three of the four events) likely created a critical level that helped to reflect and amplify mountain waves along the western slopes. While the 700-hPa winds at 06 UTC on 23 December 2004 appeared to be more southerly than southwesterly over the southern Appalachian Mountains, the sounding from that event revealed that the upper-level winds became southwesterly at a slightly higher level (around 650 hPa). At 250 hPa (Figure 15), the southern Appalachian region appeared to be located near the right exit regions of jet streaks during all four events (and also the left entrance region of a second jet streak on 1 March 2007). The associated large-scale subsidence in these regions likely helped to strengthen the stable boundary layer observed over the southern Appalachian Mountains during all four events.
While operational computer models do not have the resolution necessary to predict (or confirm) a mountain-wave-induced mesolow in the foothills, operational forecasters can utilize these models to help anticipate the possibility of a mountain-wave event. Previous research (Lindley et al. 2006) has shown that strong downward vertical velocities over the mountains can be predicted by the operational computer models, which have helped operational forecasters anticipate mountain-wave events in the western United States. In addition to the downward vertical velocities, lines of potential temperature are expected to steepen and become mostly vertical over the mountains during mountain-wave events. However, computer models with horizontal grid-space resolutions of less than 10 km are needed to predict this scenario. RUC40 cross sections oriented over the southern Appalachian Mountains during all four events (Figure 16) revealed strong downward vertical velocities over the mountains, but nearly horizontal lines of potential temperature over the mountains. The operational model with the finest horizontal grid-spacing resolution during these four events was the NAM, with a resolution of 12 km. NAM12 cross sections oriented over the southern Appalachian Mountains during all four events (Figure 17) gave some better indications of mountain waves with stronger downward vertical velocities over the mountains and more vertical potential temperature lines over the mountains.
4. CLIMATOLOGY OF HIGH WIND EVENTS INDUCED BY MOUNTAIN WAVES AT COVE MOUNTAIN
Wind observations at Cove Mountain began on 1 November 1995. Thus, a twelve-year climatology of high wind events induced by mountain waves is possible between 1996 and 2007. A high wind event (requiring the issuance of a High Wind Warning) is defined by the NWS as one that produces sustained wind speeds of at least 18 m s-1 (40 mph), or wind gusts of at least 26 m s-1 (58 mph), for an hour or longer. Using this NWS criteria, dates when Cove Mountain observed hourly averaged southeast winds (between 90 and 1800) of at least 18 m s-1 (40 mph) were determined between 1996 and 2007. After these dates were found (a total of 84), the observed Atlanta sounding [located 38 km (23 miles) south-southwest of the Atlanta airport] was analyzed on these dates to make sure that a stable layer extended from the surface up to at least 800 hPa (in order to extend above the highest ridge tops) and a veering wind profile was present. It's possible that some of the 72 total events found with this methodology may have resulted from strong synoptic-scale gradients instead of mountain waves. However, this methodology likely gave a good estimate of how many high wind events at Cove Mountain resulted from mountain waves, since it covered many of the necessary ingredients for mountain-wave formation including a strong southeasterly wind (perpendicular to the mountain ridges), an upstream stable boundary layer extending above the mountain tops, and a veering wind profile (which eventually produced a critical layer).
- Overall, warning-level wind events that were likely induced by mountain waves were found to have occurred at Cove Mountain an average of six times per year, with the years 1997 and 2006 recording the highest number of occurrences (Figure 18). The distribution of these high wind events by year was compared to El Nino and La Nina years, but no significant correlation to these climatological cycles was found. The number of high wind events by month revealed that these events occurred primarily between November and March, with December recording the highest number of events and no events occurring during the summer. This monthly distribution was similar to those of previous studies of downslope windstorms in the western United States (Julian and Julian 1969; Colle and Mass 1998; Raphael 2003). The higher frequency of high wind events induced by mountain waves during the cooler half of the year was likely due to the fact that synoptic-scale systems with stronger winds and more stable air masses typically affect the southern Appalachian region during this time. These high wind events at Cove Mountain were also found to occur mainly during the nighttime hours between 18 and 06 LST. This temporal maximum during the nighttime hours compared well with previous studies of strong downslope winds in the foothills of the Rocky Mountains near Boulder, Colorado (Julian and Julian 1969; Whiteman and Whiteman 1974). The increased nocturnal frequency of high wind events induced by mountain waves at Cove Mountain was likely the result of a greater frequency of stable boundary layers at night.
- To help operational forecasters determine whether to issue a High Wind Warning or a lesser Wind Advisory for a mountain-wave event, the dates when weaker mountain-wave-induced winds occurred at Cove Mountain were also determined. Wind Advisories are issued by the NWS for weaker wind events, which for this study was defined as sustained wind speeds of 11 to 17 m s-1 (25 to 39 mph) for an hour or longer. After determining the advisory-level wind dates, composite maps of surface isobars, surface temperatures, 850-hPa isotachs, and 700-hPa isoheights for both warning-level and advisory-level events were then constructed from the National Centers for Environmental Prediction-National Center for Atmospheric Research reanalysis dataset (Kalnay et al. 1996) on the National Oceanic and Atmospheric Administration-Cooperative Institute for Research in Environmental Sciences Climate Diagnostics Centers Web site.
The composite maps of surface isobars (Figure 19) revealed a low pressure system over the mid-Mississippi River Valley (northwest of the southern Appalachian Mountains) with an area of high pressure centered off the mid-Atlantic coast during both warning-level and advisory-level wind events. A deeper low pressure area was observed with the warning-level wind events (compared to the advisory-level events), which resulted in a stronger pressure gradient across the southern Appalachian Mountains. In both the warning-level and advisory-level composite maps, the surface temperatures revealed that cold air damming was occurring across the eastern side of the Appalachian Mountains. This cold air damming was a little stronger with the advisory-level events (compared to the warning-level events), while warmer temperatures were further north on the western side of the southern Appalachian Mountains with the warning-level events. The combination of a weaker low pressure system over the mid-Mississippi River Valley and stronger cold air damming (a blocked boundary layer) on the eastern side (upwind) of the southern Appalachian Mountains likely caused the wind flow below 700 hPa to be weaker during the advisory-level events.
The composite maps of upper-level features (Figure 20) revealed stronger 850-hPa winds with the warning-level wind events (compared to the advisory-level wind events), with the axis of strongest 850-hPa winds located west of the southern Appalachian Mountains in both cases. This finding (using reanalysis data) further suggested that the stronger 850-hPa winds observed to the west of the mountains in the four individual events (using RUC40 data) were real and not completely contaminated by the model-simulated mountain waves. While the stronger 850-hPa flow in the warning-level events favored a more amplified wave, the stronger 850-hPa winds located west of the mountains in both warning-level and advisory-level events suggested that low-level divergence could have typically contributed to the strengthening of the mountain-wave-induced mesolow and high winds in the western foothills of the southern Appalachian Mountains. A 700-hPa trough axis was also evident across the Mississippi River Valley during both warning-level and advisory-level events, which produced the southwest winds over the southern Appalachian Mountains that resulted in the critical level necessary for the amplification of mountain waves. An examination of the composite maps of 250-hPa winds revealed that the southern Appalachian Mountains were normally located near the right entrance region of a jet streak during both warning-level and advisory-level events. This finding would suggest that the large-scale subsidence observed during the four individual events was not necessarily a requirement for most mountain-wave events at Cove Mountain.
5. CONCLUSIONS
Whenever strong southeasterly low-level winds, a stable boundary layer extending above the mountain ridges, and veering wind profiles are expected over the southern Appalachian Mountains, forecasters should consider the possibility of mountain waves in the western foothills, as well as adiabatic warming due to foehn winds in the central and northern Great Tennessee Valley. A climatology of high winds induced by mountain waves at Cove Mountain revealed that they typically occurred at night between November and March. Also, these mountain-wave- induced high winds typically occurred when a low pressure system was located over the mid-Mississippi River Valley with cold air damming on the eastern side of the southern Appalachian Mountains. In addition to mountain-wave-induced high winds, adiabatic warming at the Knoxville airport of around 100 C (180 F) above the 850-hPa temperatures can also be expected whenever strong southeast winds develop throughout the boundary layer. However, the presence of rain will lessen the adiabatic warming to only around 60 C (10.90 F) above the 850-hPa temperatures (due to the moist-adiabatic lapse rate). Adiabatic warming also occurs at the Tri-Cities airport during periods of southeast winds, but of a lesser magnitude (~70 C or 120 F using the dry-adiabatic lapse rate) than the Knoxville airport since the average descent of the Appalachian Mountains is not as great near the Tri-Cities airport. Overall, forecasters should concentrate on the 850-hPa temperatures just upwind of the Smoky Mountains (on the North Carolina side) as the source region of the foehn winds in the Great Tennessee Valley.
Another interesting finding that was observed during all four high wind events, as well as in the composite maps of all mountain-wave-induced wind events, was the location of the strongest 850-hPa winds west of the southern Appalachian Mountains. While mesolows are normally created by mountain waves in the lee of mountain ranges, the mesolows observed near the western foothills of the southern Appalachian Mountains were likely strengthened further by the low-level divergence created as the stronger 850-hPa winds west of the mountains accelerated away from the mountains while the mountains inhibited a rapid return flow from the eastern side. The composite maps from warning-level events revealed that the 850-hPa winds west of the southern Appalachian Mountains were typically around 22 m s-1 (43 kt), while the composite maps from advisory-level events revealed that the 850-hPa winds were typically around 14 m s-1 (27 kt). Peak wind gusts observed at Cove Mountain (in the foothills of the Smoky Mountains) during the four individual events were around 15 m s-1 (30 kt) greater than the 850-hPa winds forecasted by the computer models over the Smoky Mountains. Forecasters could use this finding as a possible "rule of thumb" for estimating winds in the foothills with future mountain-wave events by recognizing the threat that a stronger 850-hPa jet west of the Smoky Mountains can pose. When a stronger 850-hPa jet is forecasted to occur west of the mountains, forecasters should consider applying at least an additional 15 m s-1 (30 kt) of wind to that forecasted by the operational computer models directly over the mountains. Although operational computer models cannot fully simulate mountain waves due to their coarse resolutions, they can give some clues of the possibility of mountain waves such as strong downward vertical velocities and steepening potential temperature lines in cross sections oriented over the mountains.
- Some thoughts for future research include using higher-resolution models to confirm whether low-level divergence was created by the observed stronger 850-hPa winds west of the southern Appalachian Mountains, and to determine how much this divergence may have contributed to the strengthening of the mesolow and high winds in the western foothills. Also, future modeling studies should also attempt to determine if the frequent reports of wind damage at Camp Creek (in the foothills of Greene County) are the result of accelerating winds in the French Broad Valley of North Carolina as southeast winds are possibly constricted as they flow up through the valley. An examination of the NAM12 850-hPa winds over the French Broad Valley during the four events of 23 December 2004, 17 October 2006, 25 February 2007, and 1 March 2007 (Figure 21) appeared to indicate stronger winds in the French Broad Valley of western North Carolina, which may explain the high frequency of damage reports in the Camp Creek area of Greene County.
6. ACKNOWLEDGMENTS
The author would like to thank Jim Renfro of the Great Smoky Mountains National Park as well as Gloria Mercer and Jessica Ward of Air Resource Specialists, Inc. for their help with the Smoky Mountain wind data. Also, thanks to David Hotz (Science and Operations Officer at WFO Morristown) for his computer assistance with the WES system and the three anonymous reviewers for their helpful and constructive comments.
7. REFERENCES
Benjamin, S. G., and Coauthors, 2004: An hourly assimilation-forecast cycle: The RUC. Mon. Wea. Rev., 132, 495-518.
Black, T., 1994: The new NMC mesoscale Eta model: Description and forecast examples. Wea. Forecasting, 9, 265-278.
Blier, W., 1998: The Sundowner winds of Santa Barbara, California. Wea. Forecasting, 13, 702-716.
Clark, T. L., and W. R. Peltier, 1984: Critical level reflection and the resonant growth of nonlinear mountain waves. J. Atmos. Sci., 41, 3122-3134.
Colle, B. A., and C. F. Mass, 1998: Windstorms along the western side of the Washington Cascade Mountains. Part I: a high-resolution observational and modeling study of the 12 February 1995 event. Mon. Wea. Rev., 126, 28-52.
_____________________, 1998: Windstorms along the western side of the Washington Cascade Mountains. Part II: characteristics of past events and three-dimensional idealized simulations. Mon. Wea. Rev., 126, 53-71.
Colman, B. R., and C. F. Dierking, 1992: The Taku winds of southeast Alaska: Its identification and prediction. Wea. Forecasting, 7, 49-64.
Durran, D. R., 1990: Mountain waves and downslope winds. Atmospheric Processes over Complex Terrain, Meteor. Monogr., No. 45, Amer. Meteor. Soc., 59-81.
Gaffin, D. M., 2002: Unexpected warming induced by foehn winds in the lee of the Smoky Mountains. Wea. Forecasting, 17, 907-915.
______, 2007: Foehn winds that produced large temperature differences near the southern Appalachian Mountains. Wea. Forecasting, 22, 145-159.
Hoke, J. E., N. A. Phillips, G. J. DiMego, J. J. Tuccillo, and J. G. Sela, 1989: The Regional Analysis and Forecast System of the National Meteorological Center. Wea. Forecasting, 4, 323-334.
Julian L. T., and P. R. Julian, 1969: Boulder?s winds. Weatherwise, 22, 108-112.
Kalnay, E., and Coauthors, 1996: The NCEP/NCAR Reanalysis 40-Year Project. Bull. Amer. Meteor. Soc., 77, 437-471.
Lilly, D. K., and J. B. Klemp, 1979: The effects of terrain shape on nonlinear hydrostatic mountain waves. J. Fluid Mech., 95, 241-261.
Lindley, T. T., C. Lindsey, and J. Cupo, 2006: An operational technique used to detect "mountain wave signatures": A forecast methodology for severe westerly winds in the mountains of west Texas. Preprints, 12th Conf. on Mountain Meteorology, Santa Fe, NM, Amer. Meteor. Soc., 15.4. [Available online at https://ams.confex.com/ams/pdfpapers/110055.pdf.]
Manuel P., and S. Keighton, 2003: Anticipating damaging foehn windstorms east of the central Appalachians. Preprints, 10th Conf. on Mesoscale Processes, Portland, OR, Amer. Meteor. Soc., P2.20. [Available online at https://ams.confex.com/ams/pdfpapers/62410.pdf.]
Queney, P., G. Corby, N. Gerbier, H. Koschmieder, and J. Zierep, 1960: The airflow over mountains. WMO Tech. Note 34, 135 pp. [Available from World Meteorological Organization, P.O. Box 2300, CH-1211 Geneva 2, Switzerland.]
Raphael, M. N., 2003: The Santa Ana winds of California. Earth Interactions, 7.
Smith, R. B., 1985: On severe downslope winds. J. Atmos. Sci., 23, 2597-2603.
Thompson, R. L., R. Edwards, J. A. Hart, K. L. Elmore, and P. Markowski, 2003: Close proximity soundings within supercell environments obtained from the Rapid Update Cycle. Wea. Forecasting, 18, 1243-1261.
Whiteman, C., D., and J. G. Whiteman, 1974: A historical climatology of damaging downslope windstorms at Boulder, Colorado. NOAA Tech. Rep. ERL 336-APCL 35, 62 pp.
Table 1. Comparison of predicted and observed foehn warmings at the Knoxville airport (TYS).
| Time and Date |
850-hPa temperature (immediately upwind of the Smokies) |
Predicted TYS temperature (using the dry adiabatic lapse rate |
Observed TYS temperature |
| 06 UTC (1 am LST) on 23 December 2004 |
7 0C (45 0F) |
17 0C (62 0F) |
17 0C (62 0F) |
| 12 UTC (8 am LDT) on 17 October 2006 |
11 0C (52 0F) |
21 0C (70 0F) |
17 0C (63 0F) |
| 06 UTC (1 am LST) on 25 February 2007 |
6 0C (43 0F) |
16 0C (61 0F) |
16 0C (61 0F) |
| 15 UTC (10 am LST) on 1 March 2007 |
8 0C (46 0F) |
18 0C (64 0F) |
13 0C (56 0F), but 17 0C (63 0F) at 12 UTC (7 am LST) |
Figure 1. (top) Location of southern Appalachian region (shaded area) in relation to the United States with (bottom) relief and county map of the southern Appalachian region [color legend denotes elevations (ft x 1,000 MSL; 1 ft = 0.3048 m); lines denote county boundaries; boldface lines denote state boundaries; line across the mountains denotes the cross-section axis used in Figure 3].
Figure 2. Observation sites across the southern Appalachian region: damage-reporting sites in capital letters, state names in boldface capital letters, lines denote county boundaries, boldface lines denote state boundaries, and the shaded area denotes the Great Smoky Mountains National Park.
Figure 3. Vertical cross-section profile (inset at the top right indicates cross-section axis) of the Smoky Mountains from (left) the northwest to (right) the southeast.
Figure 4. Contoured elevation map of the Great Smoky Mountains National Park and surrounding areas (contours in feet; boldface line denotes park boundary) with the locations of the observations sites in or near the park.
Figure 5. Surface frontal analyses of the eastern United States with isobars (hPa - 1000) at (top) 06 UTC 23 December 2004, (second) 12 UTC 17 October 2006, (third) 06 UTC 25 February 2007, and (bottom) 15 UTC 1 March 2007.
Figure 6. Peak one-second wind gusts (m s-1) from each hour at the Great Smoky Mountains National Park sites on (top) 22-23 December 2004, (second) 16-17 October 2006, (third) 24-25 February 2007, and (bottom) 1-2 March 2007. (Some data were missing on 23 December 2004 and 17 October 2006.)
Figure 7. Infrared and visible satellite images of the southern Appalachian region (arrows point to cloud breaks induced by mountain waves) at (top) 0915 UTC 23 December 2004, (second) 1531 UTC 17 October 2006, (third) 0615 UTC 25 February 2007, and (bottom) 1825 UTC 1 March 2007.
Figure 8. Surface plots of observations [temperatures in 0F (0F = {0C x 9/5} + 32)]; wind barbs in kt (1 kt = 0.514 m s-1)] with isotherms every 5 0F at (top) 06 UTC 23 December 2004, (second) 12 UTC 17 October 2006, (third) 06 UTC 25 February 2007, and (bottom) 15 UTC 1 March 2007.
Figure 9. Hourly temperatures and dewpoints (0C) from the Knoxville and Chattanooga airports on (top) 22-23 December 2004, (second) 16-17 October 2006, (third) 24-25 February 2007, and (bottom) 1-2 March 2007.
Figure 10. The 850-hPa temperatures (0C) from the RUC40 model at (top) 06 UTC 23 December 2004, (second) 12 UTC 17 October 2006, (third) 06 UTC 25 February 2007, and (bottom) 15 UTC 1 March 2007.
Figure 11. RUC40 model soundings (wind barbs in kt) along the eastern foothills of the southern Appalachian Mountains at (top) 06 UTC 23 December 2004, (second) 12 UTC 17 October 2006, (third) 06 UTC 25 February 2007, and (bottom) 15 UTC 1 March 2007.
Figure 12. The 850-hPa winds and isotachs (wind barbs in kt; light shading denotes wind speeds greater than 50 kt; dark shading denotes wind speeds greater than 70 kt) from the RUC40 model at (top) 06 UTC 23 December 2004, (second) 12 UTC 17 October 2006, (third) 06 UTC 25 February 2007, and (bottom) 15 UTC 1 March 2007.
Figure 13. Observations of hourly-averaged wind speed (m s-1) and pressure (hPa) at Cove Mountain on (top) 22-23 December 2004, (second) 16-17 October 2006, (third) 24-25 February 2007, and (bottom) 1-2 March 2007. (Some data were missing on 17 October 2006.)
Figure 14. The 700-hPa winds and isotachs (wind barbs in kt; light shading denotes wind speeds greater than 50 kt; dark shading denotes wind speeds greater than 70 kt) from the RUC40 model at (top) 06 UTC 23 December 2004, (second) 12 UTC 17 October 2006, (third) 06 UTC 25 February 2007, and (bottom) 15 UTC 1 March 2007.
Figure 15. The 250-hPa winds and isotachs (wind barbs in kt) from the RUC40 model at (top) 06 UTC 23 December 2004 (light shading denotes wind speeds greater than 100 kt; dark shading denotes wind speeds greater than 120 kt), (second) 12 UTC 17 October 2006 (light shading denotes wind speeds greater than 70 kt; dark shading denotes wind speeds greater than 90 kt), (third) 06 UTC 25 February 2007 (light shading denotes wind speeds greater than 80 kt; dark shading denotes wind speeds greater than 100 kt), and (bottom) 15 UTC 1 March 2007 (light shading denotes wind speeds greater than 95 kt; dark shading denotes wind speeds greater than 115 kt).
Figure 16. RUC40 model cross sections of potential temperature (0K; dotted lines) and vertical velocity (-ubar s-1; solid and dashed lines) across the Smoky Mountains at (top) 06 UTC 23 December 2004, (second) 12 UTC 17 October 2006, (third) 06 UTC 25 February 2007, and (bottom) 15 UTC 1 March 2007.
Figure 17. NAM12 model cross sections of potential temperature (0K; dotted lines) and vertical velocity (-ubar s-1; solid and dashed lines) across the Smoky Mountains at (top) 06 UTC 23 December 2004, (second) 12 UTC 17 October 2006, (third) 06 UTC 25 February 2007, and (bottom) 15 UTC 1 March 2007.
Figure 18. Number of high wind events induced by mountain waves at Cove Mountain by (top) year, (middle) month, and (bottom) hour.
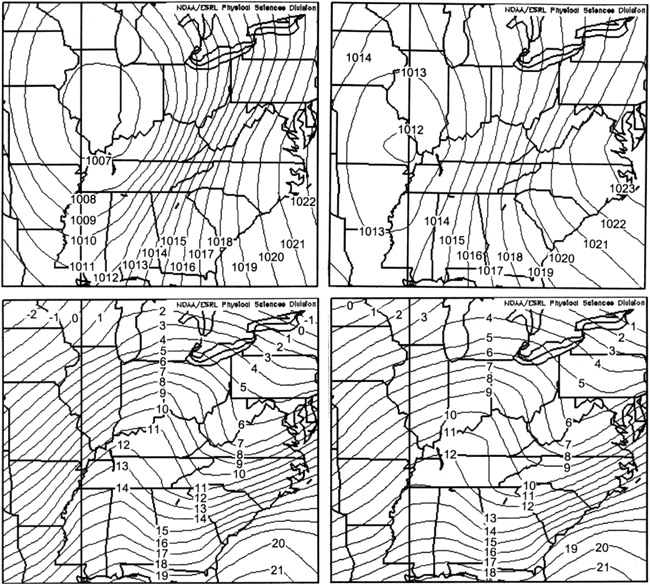
Figure 19. Surface composite maps of isobars (hPa) during (top left) warning-level events and (top right) advisory-level events, and temperatures (0C) during (bottom left) warning-level events and (bottom right) advisory-level events.
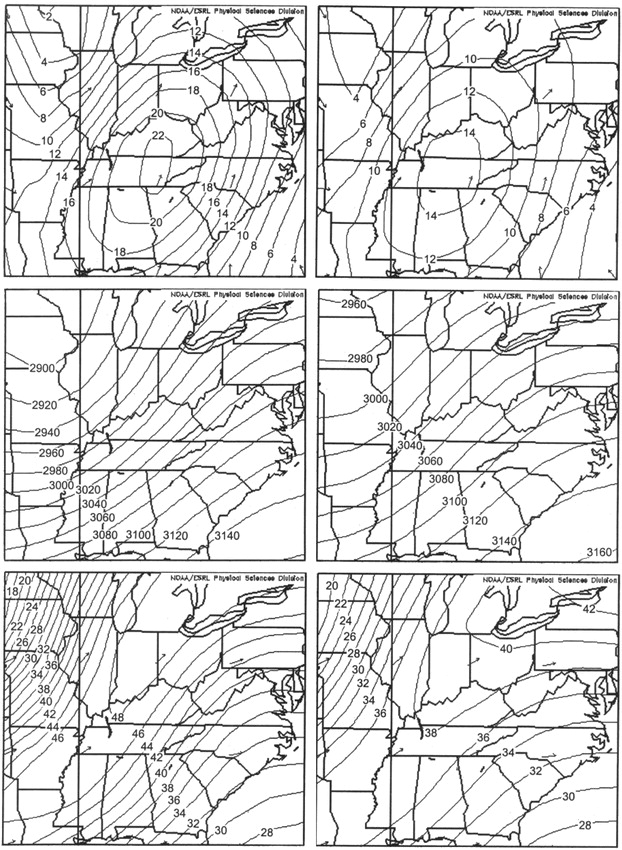
Figure 20. Upper-level composite maps of 850-hPa isotachs (m s-1) during (top left) warning-level events and (top right) advisory-level events; 700-hPa isoheights (m) during (middle left) warning-level events and (middle right) advisory-level events; and 250-hPa isotachs (m s-1) during (bottom left) warning-level events and (bottom right) advisory-level events.
Figure 21. The 850-hPa winds and isotachs (wind barbs in kt; light shading denotes wind speeds greater than 50 kt; dark shading denotes wind speeds greater than 70 kt) from the NAM12 model at (top) 06 UTC 23 December 2004, (second) 12 UTC 17 October 2006, (third) 06 UTC 25 February 2007, and (bottom) 15 UTC 1 March 2007.


 Local Radar
 Huntsville Radar
 Regional Satellite
 Graphical Forecast
 Weather Map