An Evaluation of Temperature Variations around the Great Smoky Mountains National Park and their Associated Synoptic Weather Patterns
by
David M. Gaffin, David G. Hotz, and Terry I. Getz
1. Introduction
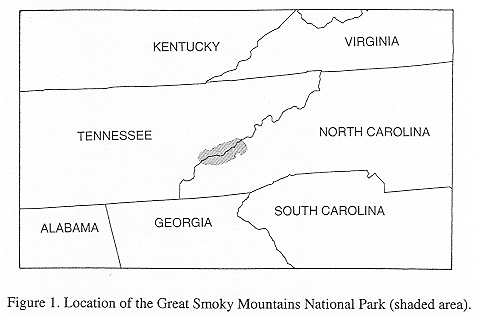
- The Great Smoky Mountains National Park (GSMNP) located in eastern Tennessee and western North Carolina (Fig. 1) contains some of the highest and most varying terrain in the eastern United States. The National Weather Service Weather Forecast Office (WFO) at Morristown, Tennessee has responsibility for issuing public zone forecasts for the Tennessee side of the park and fire weather forecasts for the entire park. Forecasters at WFO Morristown generally forecast temperatures in the southern Appalachian Mountains up to around 5000 ft MSL, since Highway 441 (the main road through GSMNP) crosses Newfound Gap at this elevation. A need existed for a study to determine the general range of temperatures observed in the complex terrain during different seasons and synoptic weather patterns. The purpose of this study is to (1) examine seasonal differences in the average temperatures around the Great Smoky Mountains National Park and (2) compare daily temperature differences to their associated synoptic weather patterns.
2. Data and Analysis
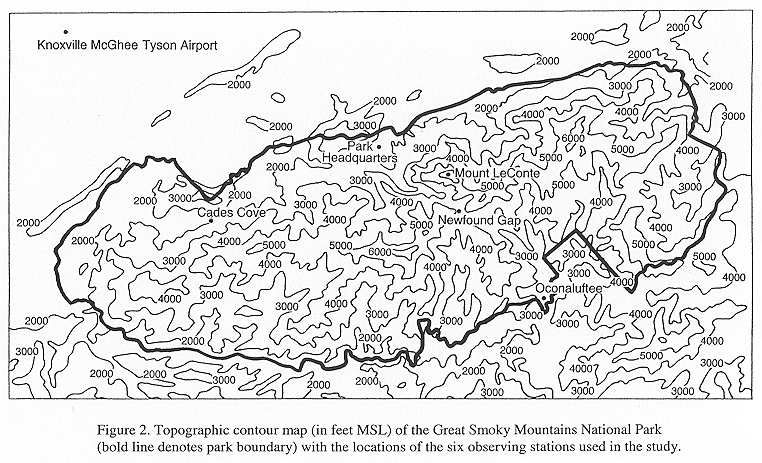
- Ten years of temperature data (March 1991 through February 2001) for the Great Smoky Mountains National Park were obtained from the National Park Service archive of five daily reporting stations. These five stations report the high and low temperatures as of 7 a.m. LST each day, and are located at the Park Headquarters (elevation ~1600 ft MSL), Cades Cove (elevation ~1900 ft MSL), Oconaluftee (elevation ~2200 ft MSL), Newfound Gap (elevation ~5000 ft MSL), and Mount LeConte (elevation ~6400 ft MSL) (Fig. 2). Temperature data from the Knoxville McGhee Tyson Airport (elevation ~1000 ft MSL) were also used in this study, since this is the National Weather Service's official reporting site for the central east Tennessee region. Using hourly temperature data from the National Climatic Data Center (NCDC), the high and low daily temperatures for McGhee Tyson Airport were recalculated to a 7 a.m. to 7 a.m. LST time-frame, instead of the normal midnight to midnight LST time-frame. This was done in order to make the McGhee Tyson Airport data comparable to the GSMNP temperature data.
- These ten years of temperature data were then entered into spreadsheet software in order to generate graphs of the temperature trends between two stations. A quality control check was used when necessary, mainly with the GSMNP data, when more than two consecutive days of similar low temperatures were noted. This check involved comparing the low temperature with the 7 a.m. LST observed temperatures (from that day and the previous day) to determine if the low temperature should be changed to the lowest observed temperature of the two. There were only a few instances (~ 40) during the ten years where the low temperature was changed with this quality control measure. Line graphs were then composed and analyzed for interesting temperature trends. The Daily Weather Maps publication, which displays the 1200 UTC surface and 500 mb charts from the daily Hydrometeorological Prediction Center analysis, was used to determine the synoptic conditions which produced the interesting temperature trends between the stations.
3. Seasonal Temperature Differences
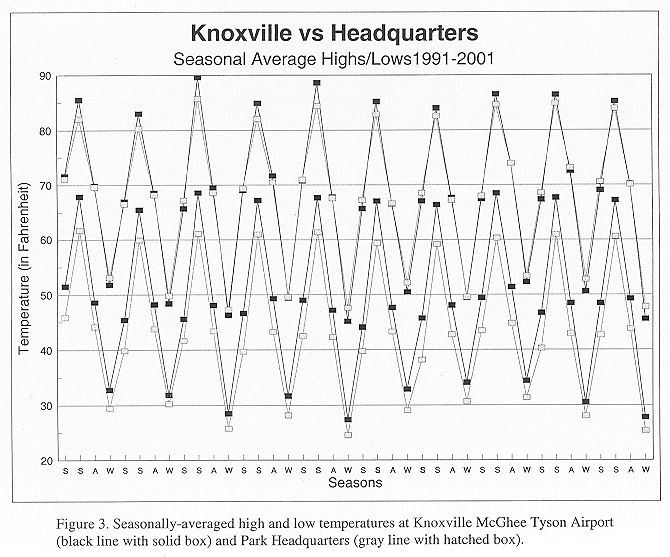
- Seasonal (three month) averages were computed from the temperature data in order to examine the seasonal temperature differences between stations (Table 1). Park Headquarters was used as the base station for comparison to the other five stations used in this study. When comparing Park Headquarters to Knoxville McGhee Tyson Airport (TYS) (Fig. 3), it was found that TYS was one to five degrees warmer on average than Park Headquarters. This can be somewhat attributed to the small elevation difference of around 600 ft. The largest temperature differences on average were observed during the summer, with the smallest temperature differences observed during the winter (TYS highs were actually cooler than Park Headquarters on average during the winter). This is likely due to the fact that the Park Headquarters station is located in a small field immediately surrounded by a heavily wooded area, while TYS is located in a more open field with no trees in the immediate vicinity. The additional cooling provided by the shade and transpiration of the trees at Park Headquarters would become more noticeable during the summer. Also, since TYS is located in a more urbanized and populated area, the urban heat island effect may have contributed to the consistently warmer average low temperatures (three to seven degree differences) there, especially during the summer. This heat island effect was most noticeable when observing the relatively small differences between the high temperatures (0.30 to 2.50F) and the larger temperature differences between the low temperatures (2.90 to 6.80F). Karl et al. (1988) concluded that urbanization increases the diurnal minima and the daily means in all seasons.
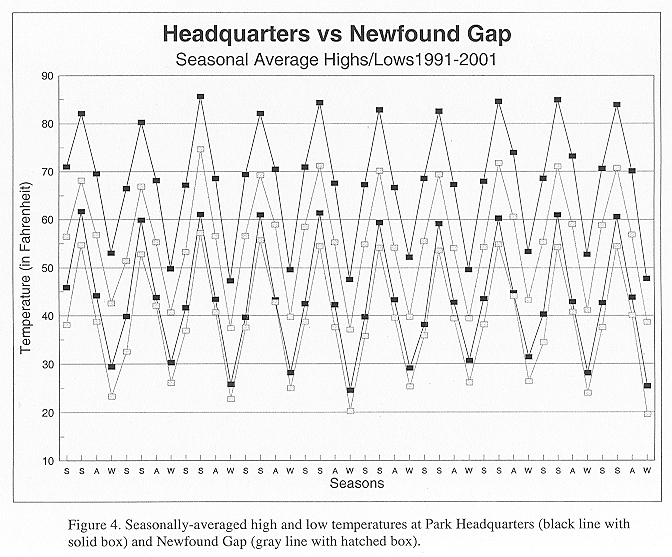
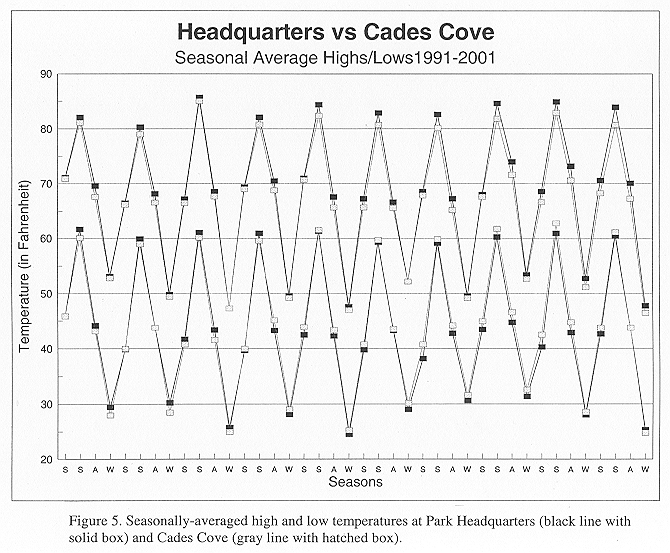
- When compared to Newfound Gap, Park Headquarter's seasonally-averaged high temperatures were generally around 100 to 130F warmer (Fig. 4). This translated into a lapse rate similar to the moist adiabatic lapse rate of 3.30F per 1000 ft. The seasonal differences between the average low temperatures were much smaller (30 to 60F) and likely the result of frequent temperature inversions developing in the morning, especially during the autumn months. In general, the seasonal differences between Cades Cove and Park Headquarters (Fig. 5) were minimal (around a degree or less). The largest differences (of only two degrees) were noted with the average high temperatures during the summer and autumn.
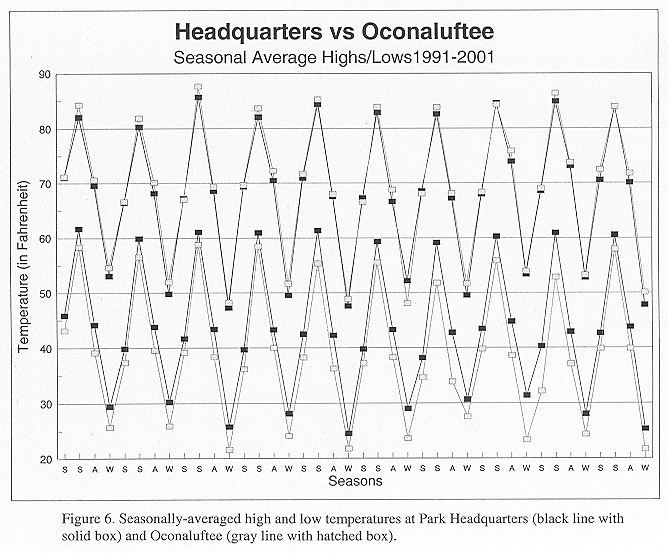
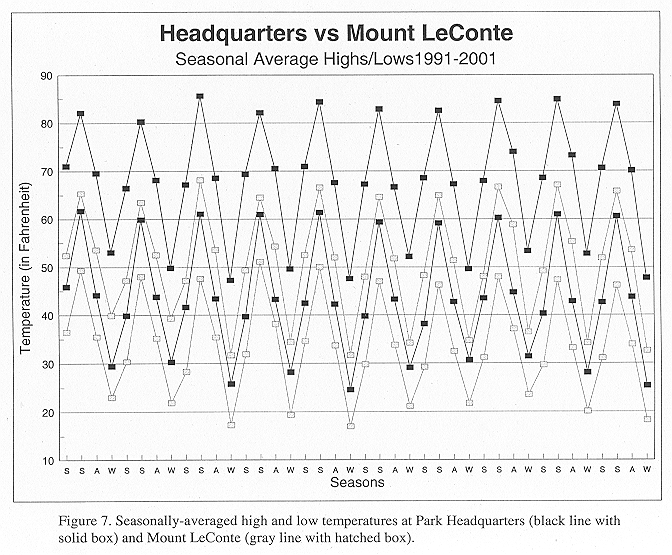
- The temperature differences between Oconaluftee, which was the only station located in western North Carolina, and Park Headquarters revealed an interesting pattern (Fig. 6). The average high temperatures at Oconaluftee were consistently warmer than at Park Headquarters, but the average low temperatures were quite a bit cooler. This wider diurnal range in the average temperatures would imply that a drier airmass was typically in place across the eastern side of the Smokies (compared to the western side). Also, this wider diurnal range could imply that the Oconaluftee observation site was less sheltered than the Park Headquarter's site, although both are located in wooded areas. The temperature differences observed between Mount LeConte and Park Headquarters (Fig. 7) were similar to the differences observed between Newfound Gap and Park Headquarters. The differences in the average high temperatures were much larger than the differences in the average low temperatures. This again can be attributed to the high frequency of temperature inversions developing in the morning. A calculation of the lapse rates from the Mount LeConte data revealed a similar lapse rate to that seen with the Newfound Gap data. The Park Headquarters/Mount LeConte lapse rates varied from 3.20F per 1000 ft to 4.10F per 1000 ft, when computed from the average high temperatures.
4. Associated Synoptic Weather Patterns
- The primary daily temperature comparison for this study was between the Park Headquarters and Newfound Gap observation sites. This was done to determine the synoptic weather conditions which produced the largest, smallest, and inverted daily temperature differences between the higher elevations and the valleys. The most noticeable pattern that occurred with the greatest predictability was that associated with temperature inversions (when Newfound Gap was warmer than Park Headquarters). Temperature inversions were usually observed during warm air advection patterns when the southern Appalachian region was located on the western side of a high pressure system. This was usually in advance of an approaching cold front over the Mississippi River Valley. The 500 mb flow was typically from the southwest or west. These temperature inversions (with temperature differences usually between 50 and 100F) occurred most frequently during the autumn months, but also occurred during the spring and winter months. Temperature inversions were rare during the summer months, but the few cases observed were usually associated with a stationary front located near the mountains. During the autumn months, temperature inversions also formed after a stagnant high pressure system had remained over the mountains for a few days. This was likely the result of the stagnant airmass modifying over time. Also, a few cases of temperature inversions resulted from an inverted surface trough or easterly flow over the mountains.
- Large daily temperature differences (usually 150 to 200F) between Park Headquarters and Newfound Gap were typically observed during strong cold air advection patterns after a cold front passage with a 500 mb trough moving across the mountains. Small daily temperature differences did not seem to result from any definite or predictable synoptic pattern, but were generally found to occur when extensive cloud cover or a good deal of moisture was present across the area.
5. Conclusions
- In this study, it was found that the seasonally-averaged temperature differences between the mountains (Newfound Gap ~5000 ft MSL) and the valleys (Park Headquarters ~1600 ft MSL) in the Great Smoky Mountains National Park were between 100 and 130F with highs and between 30 and 60F with lows. The differences between high temperatures were similar to the moist adiabatic lapse rate of 3.30F per 1000 ft, while the smaller differences between low temperatures were the result of frequent temperature inversions developing in the morning, especially during autumn. When comparing the seasonally-averaged temperatures from Knoxville McGhee Tyson Airport (the official central east Tennessee observing site) and Park Headquarters, a different pattern emerged: the low temperature differences were much larger than the high temperature differences. This result can be attributed to the heat island effect which has been found to increase minimum temperatures in urbanized areas. The largest average temperature differences between the McGhee Tyson Airport and Park Headquarters were observed during the summer, with the smallest temperature differences observed during the winter. This was likely the result of increased shade and transpiration during the growing season from the surrounding trees at Park Headquarters compared to the airport. The wider diurnal range of average temperatures observed in all seasons at Oconaluftee compared to Park Headquarters indicated that a drier airmass was typically in place across the eastern side of the Smokies (compared to the western side), and that the Oconaluftee site could have been less sheltered than the Park Headquarters site.
- When comparing the daily temperature trends to their associated synoptic weather patterns, the most noticeable pattern that occurred with the greatest predictability was that associated with temperature inversions (when Newfound Gap was 5 to 100F warmer than Park Headquarters). These inversions were found to typically develop during warm air advection patterns when the southern Appalachian region was located on the western side of a high pressure system in advance of an approaching cold front over the Mississippi River Valley. Also, temperature inversions regularly occurred with stagnant high pressure systems. The greatest frequency of inversions was during autumn, but they also occurred regularly during winter and spring. Large daily temperature differences (when Newfound Gap was typically 15 to 200F colder than Park Headquarters) were frequently observed during strong cold air advection patterns after a cold front passage with a 500 mb trough moving across the mountains. Small daily temperature differences between Park Headquarters and Newfound Gap did not seem to result from any definite or predictable synoptic pattern.
Acknowledgments
- The authors would like to thank Jack Ramsden and Clayton Brantley of the National Park Service for providing the GSMNP temperature data used in this study. Also, thanks to Scott Stephens at NCDC for providing the hourly Knoxville McGhee Tyson Airport temperature data, Derek Eisentrout at WFO Morristown for providing information on the stations, and Stephen Parker (Science and Operations Officer at WFO Morristown) for reviewing this manuscript.
References
- Karl, T. R., H. F. Diaz, and G. Kukla, 1988: Urbanization: Its detection and effect in the United States climate record. J. Climate, 1, 1099-1123.
Table 1. Seasonally-averaged temperature differences between GSMNP Headquarters and the five other stations used in the study (March 1991 through February 2001).
| vs. Knoxville McGhee Tyson Airport |
| |
High |
Low |
Average |
| Winter |
1.1 |
-2.9 |
-0.8 |
| Spring |
0.7 |
-5.8 |
-2.5 |
| Summer |
-2.5 |
-6.8 |
-4.7 |
| Autumn |
-0.3 |
-5.2 |
-2.7 |
| vs. Newfound Gap |
| |
High |
Low |
Average |
| Winter |
10.3 |
4.4 |
7.4 |
| Spring |
13.3 |
4.8 |
9.1 |
| Summer |
13.0 |
5.9 |
9.5 |
| Autumn |
12.8 |
2.9 |
7.8 |
| vs. Cades Cove |
| |
High |
Low |
Average |
| Winter |
0.6 |
-0.1 |
0.3 |
| Spring |
0.9 |
-0.9 |
0.0 |
| Summer |
1.9 |
0.0 |
0.9 |
| Autumn |
1.9 |
-0.6 |
0.7 |
| vs. Oconaluftee |
| |
High |
Low |
Average |
| Winter |
-0.9 |
4.3 |
1.7 |
| Spring |
-0.3 |
3.6 |
1.7 |
| Summer |
-1.2 |
4.4 |
1.6 |
| Autumn |
-1.5 |
5.3 |
2.0 |
| vs. Mount LeConte |
| |
High |
Low |
Average |
| Winter |
15.4 |
8.0 |
11.7 |
| Spring |
19.4 |
10.2 |
14.8 |
| Summer |
17.6 |
12.5 |
15.0 |
| Autumn |
15.9 |
8.6 |
12.2 |
