August 19, 2026: Widespread Strong to Severe Winds and
Dust Storm in the Phoenix Area
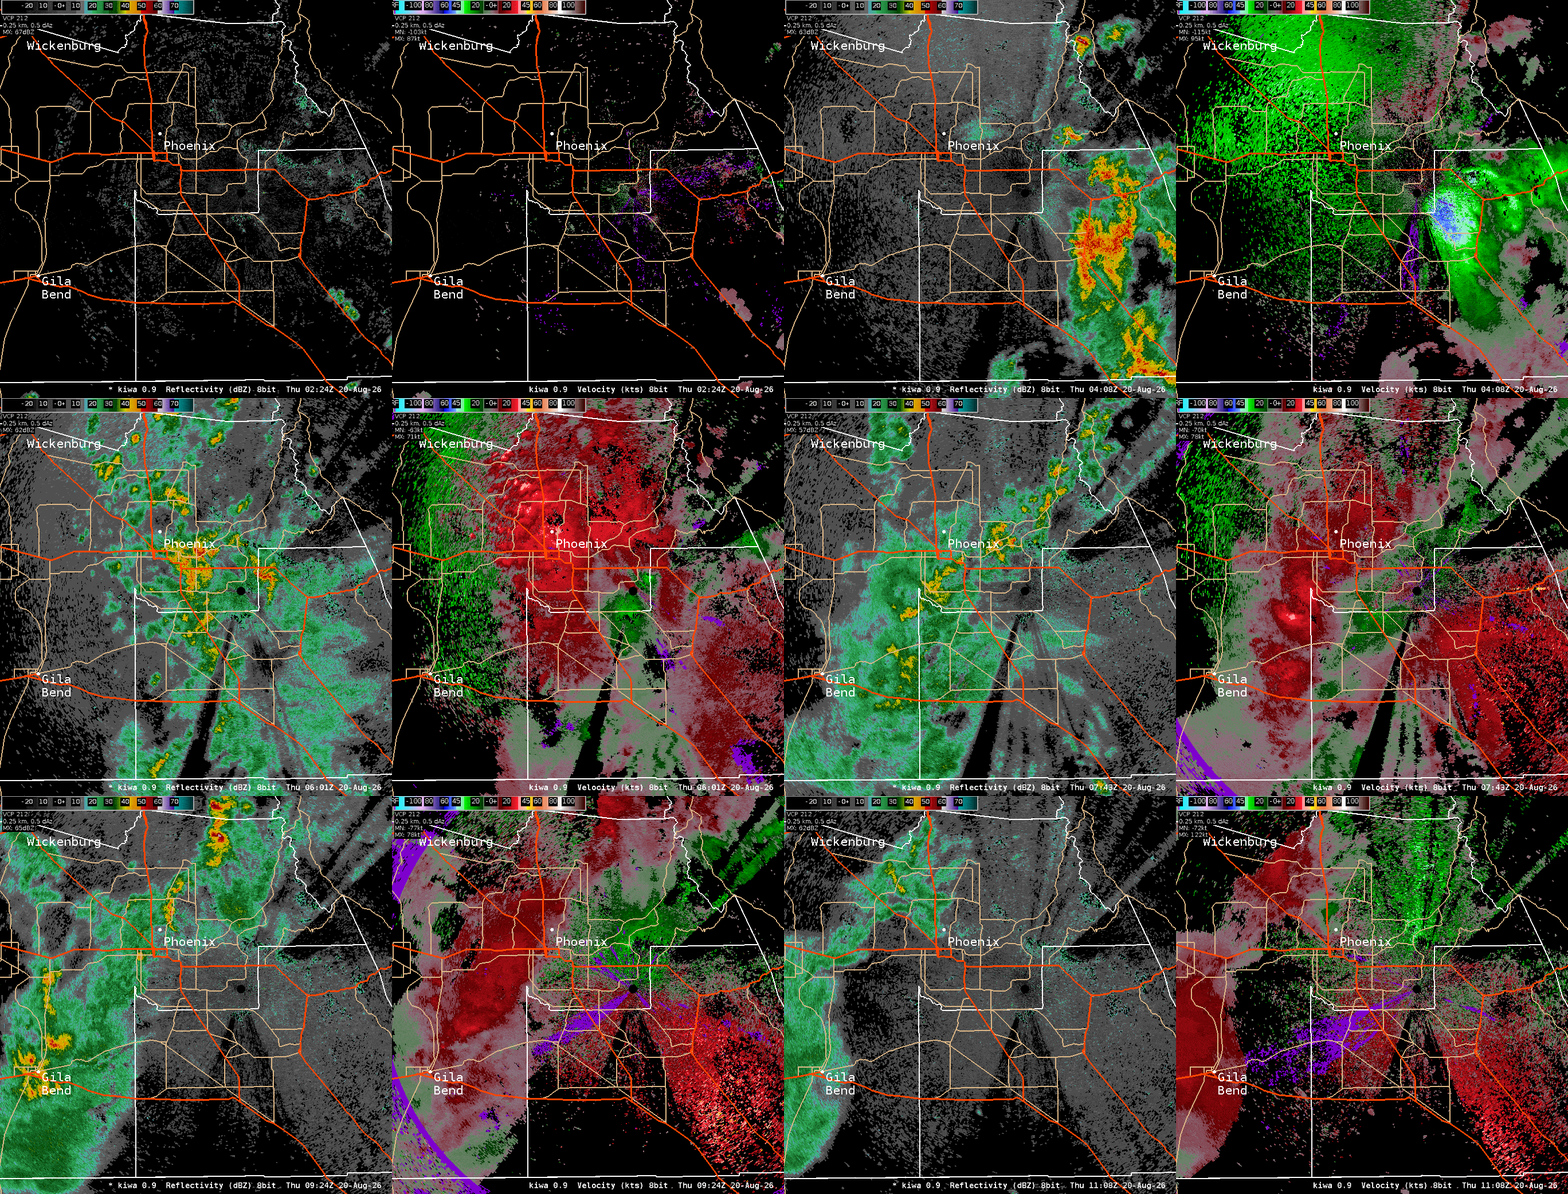
Fig. 1-2: Reflectivity loop (left) and velocity loop (right) between 7:24 PM MST August 19, 2026 and 4:08 AM MST August 20, 2026 from the KIWA (Phoenix, AZ) radar. The loop shows the strong to severe thunderstorm cluster as it developed east and southeast of the Phoenix metro, the progression of an outflow boundary that drove the severe-level winds across the area, and the subsequent shower and thunderstorm development along and behind the boundary.
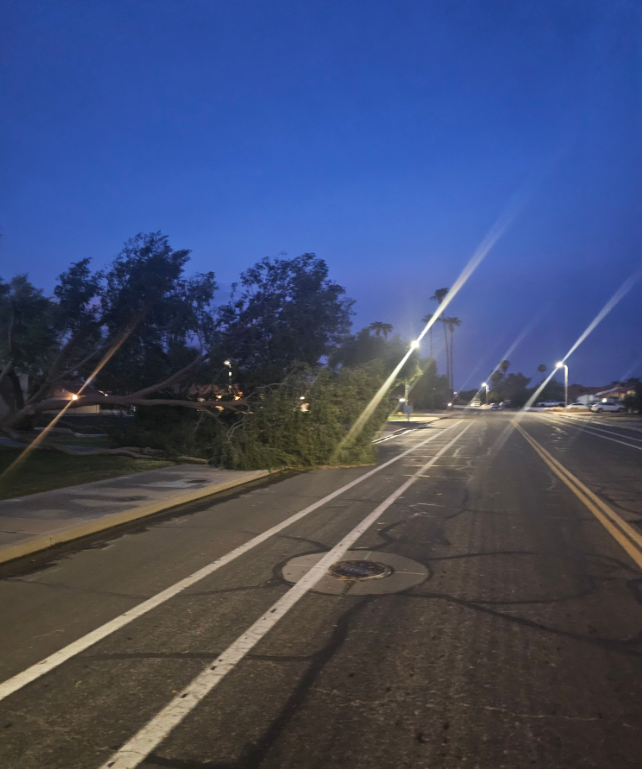
During the evening hours of Wednesday, August 19, a large cluster of strong to severe thunderstorms developed to the east and southeast of the Greater Phoenix Metropolitan Area. This thunderstorm complex generated a large outflow boundary that propagated west-northwestward across the entire Phoenix area. The boundary produced a widespread swath of damaging straight-line wind gusts ranging mainly between 55 to 65 mph, as detected by the Phoenix Doppler Radar (KIWA) (Fig. 1-2) and measured by surface weather stations. Additionally, the outflow boundary generated a significant dust storm, reducing visibility to less than one mile across multiple locations. There were even some areas, as evidenced by the webcams operated by the Arizona Department of Transportation, that had visibility drop under a quarter-mile, particularly in the Phoenix East Valley (Fig. 3). As the outflow boundary advanced through the Phoenix metropolitan area, additional showers and thunderstorms developed along and behind it, with the greatest coverage and highest rainfall totals occurring primarily in the Central and East Valley. Rain gauge data from the Flood Control District of Maricopa County indicated total accumulations ranging between 0.50” to as much as 1.30”, with Phoenix Sky Harbor International Airport recording 0.56” (Fig. 4). Due to wind gusts exceeding 60 mph, multiple reports of storm damage were received, which predominantly consisted of downed or damaged trees (Fig. 5-6). Partial structural roof damage was also reported in localized areas, with the most severe impact observed at Marcos De Niza High School in Tempe, where several roof sections sustained damage (Fig. 7-8).

Fig. 3: Arizona Department of Transportation webcam showing the reduced visibility due to dense blowing dust along Loop 202 and Power Road in East Mesa.

Fig. 4: Measured station rainfall totals overlaid on top of radar estimated rainfall from the night of August 19th, courtesy of the Flood Control District of Maricopa County. (Click on map for higher resolution)
 |
 |
Fig. 5-6: Images of some of the tree damage. Left image: large uprooted tree near the area of Dobson and Warner Road in Chandler (image credit: @bucks2028 on X). Right image: large tree branch snapped and fell onto a carport causing damage inside an apartment complex located in the area of North 7th Street and Bell Road in Phoenix (image credit: @SouthwestWX on X).
 |
 |
Fig. 7-8: Images of roof damage at Marcos De Niza High School in Tempe (footage credit:12News).
Environmental Setup:
Environmental conditions were highly conducive for severe convective activity across the Greater Phoenix Metropolitan Area, as evidenced by a weather balloon release from the NWS Phoenix office at 5 PM MST (Fig.9). Atmospheric instability was on the high side, characterized by a Mixed-Layer Convective Available Potential Energy (MLCAPE) value around 1700 J/kg. Downdraft CAPE (DCAPE) was similarly elevated at 1700 J/kg, which favored an environment conducive for severe and damaging surface wind gusts. Given the favorable environmental setup in place, the Storm Prediction Center in Norman, OK, in coordination with the NWS Forecast Offices in Phoenix, Tucson, and Flagstaff, issued a Severe Thunderstorm Watch for much of south-central and southeastern Arizona by the early afternoon hours (Fig. 10).

Fig. 9: A technical schematic of weather data, or sounding, obtained from a weather balloon released at 5 PM MST on August 19, 2026 from the NWS Phoenix Office. The data reflected a highly unstable air mass along with a dry low-level atmospheric layer, which signaled the potential for very strong thunderstorm winds.

Fig. 10: Severe Thunderstorm Watch issued by the Storm Prediction Center, covering south-central and southeastern AZ.



 Follow us on X
 Follow us on Facebook
 Follow us on YouTube
 PSR RSS Feed