Halloween Weekend Major Rainfall and Flooding
 |
Fig. 1: Water Vapor Satellite Imagery between 11 PM MST Oct. 29 and 11 PM MST Nov. 1, 2026 showing the weather systems moving through the Desert Southwest
Between October 30 and November 1, the Desert Southwest was impacted by two weather systems, resulting in widespread, significant rainfall as well as isolated strong thunderstorms (Fig. 1). The initial weather system on October 30th was predominantly convective, producing isolated strong thunderstorms characterized by high rainfall rates, marginally large hail, and localized damaging winds. The subsequent system, which traversed the region from October 31st to November 1st, produced more substantial and widespread rainfall totals. This resulted in significant hydrological impacts, including widespread flooding from overflowing washes, streams, creeks, and rivers. The flooding persisted for several days thereafter as elevated flows continued in the affected waterways.
The initial weather system, which affected much of central Arizona on October 30th, was associated with an upper-level low-pressure system that traversed from the eastern Pacific into the region. This system interacted with highly anomalous low-level atmospheric moisture, evidenced by precipitable water values (a measure of the amount of atmospheric moisture) ranging between 1.0 and 1.3”, generating successive waves of showers and thunderstorms from the early morning through the evening hours (Fig. 2-3). The combination of very cold 500 mb temperatures (ranging from -13°C to -14°C) and the abundant low-level moisture induced moderate atmospheric instability, with Mixed-Layer Convective Available Potential Energy (MLCAPE) values peaking between 500 and 1000 J/kg (Fig. 4-5). Moderately strong vertical wind shear of 30 to 40 knots further facilitated the development of organized convective storms, the strongest of which produced marginally large hail and localized damaging winds (Fig. 6-8). Given the available instability, elevated rainfall rates exceeding 1 to 2” per hour were observed. Rapid storm motion reduced residence times over specific locations, thereby limiting the overall coverage of flood impacts. A notable exception occurred in the Scottsdale area, where a training band of thunderstorms during the early evening hours produced localized rainfall totals exceeding 2” in under 3 hours, resulting in flash flooding across portions of the city (Fig. 9-10). Emergency personnel executed a significant water rescue involving two vehicles trapped in the floodwaters along a wash, safely rescuing six individuals (Fig. 11). A separate water rescue involving two additional vehicles was performed at a low-water crossing along Indian Bend Wash (Fig. 12).
 |
Fig. 2: Animated loop of precipitable water values between 11 PM MST Oct. 29 and 11 PM MST Nov. 1, 2026.
 |
Fig. 3: Radar Mosaic between 5 AM MST Oct. 30 and 2 AM MST Oct. 31, 2026 showing the waves of showers and thunderstorms affecting much of central AZ.
 |
Fig. 4: 500 mb heights, temperatures, and winds at 11 AM MST on Oct. 30, 2026.
 |
Fig. 5: Animated loop of the Mixed Layer Convective Available Potential Energy (MLCAPE) and Mixed Layer Convective Inhibition (MLCIN) between 11 PM MST Oct 29. and 11 PM MST Nov. 1, 2026.
 |
Fig. 6: Surface to 6 km wind shear at 11 AM MST Oct. 30, 2026
 |
 |
Fig. 7-8: Images of the hail and wind impacts. Left image: Nickel to quarter-sized hail in Goodyear (image credit: Carrie J Hovatter on Facebook). Right image: Screenshot of the knocked down power poles along Shea Boulevard in Scottsdale (image credit: Arizona Public Service).
 |
 |
Fig. 9-10: Top image: Radar loop of the storm affecting Scottsdale between 5 PM MST and 9 PM MST on Oct. 30, 2026. Bottom Image: 3-hr observed rainfall totals between 5:30 PM MST and 8:30 PM MST on Oct. 30, 2026 showing rainfall amounts exceeding 2” across portions of the Scottsdale area (image credit: Flood Control District of Maricopa County). (Click on rainfall map for higher resolution version)
 |
 |
Fig. 11-12: Images of water rescues in Scottsdale due to flooding. Left image: Water rescue near the area of 40th street and Camelback Road (image credit: Phoenix Fire Department). Right image: Water rescue near the area of McCormick Parkway and Hayden Road (image credit: FOX10 Phoenix).
As shower and thunderstorm activity dissipated during the late evening hours with the upper-level system departing the region, total accumulated rainfall averaged between 0.10 and 0.75” across lower desert areas, and between 1.00 to 2.00” in the upslope terrain areas north and east of the Phoenix metropolitan area, with locally higher totals associated with persistent convective bands (Fig. 13-14). Although rainfall totals were consistent with typical convective events, the soils became sufficiently saturated to set the stage for the next system that would bring more widespread hydrological impacts less than 24 hours later.
 |
 |
Fig. 13-14: Observed rainfall totals for Oct. 30, 2026, shown for central AZ (top image) and for the Phoenix Metro Area (bottom image). (Click on images for higher resolution versions)
The second, significantly more impactful weather system affected much of Arizona beginning on the afternoon of October 31st and persisting through the late evening hours of November 1st. A potent atmospheric river, defined as an elongated corridor of high moisture content, was funneled into the region out ahead of an upper-level low pressure system off the West Coast (Fig. 15). As the atmospheric river moved inland across the northern Baja Peninsula into Arizona, widespread rain developed across much of the state, persisting for 12 to 18 hours (Fig. 16). Precipitable water values associated with this system exceeded 300% of normal and was a record for late October and early November, with values peaking above 1.5” across central and southern Arizona (Fig. 2). Although hourly rainfall rates peaked at 0.5” per hour, the prolonged duration of the event yielded substantial amounts. Widespread totals ranged from 1 to 2” across the lower deserts to 3 to 6”, locally higher, over much of the higher terrain areas (Fig. 17).
 |
Fig. 15: Animation loop of Total Precipitable Water between 11 PM MST Oct. 29 and 11 PM MST Nov. 2, 2026. Note the narrow plume of higher precipitable water (yellow and red colors) associated with the atmospheric river directly aimed towards the northern Baja Peninsula and Arizona Oct 31-Nov 1.
 |
Fig. 16: Radar Mosaic between 12 PM MST Oct. 31 and 3 AM MST Nov. 2, 2026 showing the widespread prolonged rainfall activity affecting much of AZ.
 |
Fig. 17: 48-hour preliminary rainfall totals between 5 AM MST Oct. 31 and 5 AM MST Nov. 2, 2026.
This amount of rain, falling upon already saturated soils by the rainfall that occurred 24 to 48 hours earlier, overwhelmed several major waterways. Gauges recorded water levels across numerous washes, creeks, and rivers surpassing alarm stage, with multiple rivers cresting at minor to moderate flood stage, the San Carlos River notably reaching major flood stage, and U.S. Geological Survey (USGS) sites along the Salt River upstream of Roosevelt Lake surpassing previous record crests (Fig. 18-23). Consequently, numerous low-water crossings and structures located near the riverbeds were inundated (Fig. 24-25). The significant rises along major waterways also necessitated mandatory evacuations across some areas. The extensive runoff prompted the Salt River Project (SRP) to initiate water releases exceeding 50,000 cfs from Bartlett Dam on the Verde River and Granite Reef Diversion Dam on the Salt River (Fig. 26-27). These releases resulted in substantially elevated flows within the typically dry Salt and Gila River channels traversing the Phoenix metropolitan area, with low-water crossings becoming fully inundated (Fig. 28-29).
 |
 |
 |
 |
 |
 |
Fig. 18-23: Hydrographs showing the water levels across select river gauges.
 |
 |
Fig. 24-25: Images of the flooding. Left image: River flooding along the San Carlos River at San Carlos, AZ (image credit: Bob Stevens on Facebook). Right image: Flooding from Bloody Tanks Wash near the area of Highway U.S. 60 and Forest Avenue in Miami, AZ (image credit: Natalie Perkins on Facebook).
 |
 |
Fig. 26-27: Hydrographs courtesy of Salt River Project (SRP) showing the flow in cfs along the Verde River below Bartlett Dam (top image) and Verde River near the confluence with the Salt River (bottom image).
 |
 |
Fig. 28-29: Elevated water flows along the Salt and Gila Rivers from upstream dam releases. Top image: Water along the Salt River rushing out of Tempe Town Lake in Tempe (image credit: Alex Hager from KJZZ news radio). Bottom image: Flows along the Gila River inundating a couple of low-water crossings in Avondale (image credit: Joshua Coghill on Facebook).
Messaging
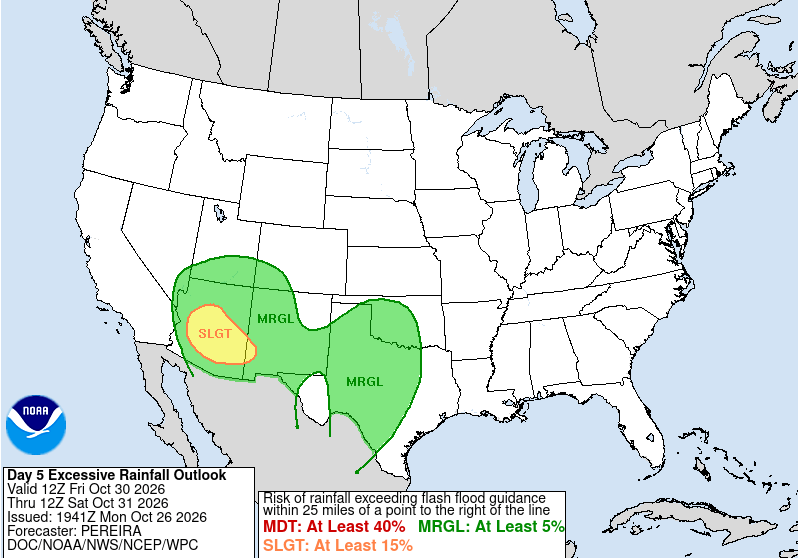
Long-range model guidance was already in strong agreement showing the potential for significant rainfall across the region from the October 30th and October 31st-November 1st systems, and so messaging began to highlight the threat as early as Monday, October 26th (Fig. 30). In addition, the Weather Prediction Center (WPC) in its Day 5 Excessive Rainfall Outlook issued a slight risk of excessive rainfall leading to flooding for both systems (Fig. 31-32). A more detailed graphic showcasing rainfall probabilities, timing, and impacts was produced and posted on October 27th (Fig. 33).
 |
Fig. 30: Weather story graphic published on Oct. 26, 2026 highlighting the potential for significant rainfall
 |
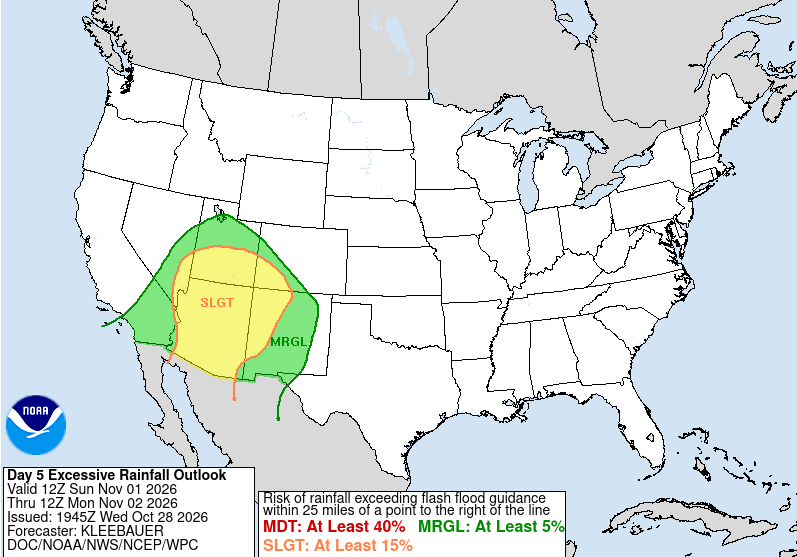 |
Fig. 31-32: Weather Prediction Day 5 Excessive Rainfall Outlook Graphics. Left Image: Day 5 Excessive Rainfall Outlook Issued on October 26 for October 30. Right Image: Day 5 Excessive Rainfall Outlook Issued on October 28 for November 1.
 |
Fig. 33: Weather story graphic published on Oct. 27, 2026 providing more detailed information on rain chances, timing, and overall impacts.
In anticipation of the excessive rainfall and in coordination with the neighboring weather forecast offices, Flood Watches were hoisted for much of central AZ for the initial October 30th system followed quickly by additional Flood Watches across much of the state for the second, more significant system on October 31st-November 1st (Fig. 34-35). Around this time, WPC also upgraded their Excessive Rainfall Outlook to a moderate risk for much of the higher terrain areas to the north and east of the Phoenix Metro area (Fig. 36). Due to enough instability and strong vertical shear present, the Storm Prediction Center issued a marginal risk for severe thunderstorms for both systems (Fig. 37-38). In total, 32 Flash Flood Warnings and 62 Flood Warnings, including river flood warnings, were issued across Arizona during the four-day period from October 30th-November 2nd (Fig. 39-40). Similar to significant events in the past that resulted in widespread impacts, a live webinar was hosted for emergency management personnel on October 29th to provide detailed information on the overall threats associated with these weather systems. This enabled emergency managers to make informed decisions and pre-position key resources with several counties as well as the state activating their Emergency Operations Centers to assist with response and recovery efforts. To further facilitate these efforts, a state of emergency was declared by Governor Hobbs on November 2nd.
 |
 |
Fig. 34-35: Flood Watches issued for the Oct. 30, 2026 system (top image) and Oct. 31-Nov. 1, 2026 system (bottom image).
 |
Fig. 36: Excessive Rainfall Outlook Graphic highlighting the moderate risk issued for the higher terrain areas north and east of the Phoenix Metro Area for Nov. 1, 2026.
 |
 |
Fig. 37-38: Marginal severe thunderstorm risks issued for Oct. 30, 2026 (top image) and Nov. 1, 2026 (bottom image).
 |
 |
Fig. 39-40: Flash Flood Warnings (left image) and Flood Warnings (right image) issued for Arizona for the four-day period between Oct. 30-Nov. 2, 2026. (Click on images for higher resolution versions)
 |
Fig. 41: Preliminary local storm reports issued for the four-day period between Oct. 30-Nov. 2, 2026.



 Follow us on X
 Follow us on Facebook
 Follow us on YouTube
 PSR RSS Feed