Preliminary Storm Report for Impacts Related to Former Hurricane Rosa on 30 Sep to 2 October 2018
By NWS Phoenix -- last updated at 11AM on 3 October 2018
For many days, meteorologists with the National Weather Service closely watched as Hurricane Rosa formed in the East Pacific. At its peak, the storm reached Category 4 status. Weather models a week out projected the potential for the remnant moisture from Rosa to move into the Southwest US. This was due to the possible interaction of the tropical system with a much larger low pressure system off the California coast. As the event drew closer, forecasts came into focus that yes, the moisture would move northward and likely lead to significant rainfall.
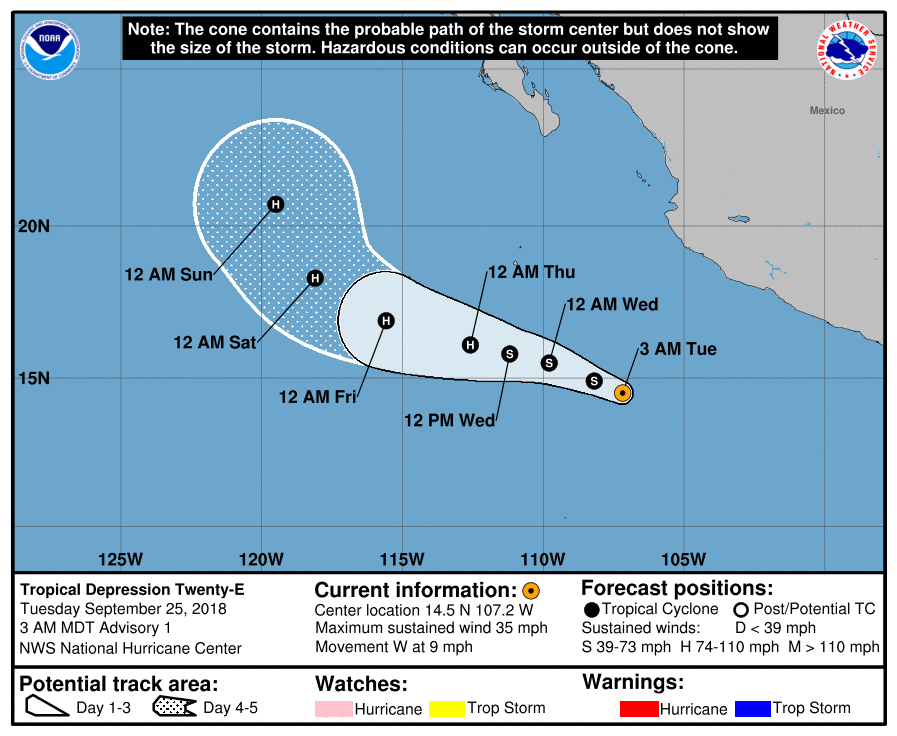
Historical NHC Forecast Tracks for Rosa. Additional Graphics Available Here.
Strong thunderstorms developed late in the morning of Sunday 30 September 2018 across parts of southeast California and southwest Arizona, well ahead of the remnants of Rosa. This caused localized damage in the Yuma area with more widespread flooding reported. Widespread light to moderate rainfall then spread further north into Arizona during the nighttime hours.
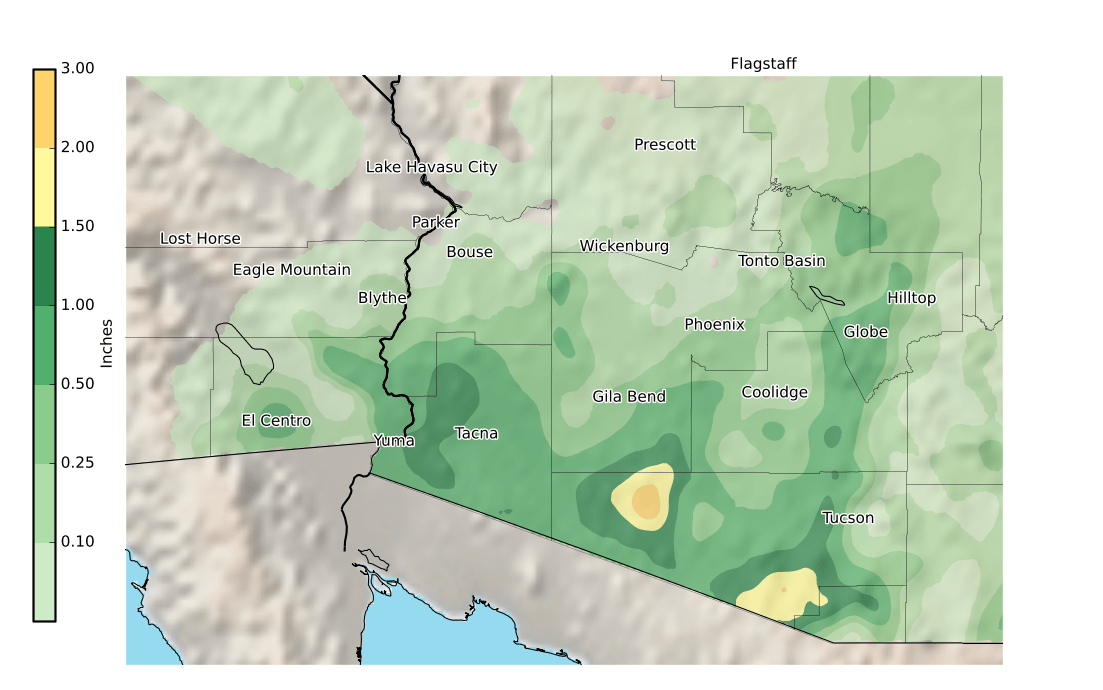
Approximate rainfall amounts from Round 1, Sunday 30 Sep 2018 into early Monday 1 Oct 2018.
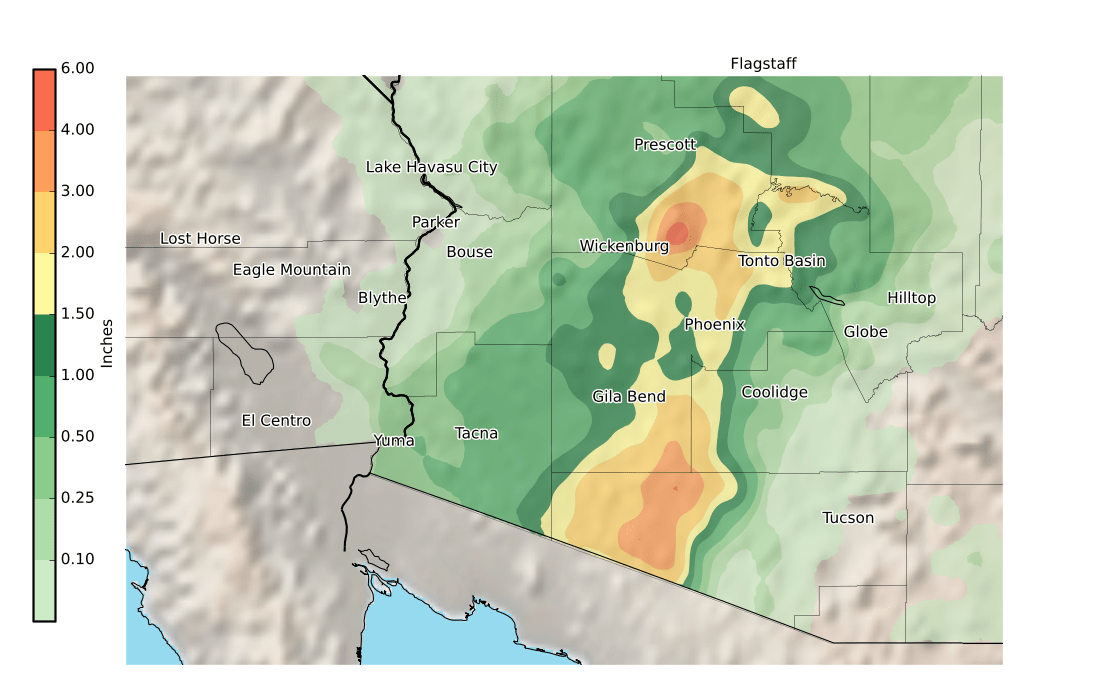
Approximate rainfall amounts from Round 2, late Monday 1 Oct 2018 through Tuesday 2 Oct 2018.
A lull in the action occurred for much of Monday as the circulation of Rosa continued to weaken well to the south. By that evening though, there were indications that the widespread rain was developing and poised to move northward. As Monday night progressed, a broad shield of moderate rain developed and slowly moved northward through Arizona. By daybreak, most locations were seeing rainfall including much of the Phoenix area. The persistent widespread moderate to heavy rain quickly overwhelmed urban drainage systems, causing numerous roads to be closed. Likewise, nature's drainage system sprung into action, with most creeks and washes flowing by mid morning. The timing coincided with the usual morning rush hour traffic, leading to several water rescues. Numerous reports can be found here.
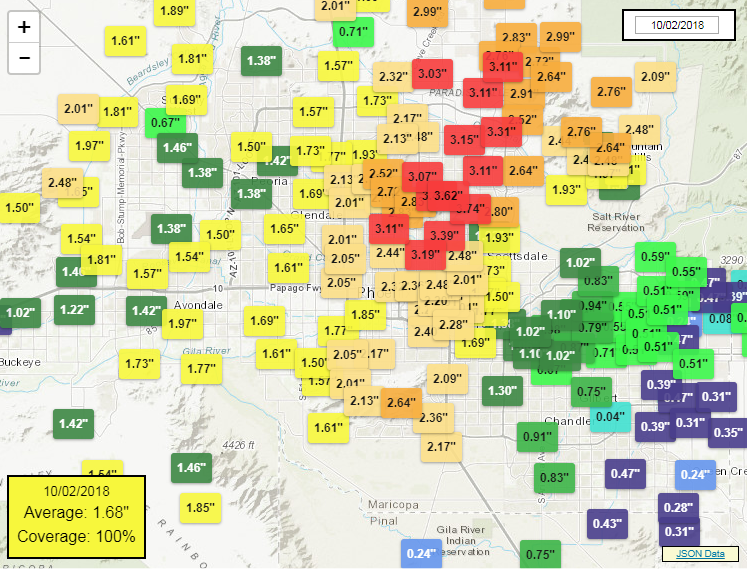
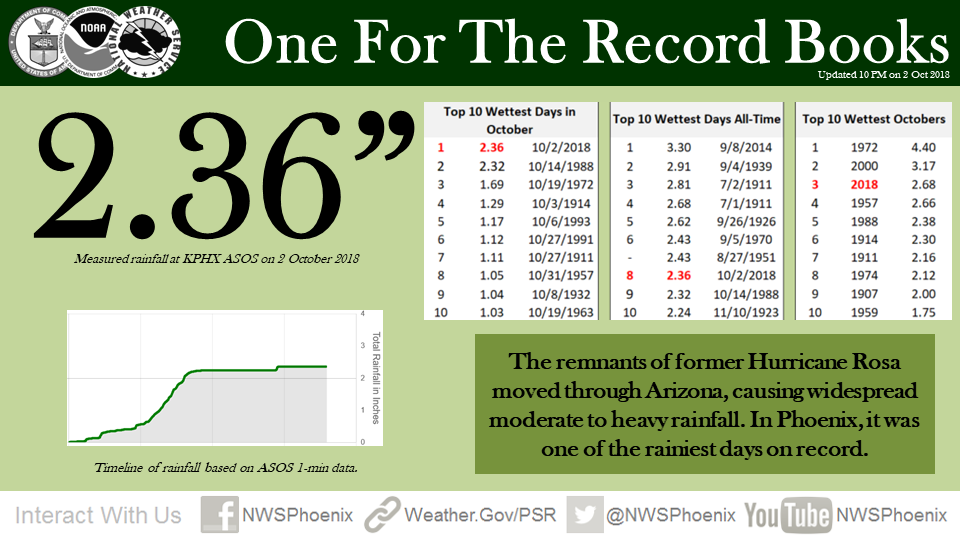
Phoenix Rainfall Index for 2 October 2018.
When all was said and done, widespread rain amounts of 1 to 3 inches were measured in central Arizona. Lesser amounts were noted in the far East Valley with higher amounts in the Northeast Valley. At Sky Harbor Airport, where the official rain gauge for Phoenix is located, 2.36" of rain fell on the calendar day of 2 Oct 2018. This easily broke the record for the day of 0.60" set in 1981. Not only that, it was enough to be the wettest October day ever (behind 2.32" on 14 Oct 1988) and even the 8th wettest day ever. (Daily records for Phoenix date back to August 1895.) Using the Phoenix Rainfall Index, the Valley-wide average of 1.68" was the 2nd wettest day since 1990.
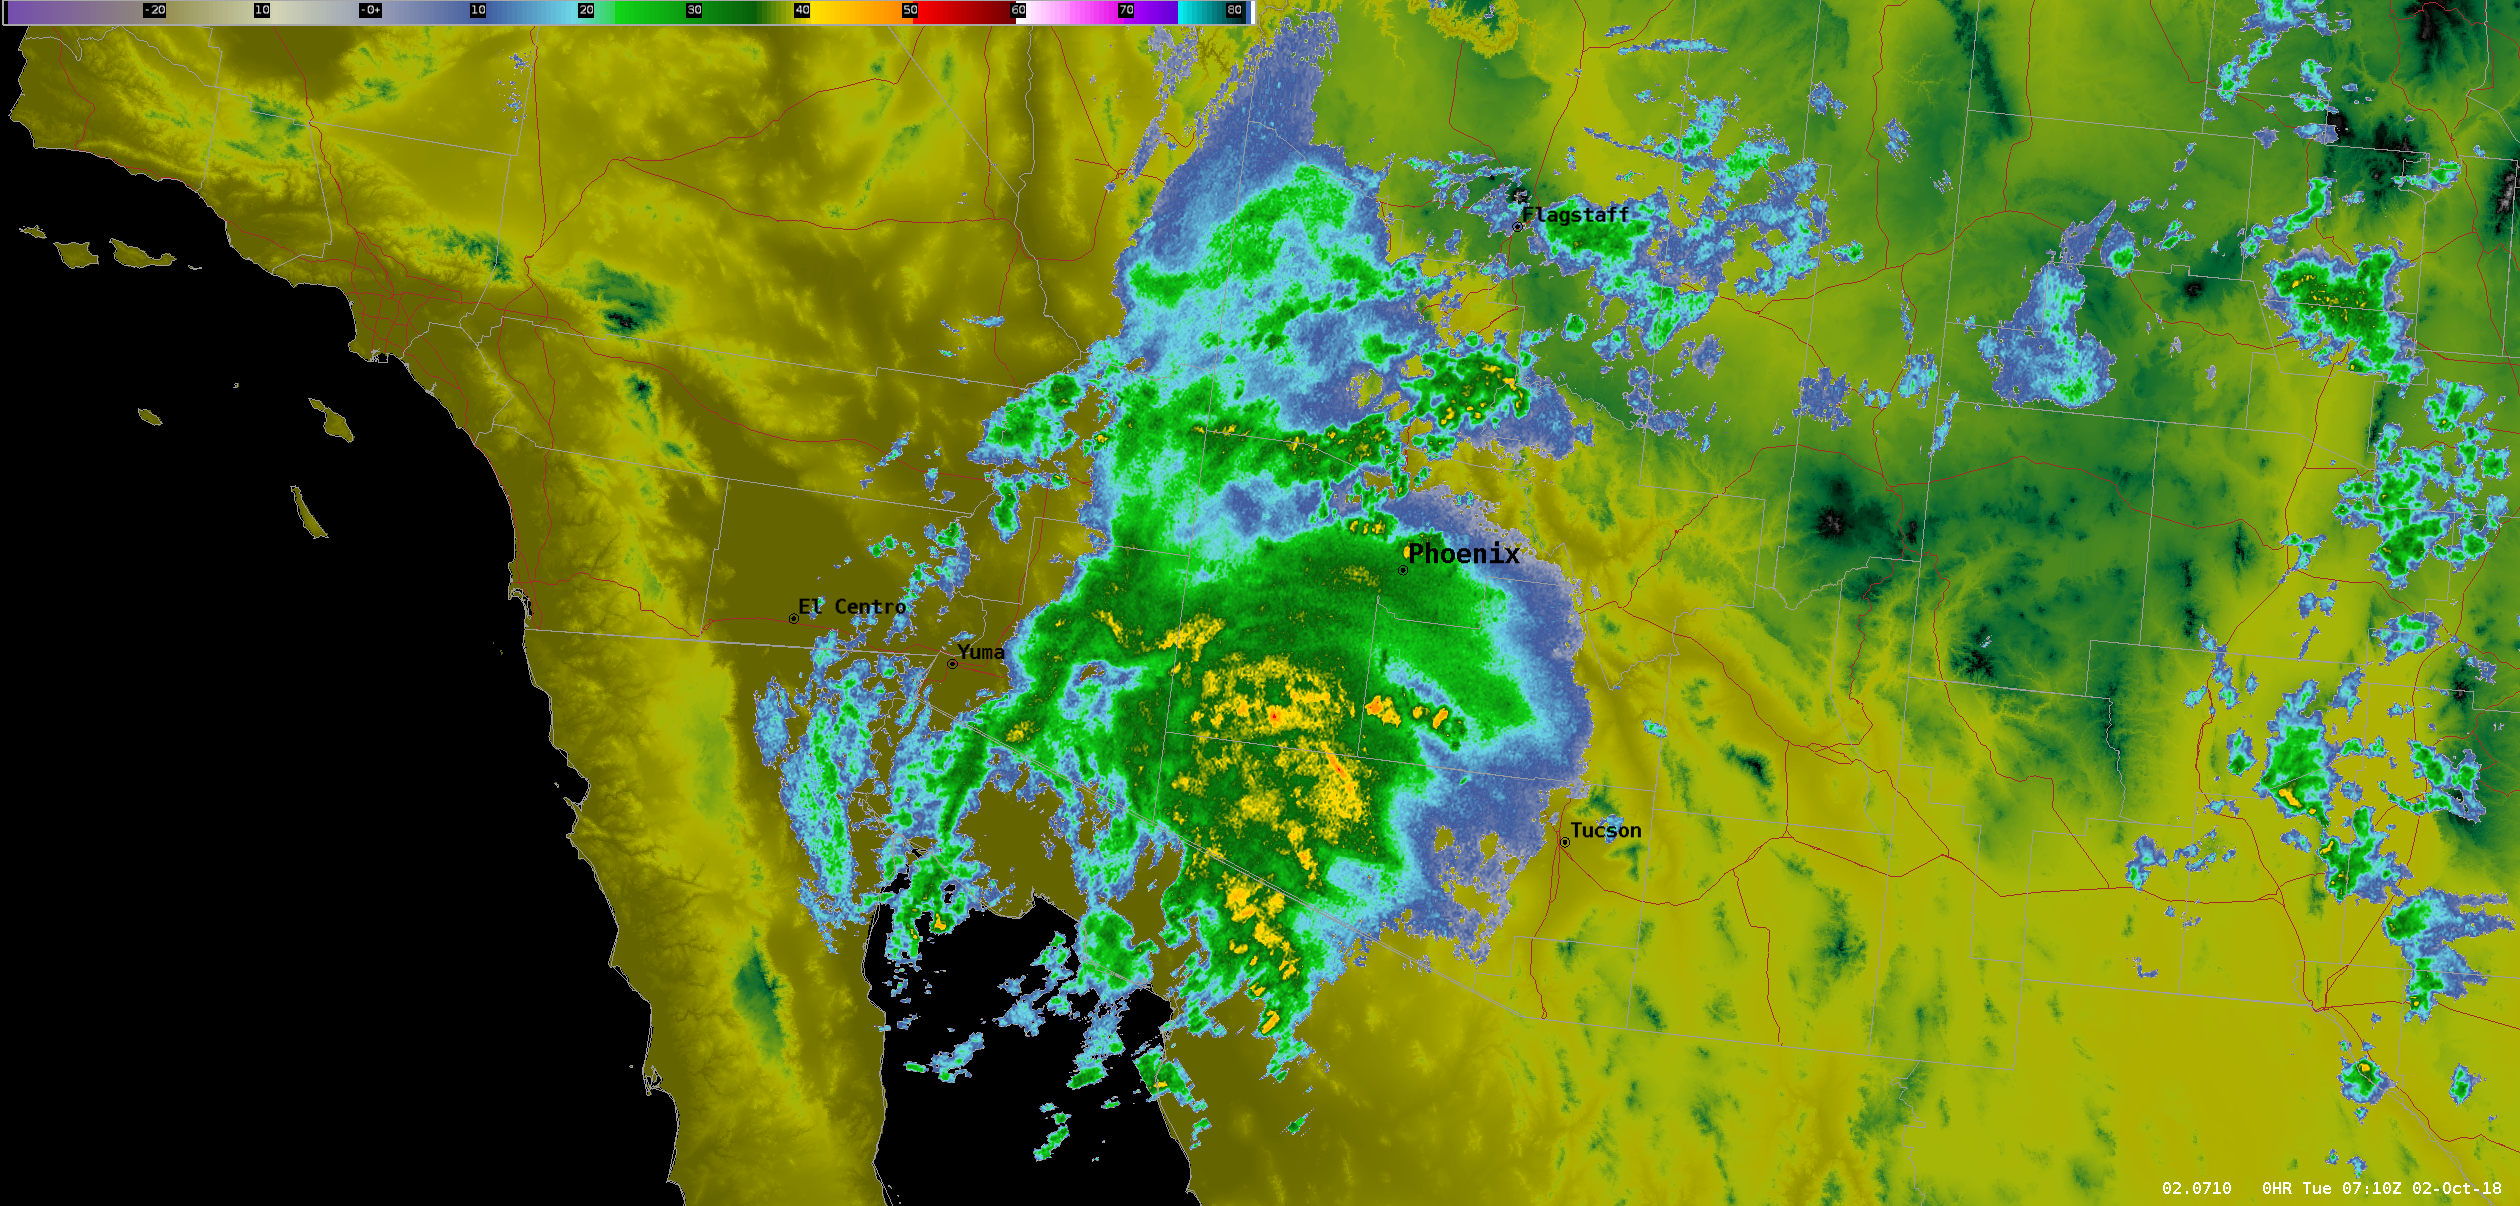
Radar image at 12 AM on Tue 2 Oct 2018. Click image for full event loop.

Total precipitable water. Click on image for loop (45MB).
.png)
IR Satellite Image from GOES-16 of Hurricane Rosa at 430PM on Sat 29 Sep 2018. Click image for full animation.
Click here for a zoomed-in version.
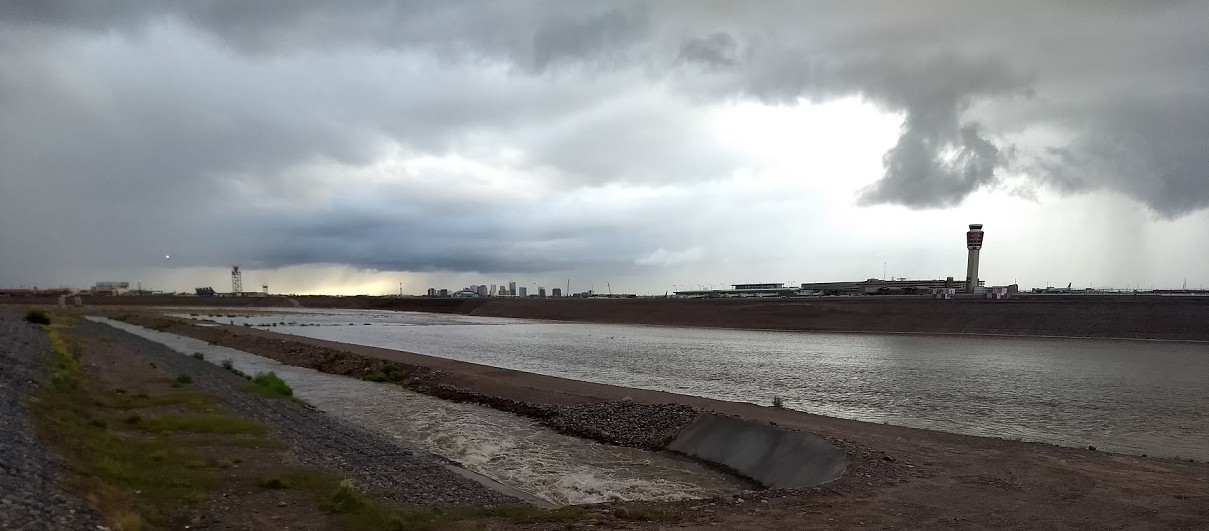
Water flowing through the Salt River near Phoenix Sky Harbor Airport at 5 PM on 2 Oct 2018.
Peak flow was approximately 8,000 cfs, which is the highest flow since January 2010.
Timeline of NWS Phoenix Services

