Storm Report for October 15 - 16, 2022
Last updated at 645 PM on November 19, 2022
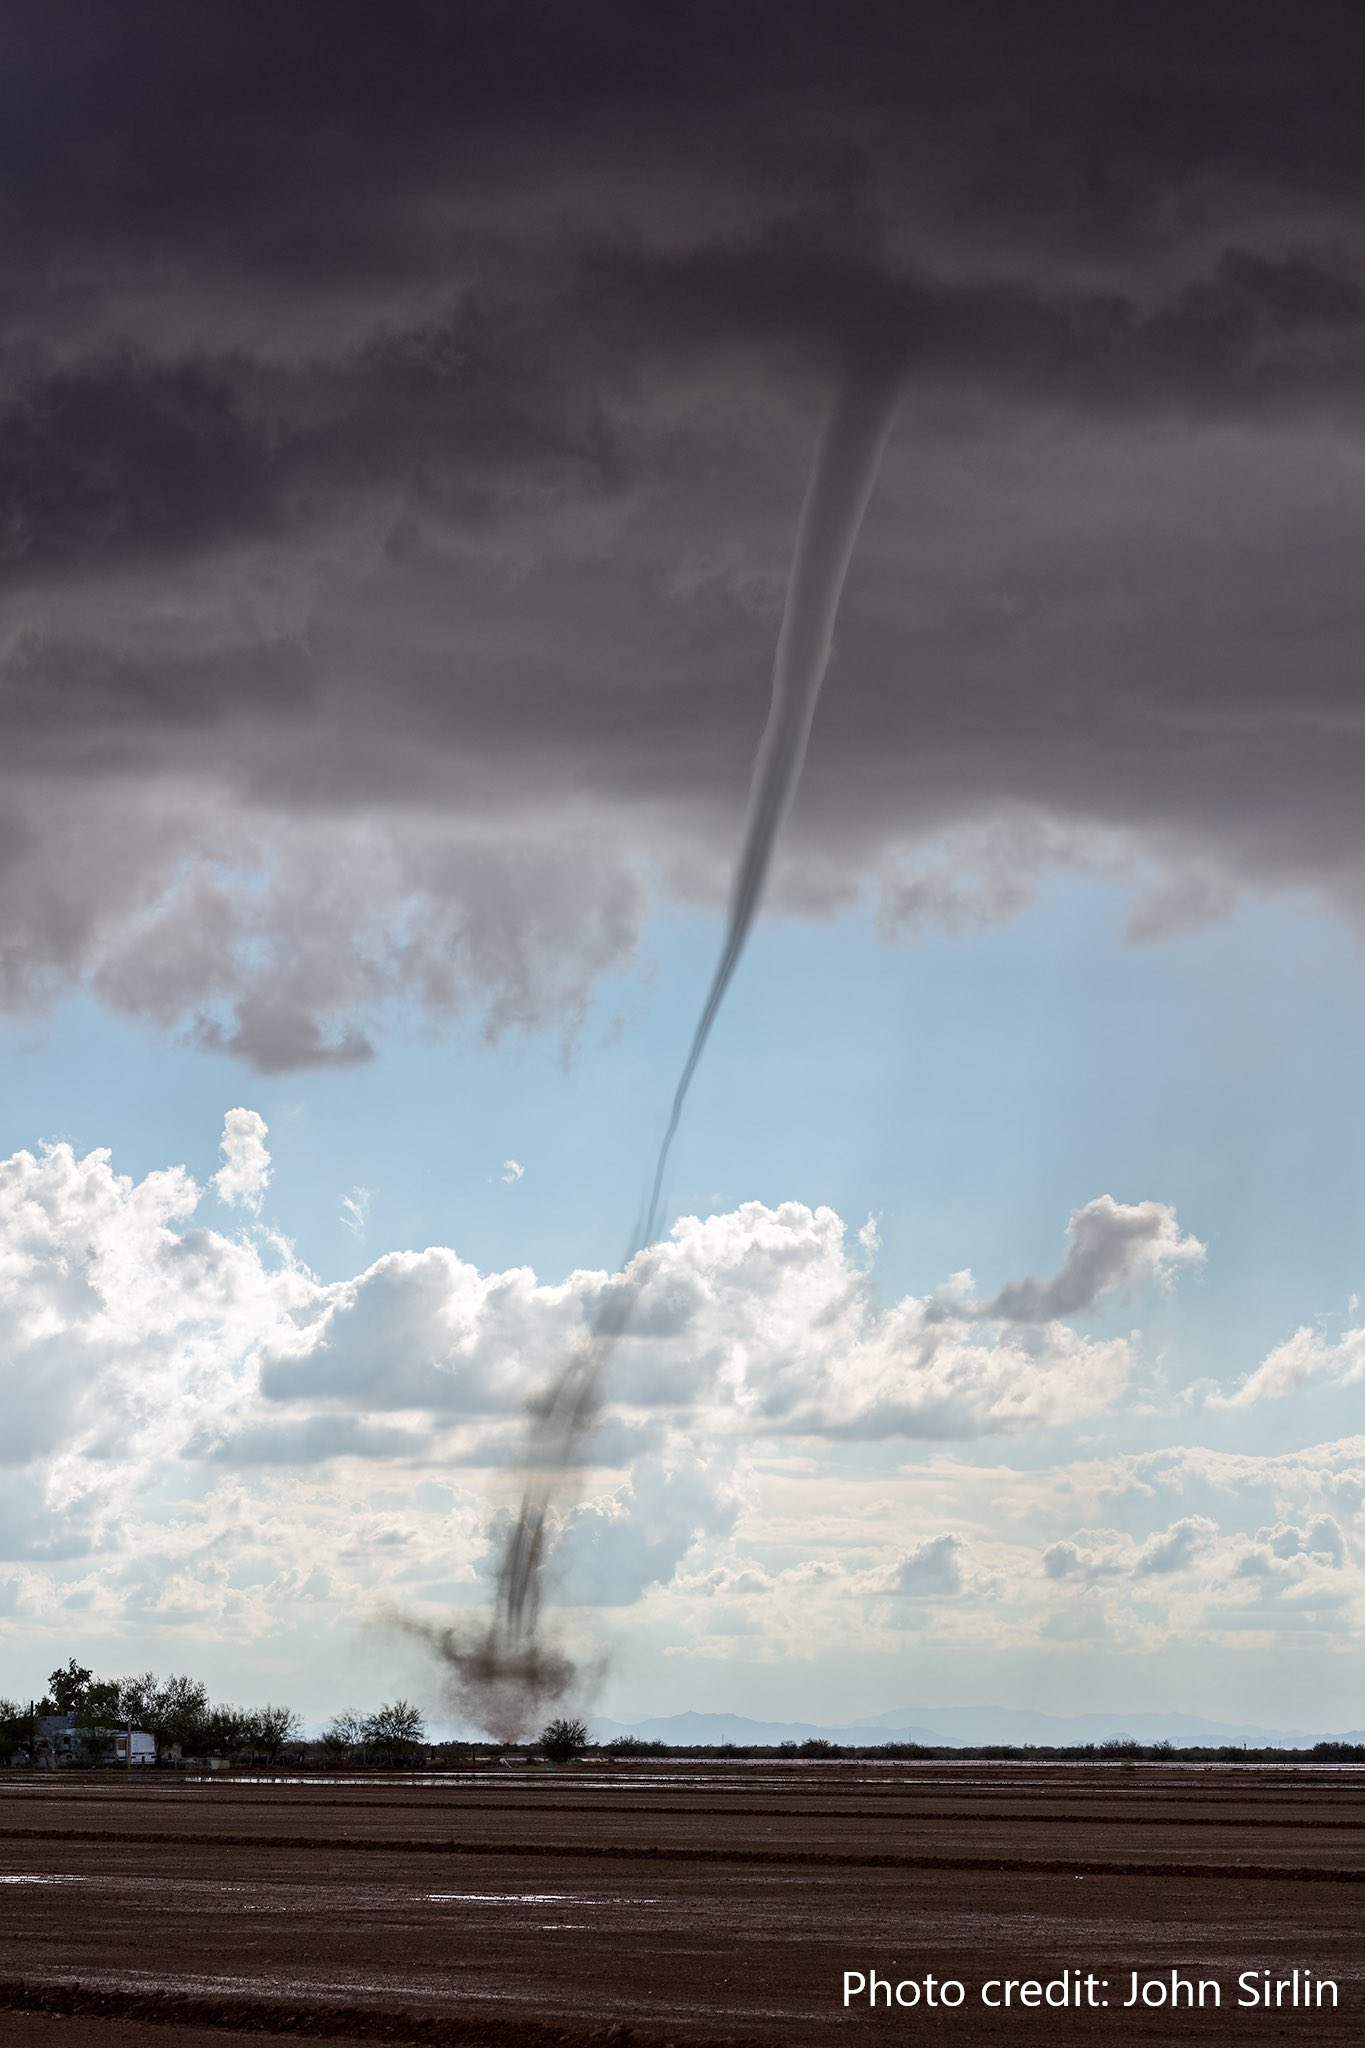
Impacts: Scattered to widespread strong and severe thunderstorms produced flash flooding, large hail, destructive winds, and even a landspout tornado.
|
|
|
|
Fig. 1-2. Landspout that developed in the Sun Lakes, AZ area (photo credit: John Sirlin)(left). Lime-sized (2” diameter) hail stone measured in Scottsdale, AZ (photo credit: @DamasceneMoment on Twitter)(right) |
|
Overview: A slow-moving low pressure system brought several rounds of showers and thunderstorms to Southern Arizona and Southern California during the weekend of October 15 - 16, 2022 (Figure 3). Most of the rain fell on Saturday the 15th, beginning around daybreak and continuing all the way through late Saturday night before coverage decreased and shifted more to the high terrain east of Phoenix. The low was still close by through Sunday the 16th and there was enough moisture for additional showers and thunderstorms to develop over the South-Central Arizona lower deserts through the day. The thunderstorms through the 15th produced scattered flash flooding across Southeast California and areas generally north of I-8 in Southern Arizona, with rainfall amounts as high as 3 to 4”. Many thunderstorms on the 15th became strong to severe as well, with damaging winds and large hail. On the 16th, a landspout tornado briefly touched down just south of the Phoenix metro area (Figure 1).
|
|
|
Fig. 3. GOES-16 Water Vapor (mid level) satellite image between 12 AM MST Oct 15 and 10 PM MST Oct. 16, 2022. |
Flash Flooding: Following a dry period, anomalous subtropical moisture rapidly surged northward Friday night into Saturday. Precipitable water (PWAT), a measure of the amount of atmospheric water vapor in a vertical column of air, rose by 0.5-0.7” in less than 24 hours and reached 200-250% of normal for the time of year with magnitudes peaking around 1.1-1.4” during the weekend. These magnitudes are even slightly above normal for the middle of the monsoon. Pairing this anomalous moisture with high instability and strong dynamic forcing east to north of the low pressure circulation was a recipe for flash flooding.
|
|
|
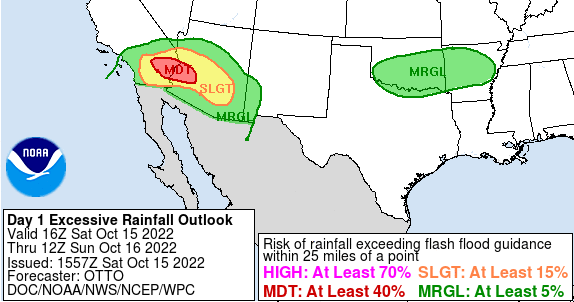
Fig. 4. WPC Day 1 Excessive Rainfall Outlook with Moderate Risk (updated at 8:57 AM MST/PDT October 15, 2022). |
Considering the potential for flash flooding ahead of time, the Weather Prediction Center (WPC), in coordination with NWS Weather Forecast Offices (WFO), introduced a Slight Risk/SLGT (at least 15% chance of flash flooding) in their Excessive Rainfall Outlook (ERO) product in the morning of Thursday the 13th. This product would later be updated the morning of the 15th to include a Moderate Risk/MDT (at least 40% chance) along the I-10 corridor in Southwest AZ and Southeast CA (Figure 4). WFO Phoenix, also issued a Flood Watch Friday morning for the flash flood potential Saturday and Sunday (Figure 6).
Fig. 5. Mosaic radar imagery from AM on Oct. 15, 2021 to PM MST on Oct. 16, 2022.
Thunderstorms first began developing early Saturday morning, around 3 AM MST/PDT, in southern AZ and would only grow in coverage and intensity throughout the rest of the day (Figure 5). The high moisture content and instability supported high rainfall rates, with common rates around 0.5-1.0” per hour and up to 2”+ per hour in some of the strongest storms. Multiple rounds of strong storms only made matters worse for flash flooding and drastically increased rainfall totals in some areas.
|
|
|
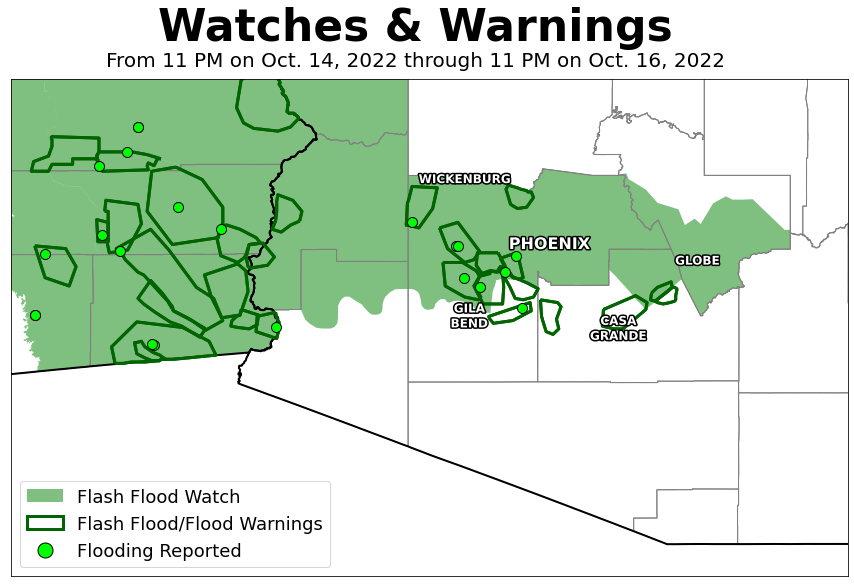
Fig. 6. Flash Flood Watch and Flash Flood Warnings issued by WFO Phoenix, as well as Flooding Local Storm Reports (LSR) from 11 PM Oct 14th through 11 PM Oct 16th. |
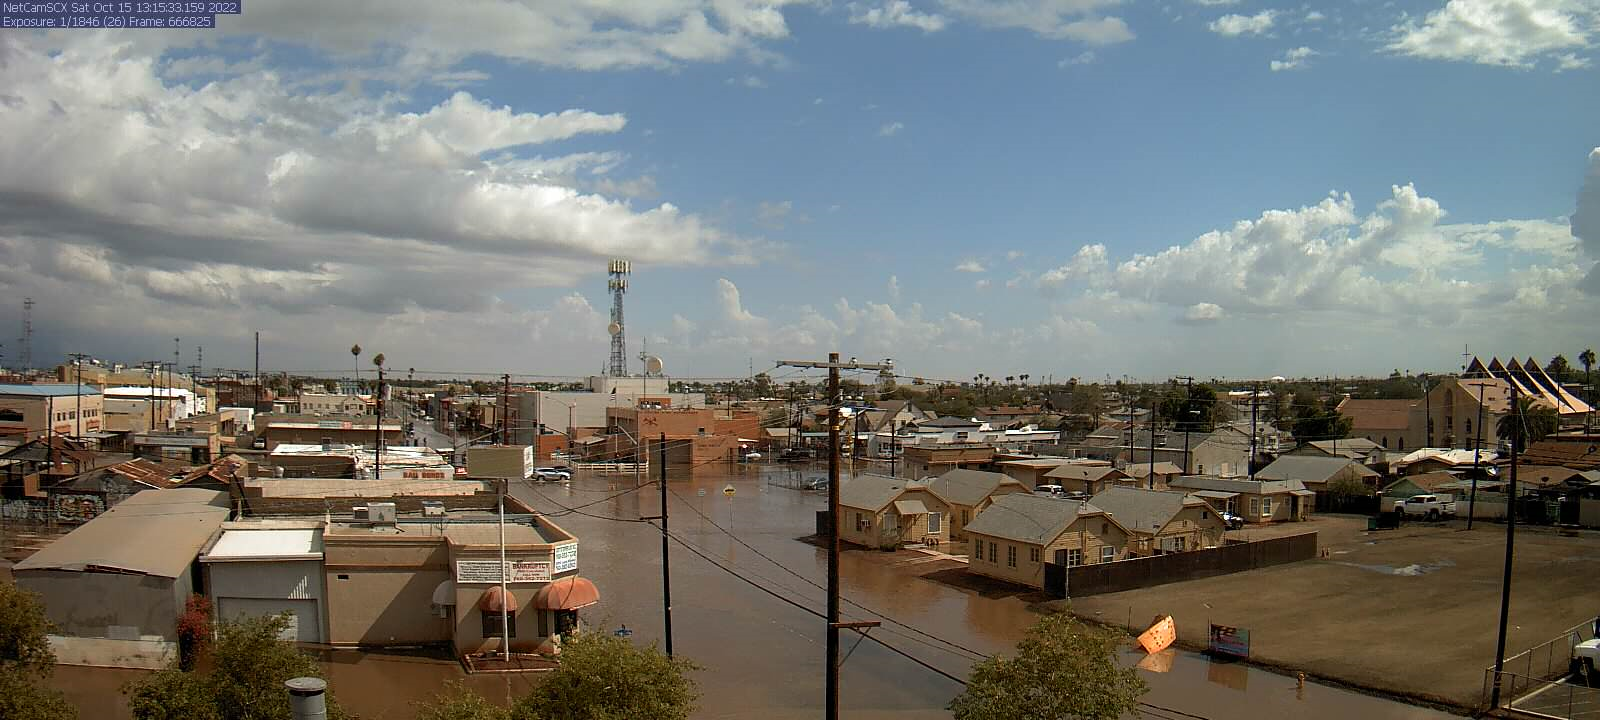
In total, 23 Flash Flood Warnings were issued on the 15th and 1 on the 16th, with most warnings in Southeast CA and western Maricopa County (Figure 6).There were 5 Flood Warnings as well for areas that experienced flooding impacts for an extended period of time. There were numerous running washes around the region, flooding several low water crossings with some stranded vehicles in floodwaters and/or vehicles pushed off the side of the road. In the Imperial Valley, in California, numerous city streets in Calexico and El Centro became inundated with several inches of water (Figure 8).
|
|
|
|
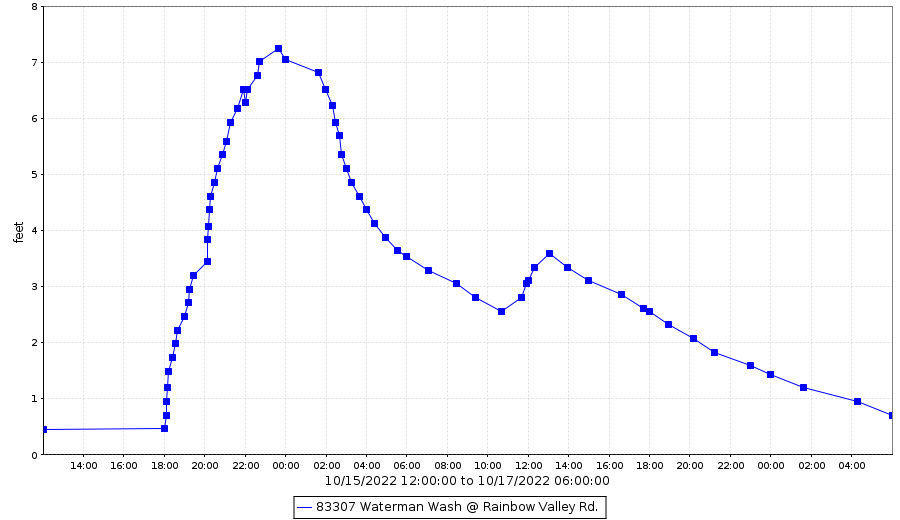
Fig. 7-8. Streamflow gauge along Waterman Wash at Rainbow Valley Rd measured a peak flow height of nearly 7 ft (plot from FCDMC)(left). Numerous flooded streets in El Centro, CA (photo credit: Imperial County Air Pollution Control District)(right). |
|
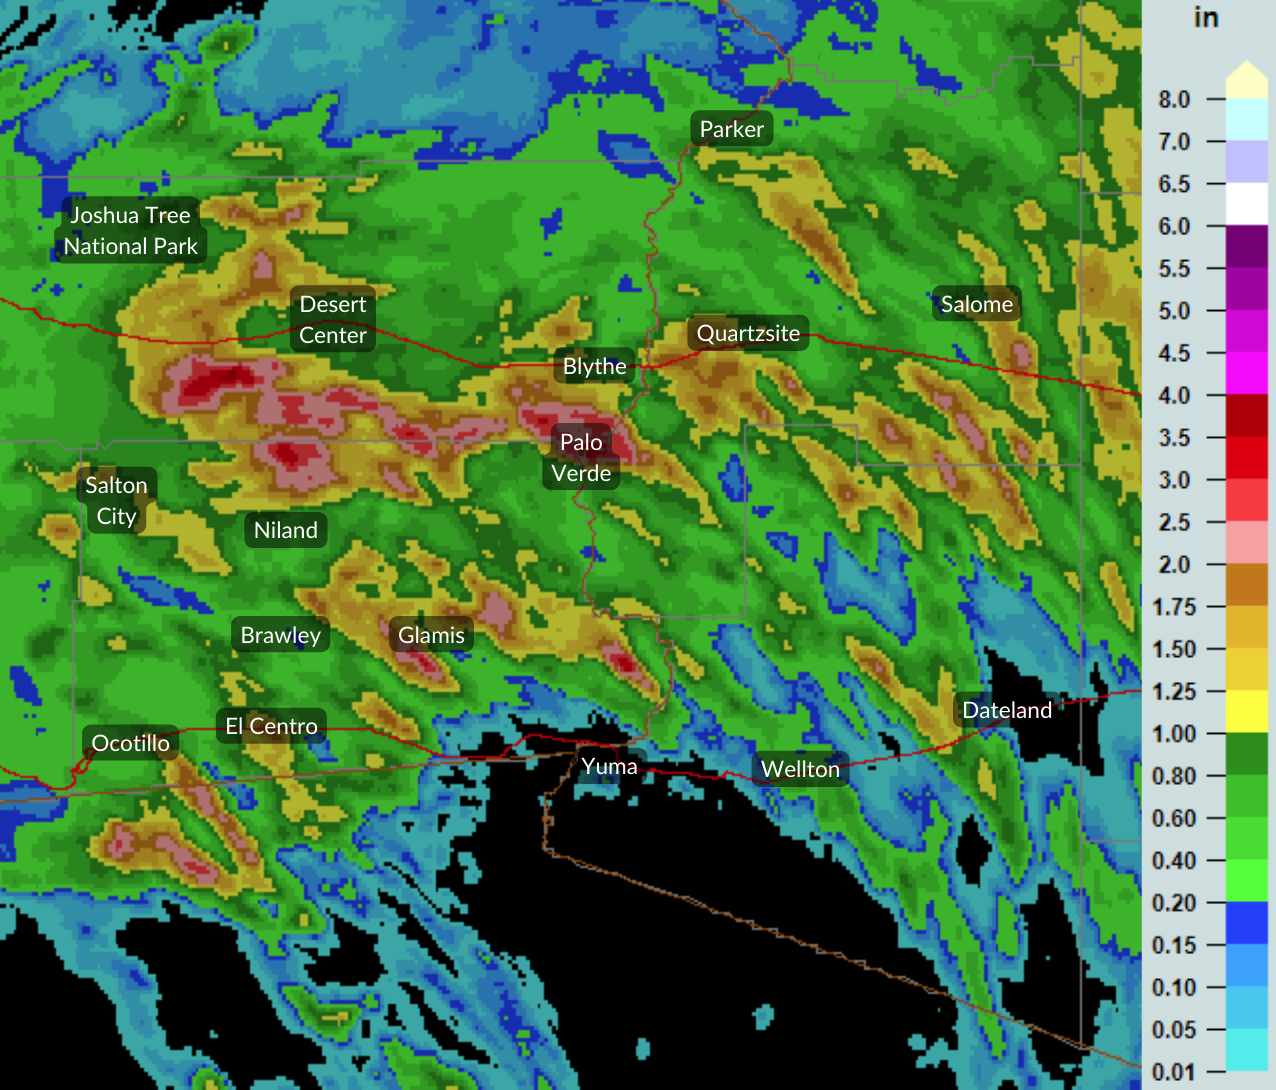
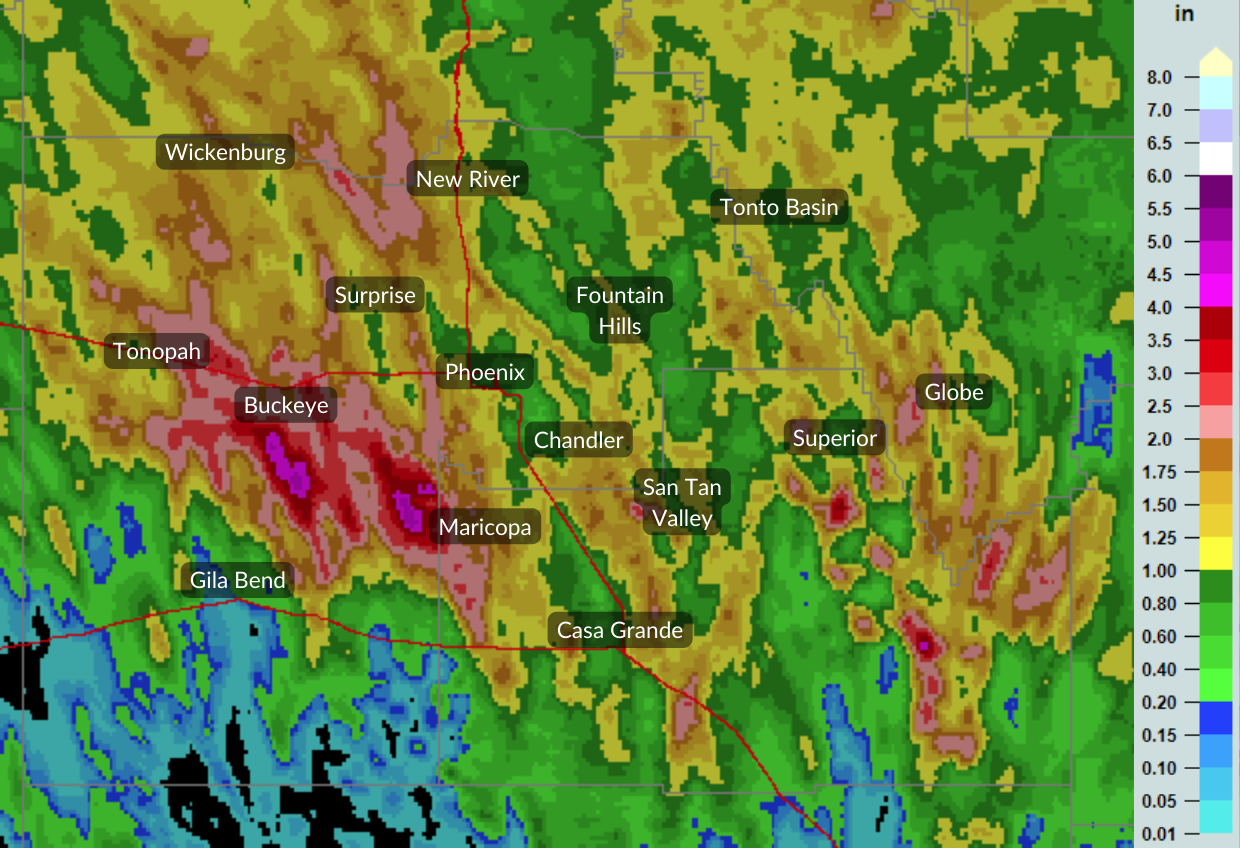
By the end of the weekend, plentiful rain had fallen across a wide area from Southern CA through Southern and Central portions of AZ (Figure 9). Much of Southern CA and AZ saw at least 0.25” of rain and a lot of people received 1.00”+, including in Phoenix. The 2-day average rainfall across the Phoenix area, using the Phoenix Rainfall Index (PRI), was 0.94”, with coverage of 99% and 84% on the 15th and 16th, respectively. Phoenix Sky Harbor Airport measured 0.94”, which brought the annual rainfall total to 3.73” through Oct. 16 (still 3.49” below the annual average). The area that saw the most rainfall, after multiple rounds of strong storms, was in western Maricopa County and in particular Rainbow Valley through Buckeye to Tonopah. There were a few rain gauges with 3”+ and radar estimates in the area of 4”+. A Flood Control District of Maricopa County (FCDMC) streamflow gauge on Waterman Wash through the Rainbow Valley saw measured flow over 1,500 cubic feet per second (cfs) with peak flow height of nearly 7 ft (Figure 7). There was at least one vehicle washed off the side of Narramore Rd at a low water crossing with Waterman Wash, near Buckeye. Despite the widespread rainfall from this event there was only a slight reduction in the ongoing drought.
|
|
|
|
Fig. 9. Estimated rainfall totals based on the Multi-Radar Multi-Sensor (MRMS) mosaic. Southeast CA and Southwest AZ on the left and South-Central AZ on the right. |
|
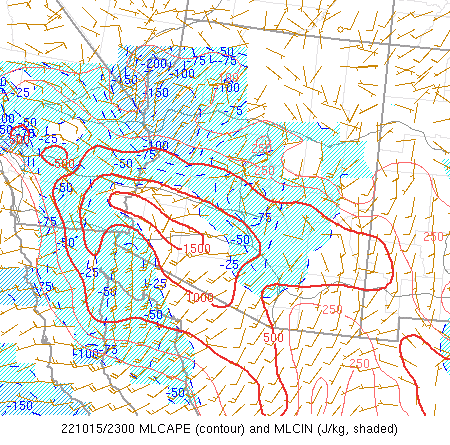
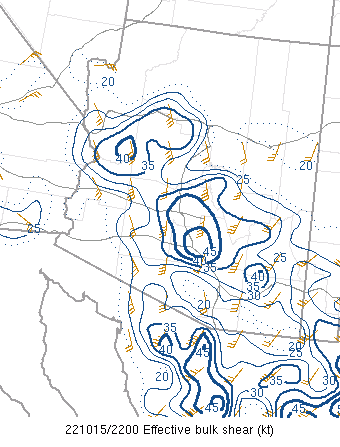
Severe Weather: The environment east to north of the low circulation progressively destabilized through the day Saturday with mixed-layer convective available potential energy (MLCAPE), a measure of atmospheric instability, increasing up to 1000-1500 J/kg across Southeast CA and Southern AZ (Figure 10). This supported strong thunderstorm updrafts and precipitation loading, sufficient for strong downdraft wind gusts. However, what really increased the severe storm threat was the shear, or changing wind direction and/or speed with height. Effective bulk shear, or effective bulk wind difference (EBWD), peaked around 35-45 kts through Saturday across the region (Figure 11). These magnitudes, with the high MLCAPE, were sufficient for organized severe storms and even isolated supercells.
|
|
|
|
Fig. 10-11. MLCAPE at 23Z (4 PM MST) (left) and Effective Bulk Shear at 22Z (3 PM MST) on Oct. 15 (right). |
|
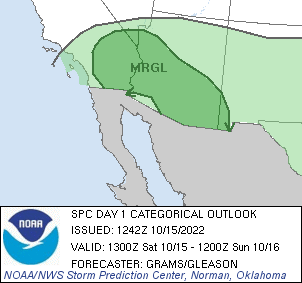
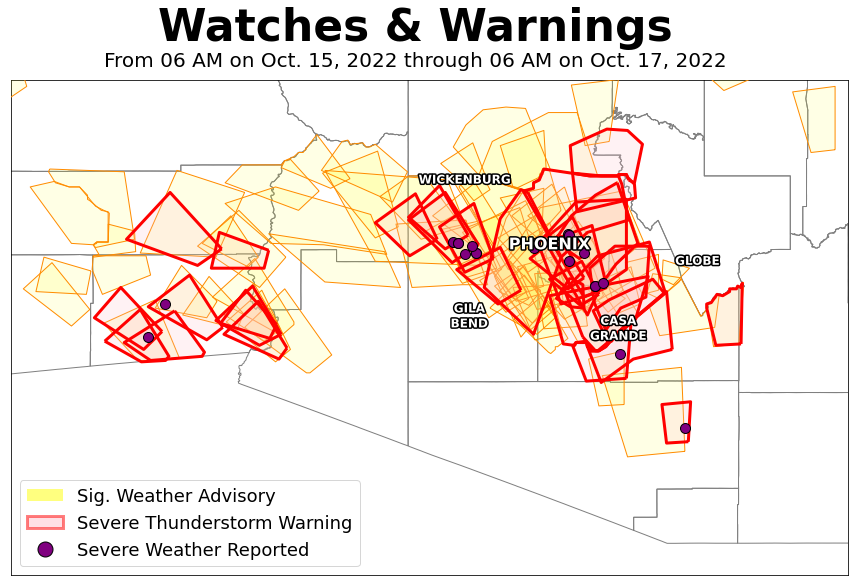
The Storm Prediction Center (SPC) introduced a Marginal Risk for severe storms on Saturday beginning with their 1730Z (10:30 AM MST) Day 2 Convective Outlook issued on Friday (Figure 12). The primary severe threats were wind and hail, especially with the colder air aloft (freezing levels 10,000-12,0000 ft). Over the weekend, several severe thunderstorms developed, with a few supercells as well. The Lifting Condensation Levels (LCL) did fall quite low (as low as 2,000-2,500 ft), but the low level wind environment was short of ideal for tornadoes with SFC-1 km Storm Relative Helicity (SRH), a measure of the potential for cyclonic updraft rotation, peaking around 50-100 m2/s2. WFO Phoenix issued a total of 28 Severe Thunderstorm Warnings, with 27 of them issued on Saturday through late Saturday night, and several Significant Weather Advisories (Figure 13).
|
|
|
|
Fig. 12-13. Convective Outlook from the SPC showing a Marginal Risk (MRGL), in dark green, with the 13Z (6 AM MST) Day 1 update on Oct. 15 (left). Severe Thunderstorm Warnings and Special Weather Statements issued by NWS offices through the weekend with preliminary storm reports (right). |
|
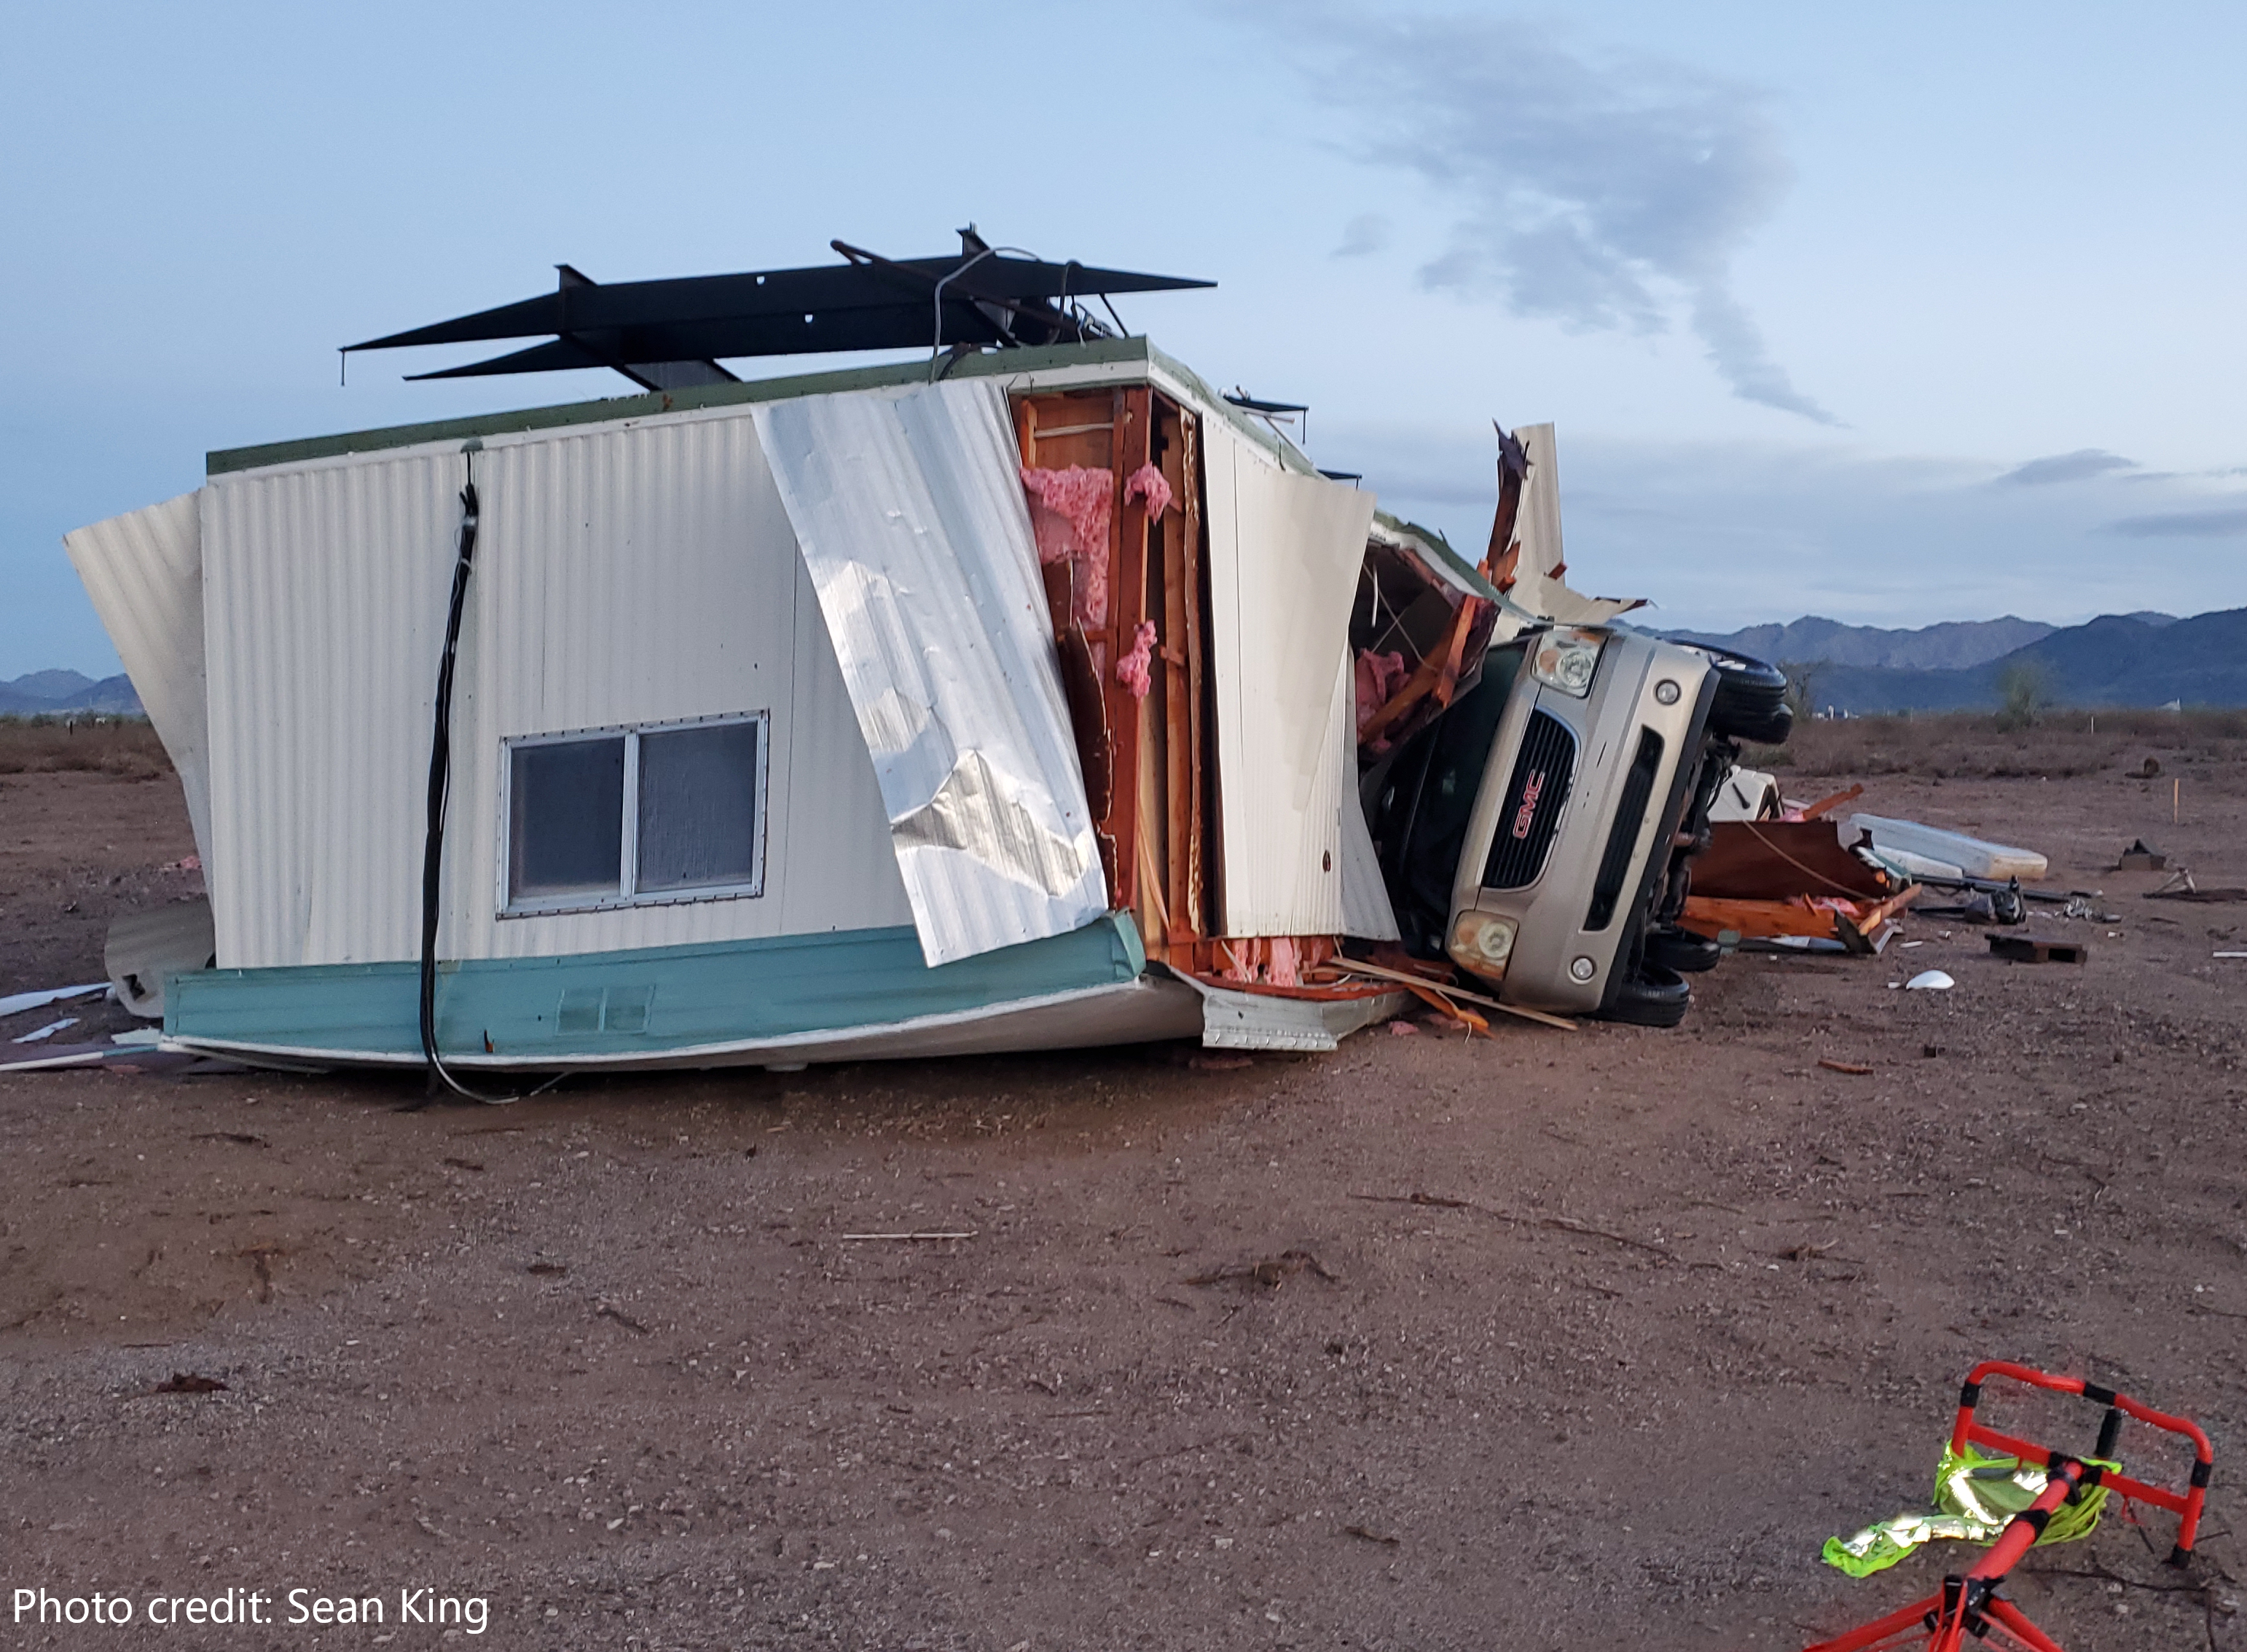
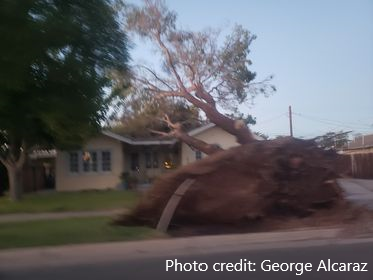
The severe storms caused a lot of damage and other impacts, with numerous downed power lines, leading to thousands of power outages. There were also several uprooted and toppled trees, with some falling on vehicles and homes (Figure 15). A couple supercell thunderstorms hit the Tonopah, AZ area Saturday evening only 1 hour apart and caused considerable damage. The second of the two produced damaging winds that knocked out power to the area, destroyed two mobile homes, damaged dairy farm structures, and even caused livestock losses (Figure 14). Most storms produced at least small hail and there were a few instances of severe hail (> 1” in diameter). One storm that moved through Mesa and Scottsdale between 12:30 AM and 1:30 AM early Sunday morning produced large oblong hail stones with diameters up to 1.5-2.0” (ping-pong to lime sized) (Figure 2). Lightning impacts were also noted - a young individual survived a lightning strike and there was at least one report of a house fire caused by lightning.
|
|
|
|
Fig. 14-15. One of a couple destroyed mobile homes in Tonopah, AZ (photo credit: Sean King) (left). Large Tree that fell on a home in El Centro, CA (photo credit: George Alcaraz)(right). |
|
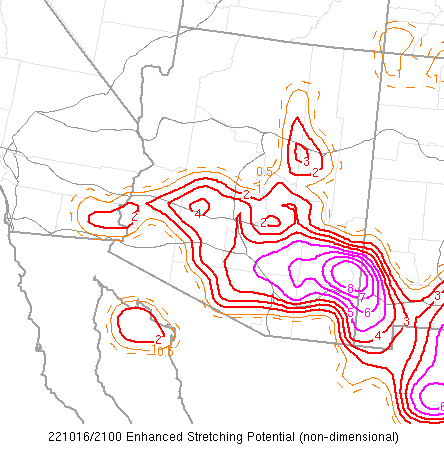
Landspout: On Sunday, coverage of showers and storms had decreased as the low pressure circulation had shifted into South-Central AZ. However, there were still a few strong storms that produced impacts. One isolated storm, that developed in the Sun Lakes, AZ area around 3 PM MST, briefly produced a landspout tornado (non-supercellular tornado). The conditions came together just right for the landspout to develop, touching down in an open field for roughly 5 minutes. The storm that the landspout developed with actually had very little lightning and had radar characteristics of a sub-severe thunderstorm. What supported the landspout development was an environment with a relatively high Enhanced Stretching Potential (ESP) (Figure 16). ESP is a composite index based on 0-3km MLCAPE and 0-3km Lapse Rate, both of which were high Saturday afternoon. Another aiding element, and possibly the key element, was an outflow boundary (gust front) from another storm that passed under the updraft. It likely helped tilt and stretch surface vorticity (spin in the atmosphere) into the updraft, which tightened into a condensed funnel from the surface to cloud base. Although it is unknown how strong the landspout was, since it passed over an open area and did not cause any damage, it was classified as an EF0 tornado (65-85 mph).
|
|
|
Fig. 16. Enhanced Stretching Potential (ESP) around the time of the landspout on Oct 16th. |