Storm Report for August 16-17, 2021
Last updated at 3 PM on August 24, 2021
Impacts: Widespread wind damage, localized flash flooding
Strong to severe thunderstorms generated widespread winds of 50+ mph (with areas of 65-75 mph) across Maricopa and Pinal Counties during the late evening hours of August 16, 2021. The storms then continued southward, generating moderate to heavy rain. Peak wind gusts for this event included 73 mph in Queen Creek and 69 mph at Phoenix Sky Harbor International Airport.
Fig. 1. Wind velocity data from the FAA Terminal Doppler Weather Radar (TDWR), located southwest of downtown Phoenix. Image is centered on downtown Phoenix. Green (red) indicates air and rain moving towards (away from) the radar. Widespread 50+ mph winds are observed at the lowest elevations, moving east-to-west across the Phoenix area. Note the second outflow that moves in from the southwest from earlier thunderstorms south of Gila Bend. Also note that the radar beam increases as height as it moves away from the radar, thus the highest speeds observed are a few thousand feet above the ground.
Fig. 2. Mosaic radar imagery from 1 PM on Friday Aug. 13, 2021 to 10 AM on Saturday Aug. 14, 2021.
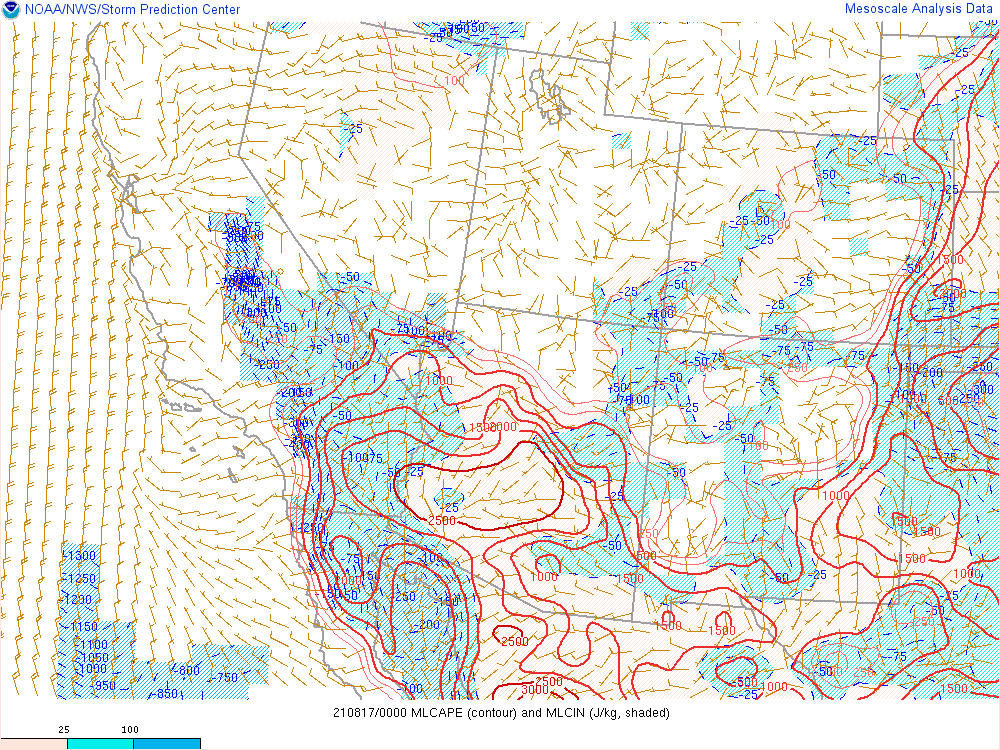
Thunderstorms initially formed over the mountains north and east of the Phoenix area during the afternoon and evening hours. Eventually the thunderstorms drifted into lower elevations, where considerable amounts of unstable air were present. Based on objective analysis, air parcels across the lower elevations within the boundary layer (lowest ~8,000 ft of the atmosphere) contained over 2500 J/kg of buoyant energy. This was confirmed by the routine weather balloon sounding conducted at NWS Phoenix at 5 PM on Aug. 16, 2021, which measured a whopping 3,000 J/kg - one of the highest levels ever measured in Phoenix. Almost no capping inversion (an inhibitor to rising air) was observed, indicating explosive thunderstorm development was possible given a mechanism to release the energy.
|
|
|
|
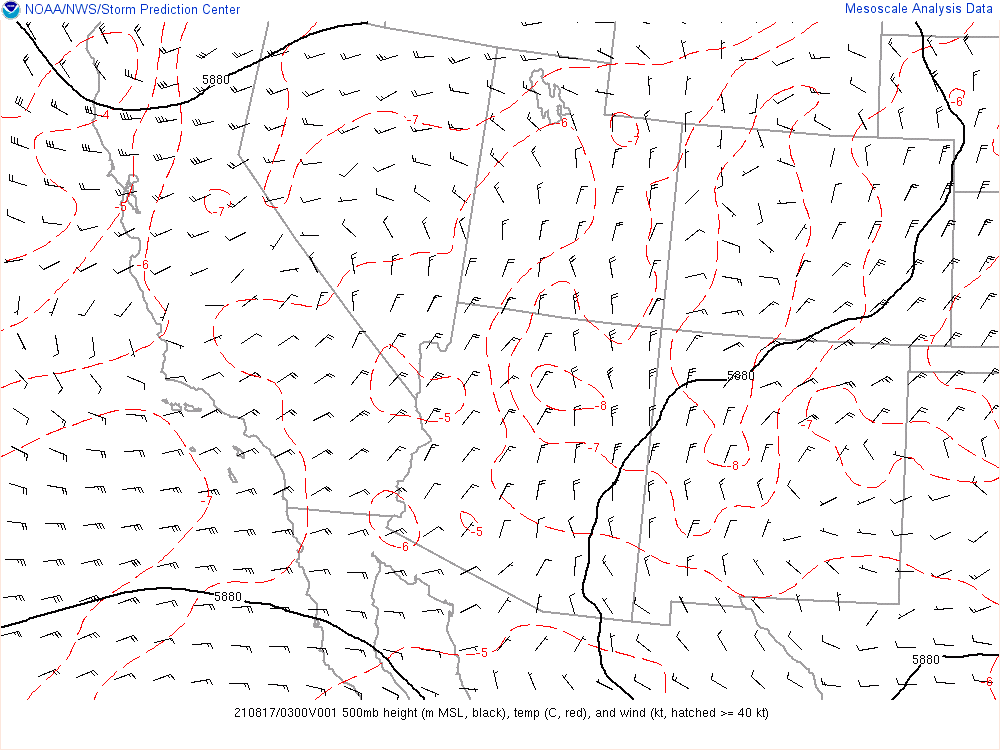
Fig. 3. (Left) Wind barbs, temperature contours, and height contours at 500 mb across the Southwest at 8 PM on Aug. 16, 2021. Note the pocket of colder air (-8C contour near Flagstaff) and enhanced northerly winds moving toward central Arizona. (Right) Objective analysis of mixed layer convective available potential energy (MLCAPE), a measure of atmospheric instability, across the Southwest at 5 PM on Aug. 16, 2021. A large area of 2,500 J/kg was analyzed, indicating the potential for explosive thunderstorm development. |
|
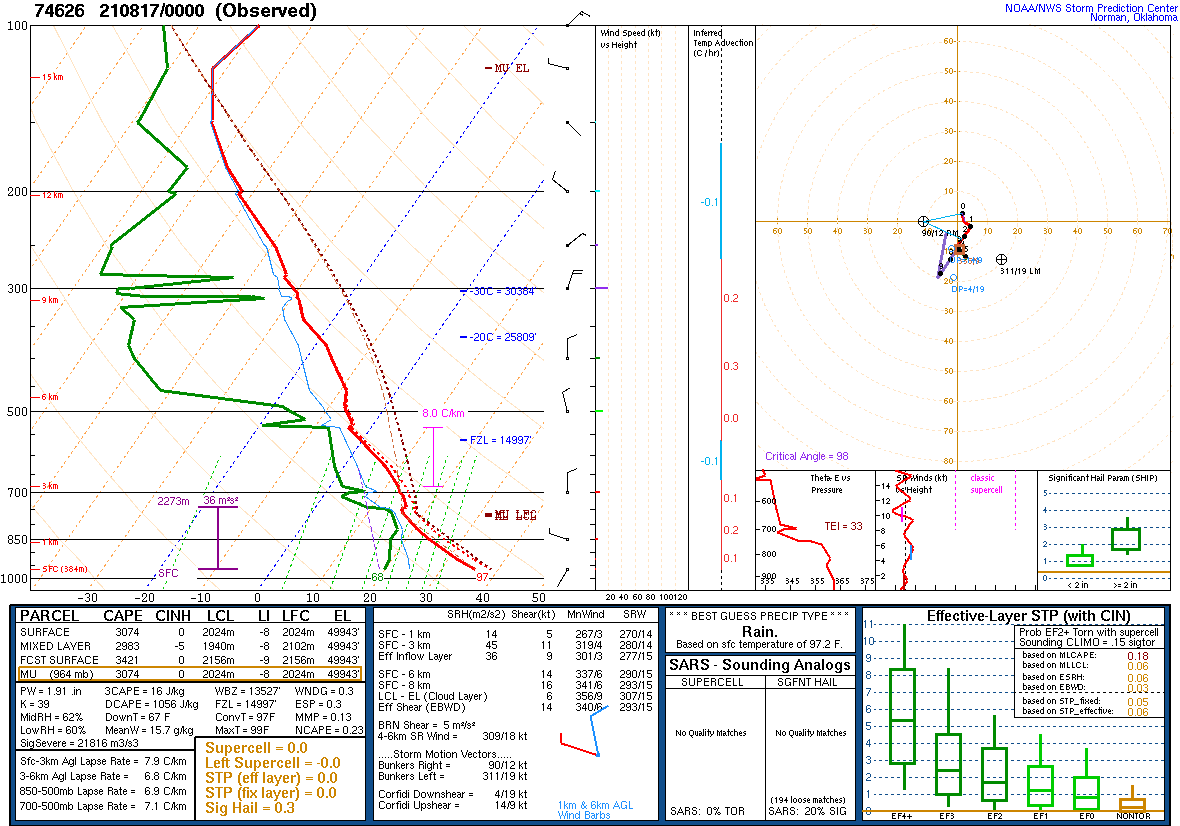
Fig. 4. A technical schematic of weather data obtained from a routine weather balloon release at 5 PM on Aug. 16, 2021 at the NWS Phoenix office. The data reflect an atmosphere with very moist and unstable air along with a deep northerly flow.
Thunderstorms intensified as they moved into far eastern Maricopa County. Aided by increasing winds behind them, a rear inflow jet developed, strengthening the cool air rushing out ahead. Winds at approximately 2000 feet above the surface, which are stronger due to less frictional drag with the ground, peaked at nearly 90 mph. Eventually a large cold pool would explode across the entire Phoenix area and much of western Pinal County. Within, winds of 50 mph were common with areas of 60-70 mph.
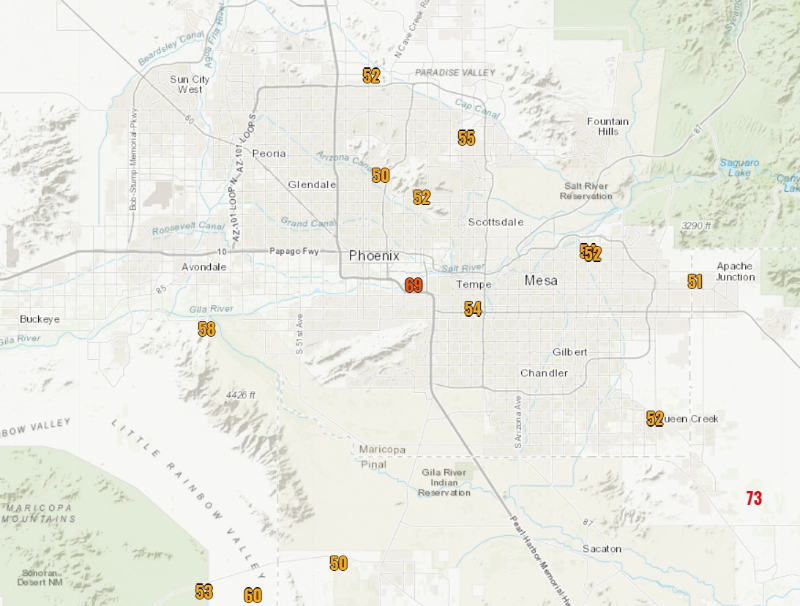
Fig. 5. Weather station observations across central Arizona depicting peak wind gusts of 50+ mph on Aug. 16, 2021.
Fig. 6. Wind velocity data from the NOAA/NWS Weather Surveillance Radar (WSR-88D), located in southeast Mesa. Green (red) indicates air and rain moving towards (away from) the radar. Widespread 50+ mph winds are observed at the lowest elevations, moving east-to-west across the Phoenix area. Note that the radar beam increases as height as it moves away from the radar, thus the highest speeds observed are a few thousand feet above the ground.
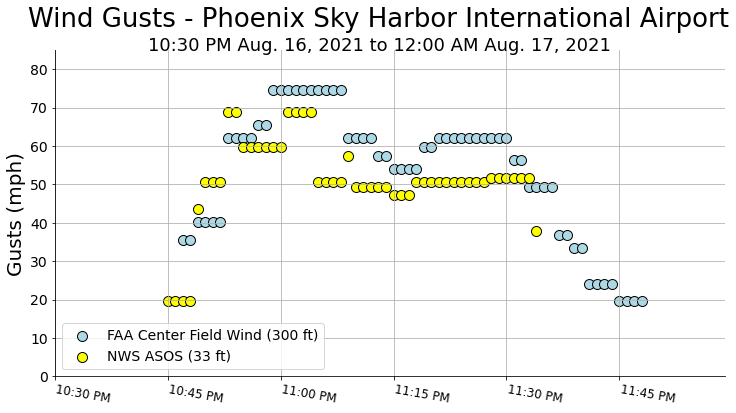
Fig. 7. Wind gusts from the FAA Center Field Wind (CFW) system at Phoenix Sky Harbor International Airport and NWS/FAA Automated Surface Observing Station (ASOS). CFW winds are sensed near 300 feet above the ground thus there is less friction with the ground and wind speeds are higher than the ASOS winds at 33 feet above the ground.
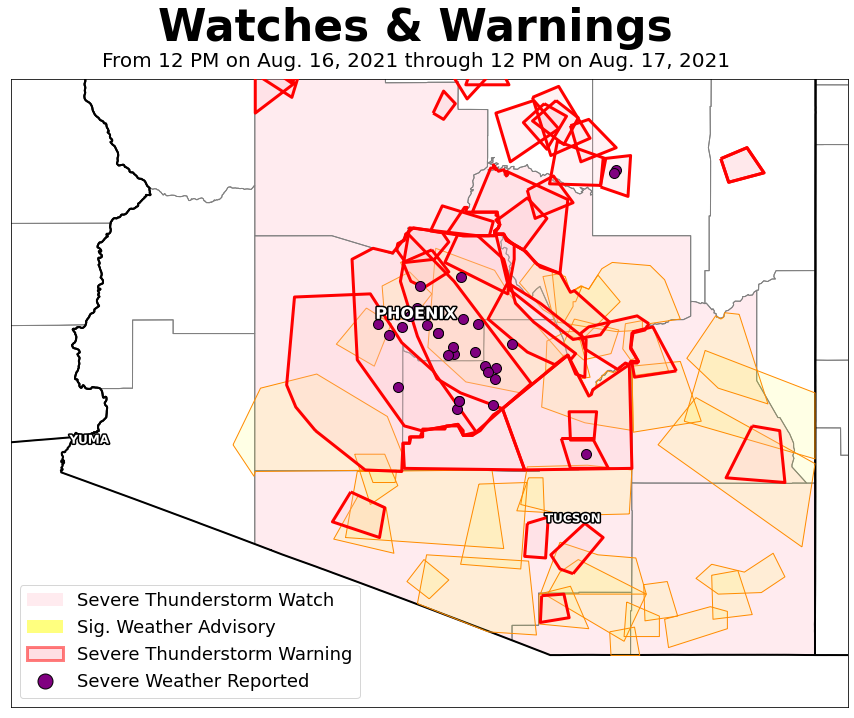
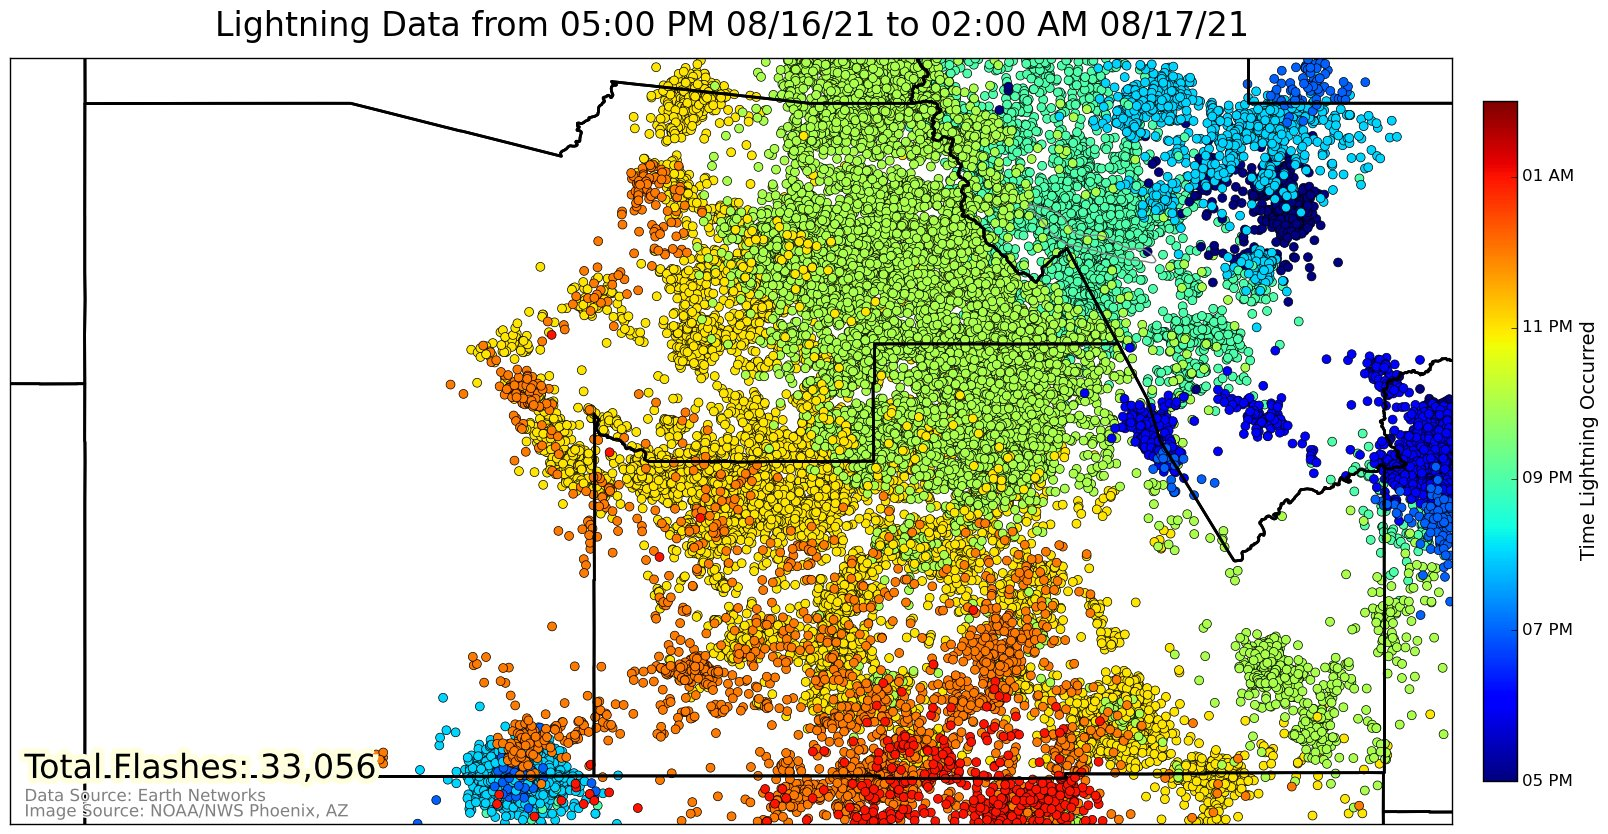
A Severe Thunderstorm Watch was issued by the NOAA/NWS Storm Prediction Center at 4:50 PM on Aug. 16, 2021. As thunderstorms developed and moved through southern and central Arizona during the evening and nighttime hours, 42 Severe Thunderstorm Warnings (for 58+ mph winds) and 36 Significant Weather Advisories (40-58 mph winds) were issued. Over 33,000 cloud-to-cloud lightning flashes occurred across central Arizona during the height of the event.
Fig. 8. Spatial extent of Significant Weather Advisories and Severe Thunderstorm Warnings issued for this event by NWS offices in Phoenix, Flagstaff, and Tucson. Locations where severe weather was reported to NWS noted with purple dots.
Fig. 9. Cloud-to-cloud lightning flashes across central Arizona from 5 PM on Aug. 16, 2021 to 2 AM on Aug. 17, 2021. Over 33,000 flashes were observed, primarily across western Gila, eastern Maricopa, and western Pinal counties. Data source: Earth Networks.
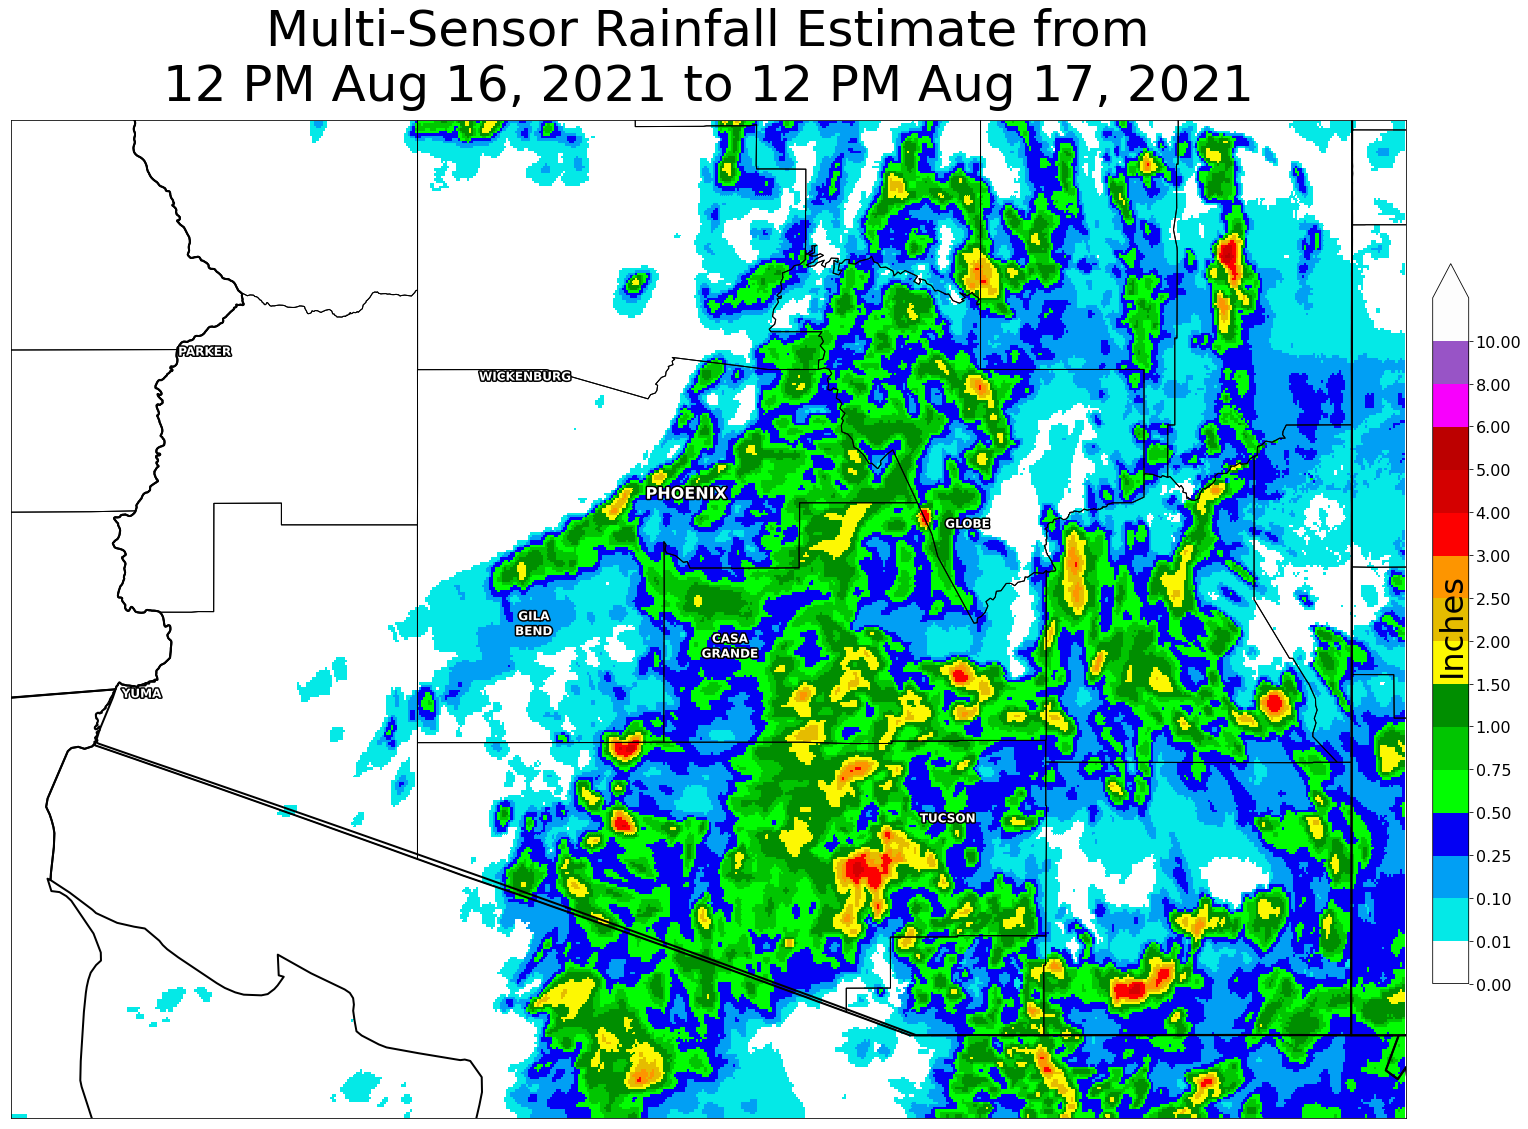
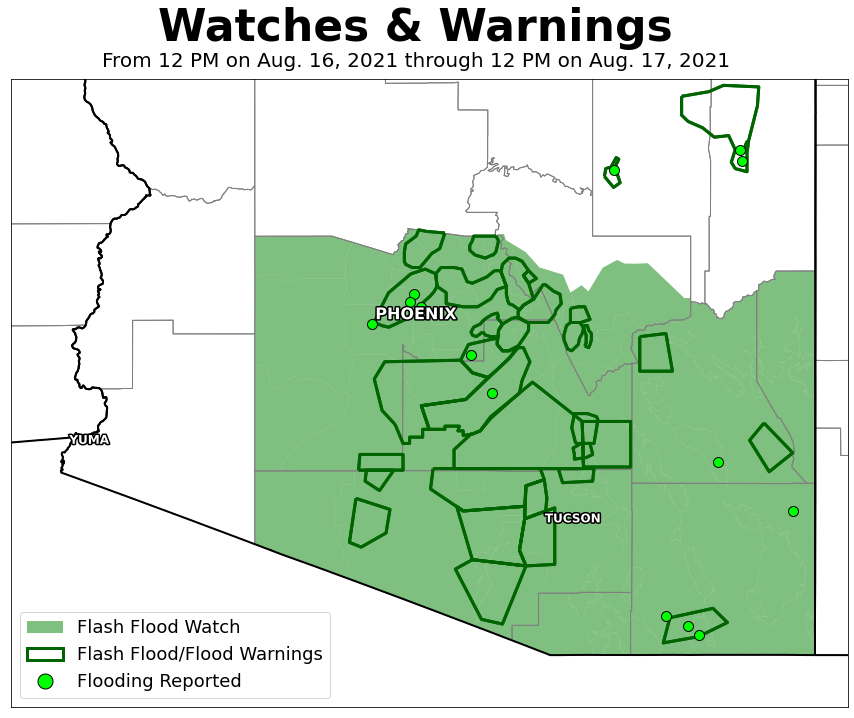
A Flash Flood Watch was in effect prior to the thunderstorm developing and moving through the region. Many areas received at least 0.5 inches of rain during the event, with isolated pockets of 2-3 inches occurring. Due to the intensity of this rain, 36 Flash Flood Warnings were issued with the passage of the thunderstorms.
Fig. 10. Rainfall estimates (based on gage-adjusted radar data from the Multi-Radar Multi-Sensor [MRMS] system) across southern Arizona from 12 PM on Aug. 16, 2021 to 12 PM on Aug. 17, 2021. Many areas from Phoenix eastward received 0.5 to 1.5 inches of rain, with some areas exceeding 2-3 inches.
Fig. 11. Spatial extent of Flash Flood Watch and Flash Flood/Flood Warnings issued for this event by NWS offices in Phoenix, Flagstaff, and Tucson. Locations where flooding was reported to NWS noted with green dots.