Storm Report for July 21-26, 2021
Last updated at 3 PM on 5 August 2021
Impacts: Localized wind damage, widespread heavy rains, numerous instances of flash flooding and unfortunately loss of life.
Fig. 1. GOES-16 satellite loop from July 17, 2021 through July 27, 2021 depicting upper level water vapor. Note the several clockwise circulations that move through the Central Plains, across Texas, and into the Southwest during the event.
An active start to the monsoon was exacerbated when an unusually strong low pressure system moved from east-to-west across the Southwest during July 21-26, 2021. The impacts included localized wind damage, widespread heavy rains, numerous instances of flash flooding and unfortunately loss of life. The initial activity was a mix of strong to severe thunderstorms and localized heavy rain, which then transitioned to widespread moderate rain with localized heavier amounts. Due to the very humid air in place, showers and thunderstorms were very efficient rain producers, with observed hourly amounts approaching 2.5 inches.
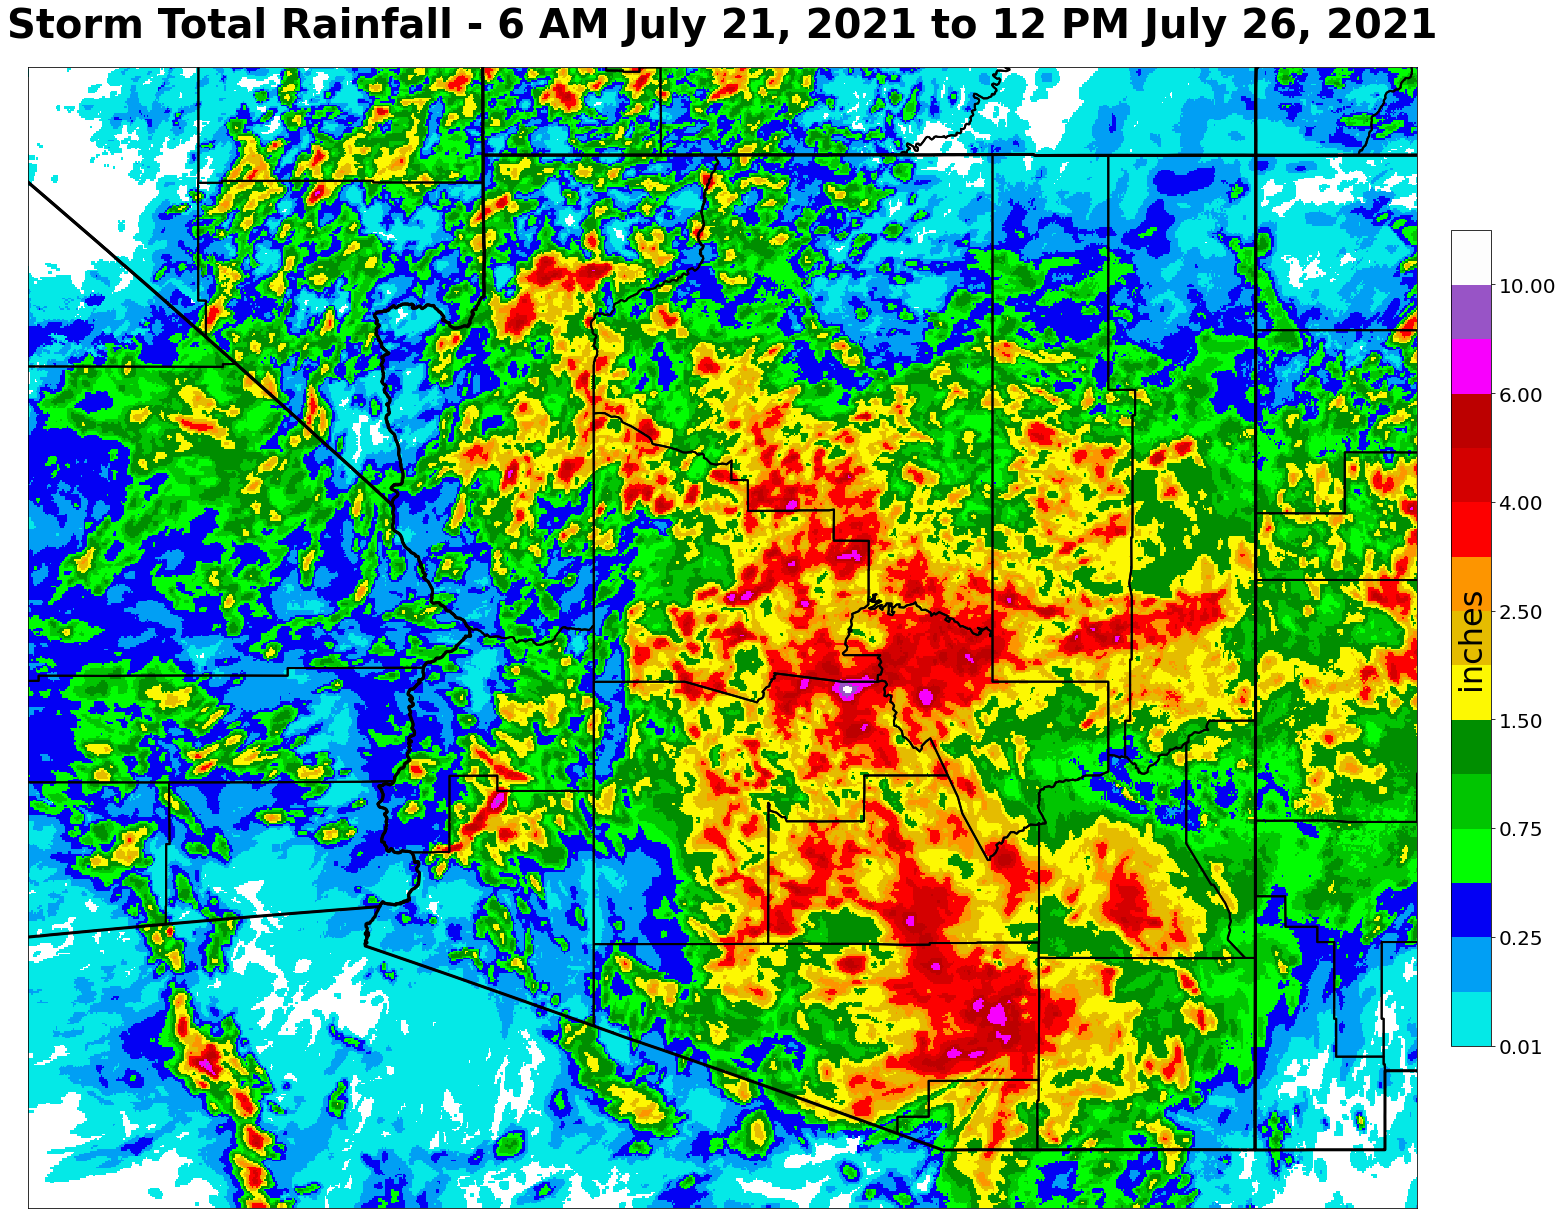
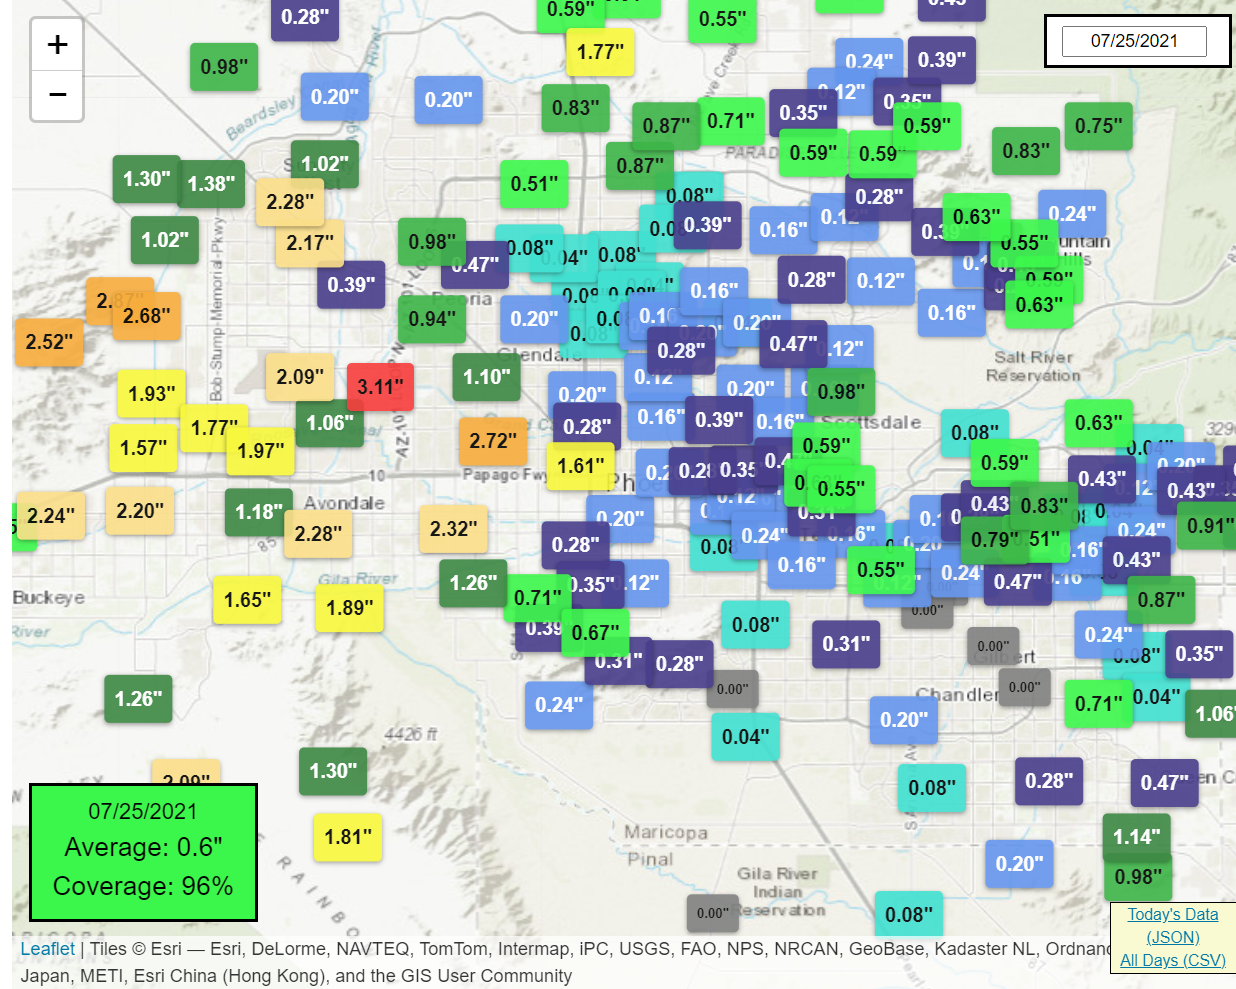
Fig. 2. Rainfall estimates (based on gage-adjusted radar data) across Arizona, southeast California, and far southern Nevada for July 21-26, 2021. Large portions of Arizona received over two inches of rain with some areas exceeding five inches.
In the Phoenix area, the entire metropolitan area received rain at some point through the event. The Phoenix Rainfall Index (https://www.weather.gov/psr/PRI), which aggregates rainfall across the metro into a single value, measured an average amount of 1.90”. This was the second wettest five-day total in the PRI database (available since 1990) during the monsoon, behind the all-time record of Sep. 8, 2014 (3.03”). The 0.82” measured on July 23, 2021 was the 8th largest single monsoon day in the database. Officially at Phoenix Sky Harbor Airport, 1.30” of rain was observed; the 0.80” on July 23, 2021 broke the record rainfall for the day. It was the wettest five day period during the monsoon since September 2014.
|
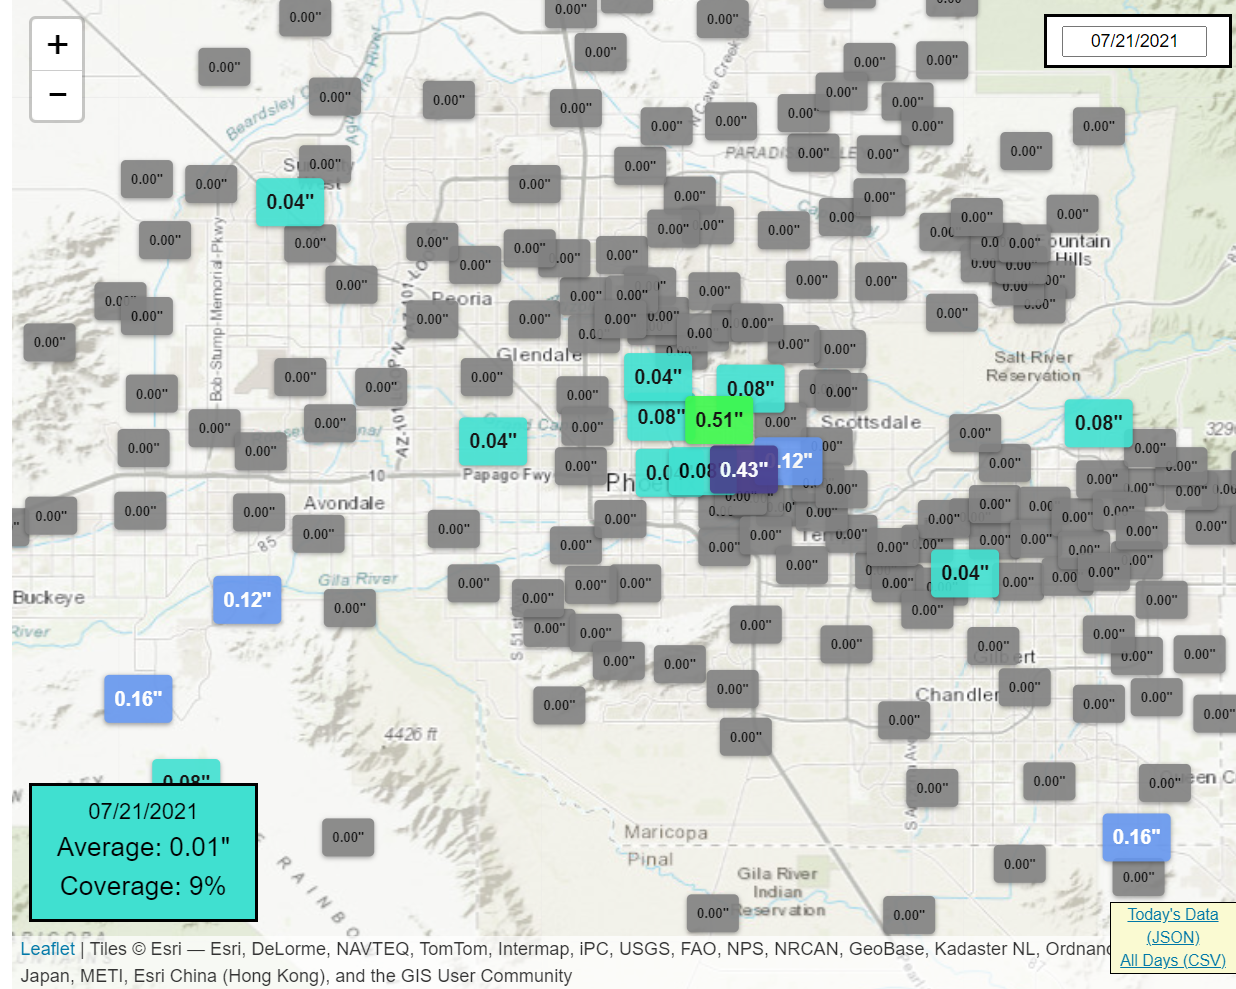
Table 1. Phoenix Rainfall Index (PRI) data for the days with rain across the Phoenix area during the event. The PRI leverages rainfall gage data from the Maricopa County Flood Control District and a Monte Carlo statistical method to determine the average rainfall across the large metropolitan area. Percent coverage of the metro area is also given. Click on the image for a larger version. |
||||
|
July 21, 2021
PRI: 0.1” Coverage: 9% |
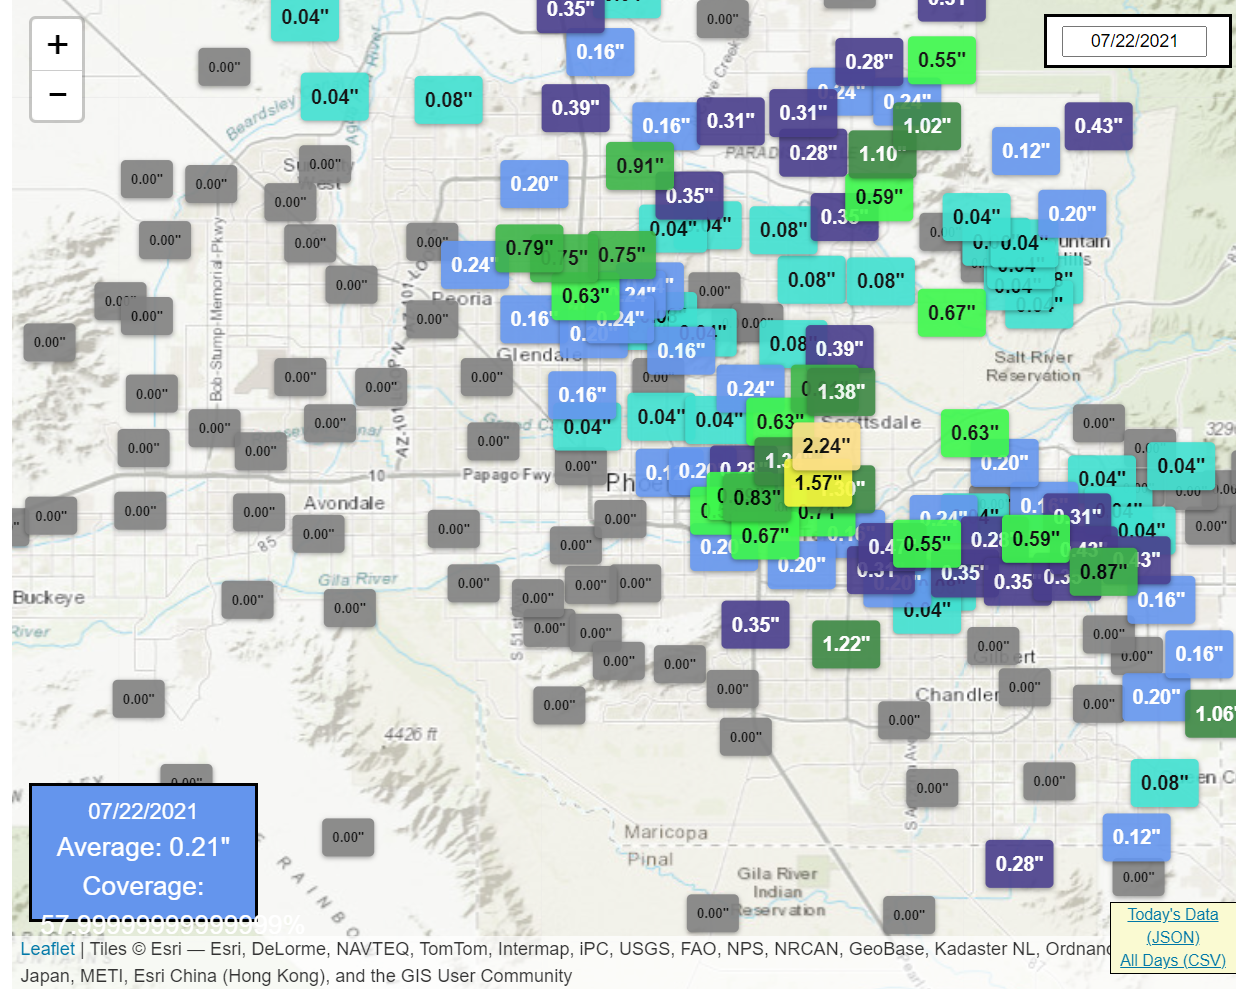
July 22, 2021
PRI: 0.21” Coverage: 58% |
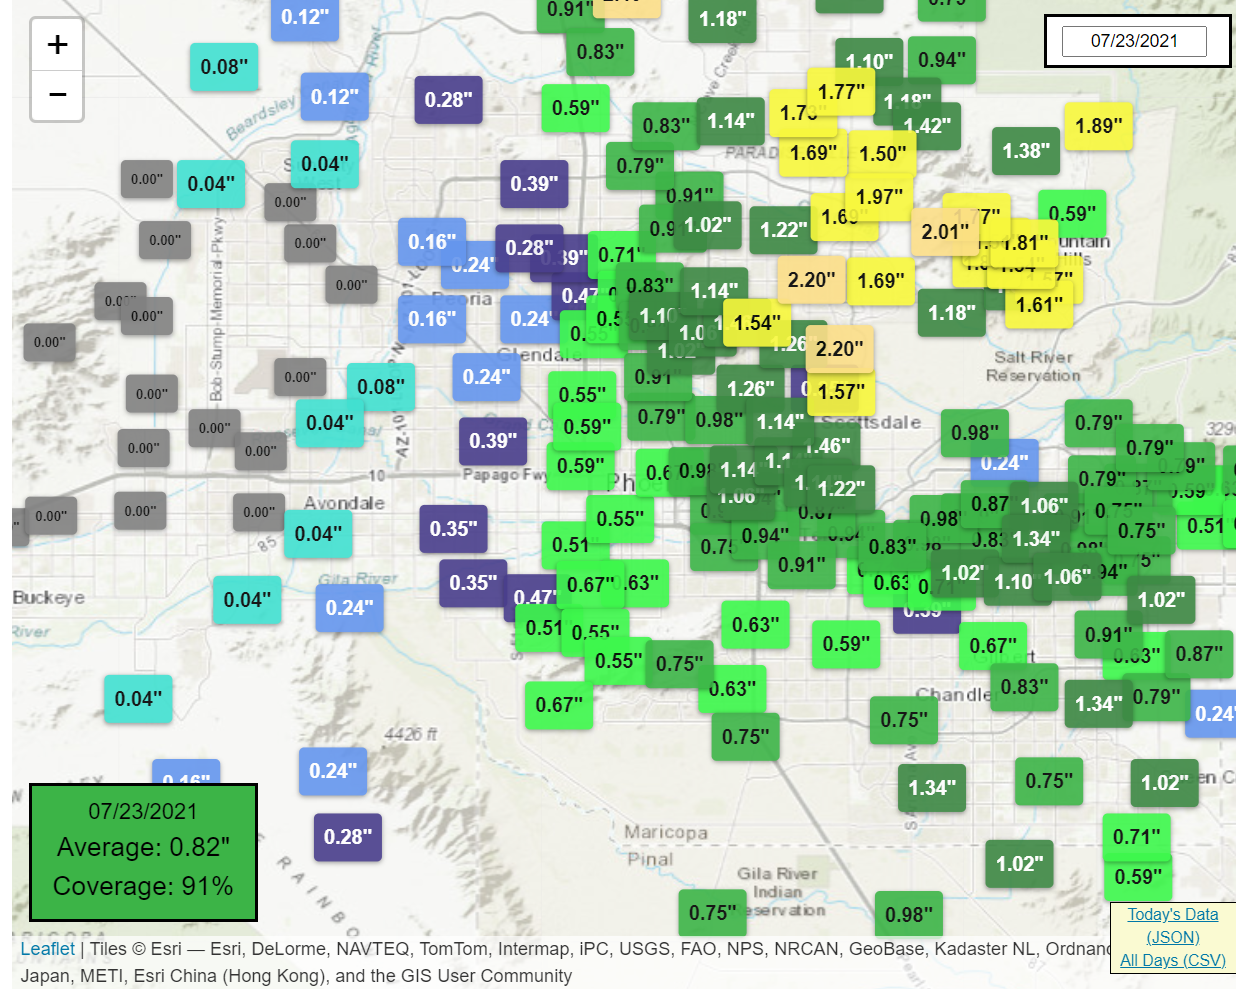
July 23, 2021
PRI: 0.82” Coverage: 91% |
July 24, 2021
PRI: 0.26” Coverage: 87% |
July 25, 2021
PRI: 0.60” Coverage: 96% |
The shower and thunderstorm activity began during the afternoon of Wednesday July 21, 2021, and continued for several days. An animation (below) of regional mosaicked radar through the complete event depicts the activity as it developed due to the low pressure system moving in from the east. Activity occurred in several waves, broken by periods of quiet weather. The broad cyclonic (counter-clockwise) circulation of the low can be seen as the low moves across the region along with several much smaller “meso lows”.
Fig. 3. Movie (framerate of 3 hours per second) of mosaicked radar imagery for the five-day event. Note the east-to-west progression typical of the monsoon and several cyclonic (counter-clockwise) circulations that move through the region.
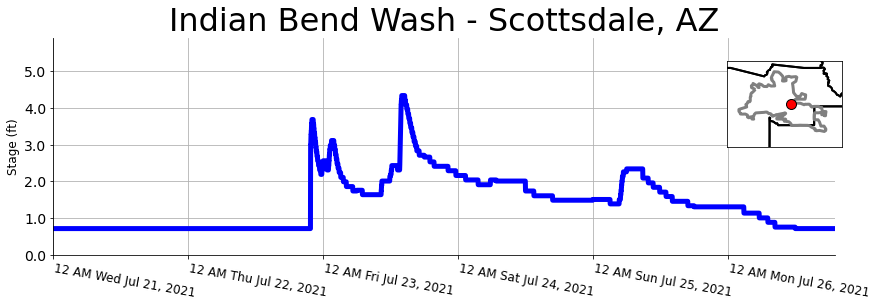
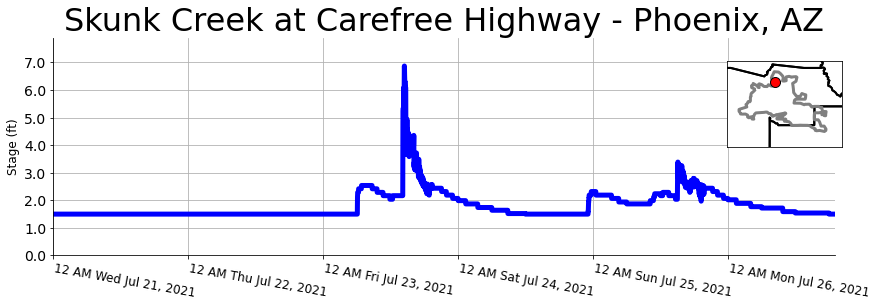
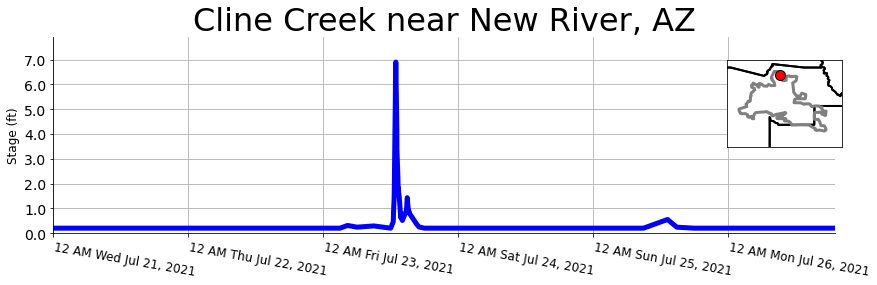
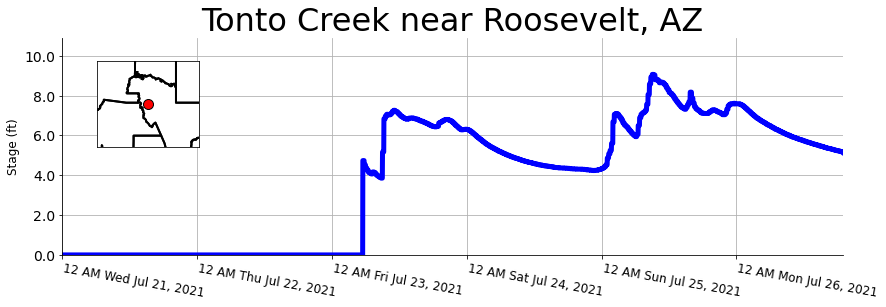
With the heavy rain, area washes and even rivers were flowing with water. Following localized heavy rain on the night of July 22, Indian Bend Wash exhibited high flows through Scottsdale, prompting several road closures into the following days. Additional heavy rain across northern stretches of the Phoenix metro area prompted high flows on some rivers, including New River and nearby and/or tributary streams of Skunk Creek and Cline Creek. Eventually higher flows were noted through the Agua Fria and Verde Rivers. Elevated flows were also observed through the Tonto Creek near Roosevelt.
Fig. 4. River stage data for Indian Bend Wash at Indian School Road in Scottsdale, AZ. The river peaked at 4.3 feet, above the bank full stage of 4.0 feet but below the flood stage of 5.0 feet. (Data courtesy the Maricopa County Flood Control District.)
Fig. 5. River stage data for Skunk Creek in north Phoenix, AZ. The river spiked to 6.9 feet, above the flood stage of 6.0 feet. (Data courtesy the Maricopa County Flood Control District.)
Fig. 6. River stage data for Cline Creek near New River, AZ. The river spiked to 6.9 feet, above the bank full stage of 6.4 feet but just below the flood stage of 7.5 feet. (Data courtesy the Maricopa County Flood Control District.)
Fig. 7. River stage levels at Tonto Creek near Roosevelt, AZ. Note two rises of several feet well above the Action Stage of 4.25 feet. (Data courtesy the USGS.)
Several examples of flooding were shared on Twitter during the event.
Although heavy rain was the most widespread and notable impact, there were instances of localized strong to severe winds. In particular, two instances of wind damage occurred. The first was near Tacna, AZ on July 21, 2021. Damage to a gas station, multiple homes, and electric car chargers was reported. The second was across south Scottsdale late on July 22, 2021. Reports of numerous trees down and structural damage near McCormick Ranch and Old Town Scottsdale were reported. The damage from both locations was associated with damaging downburst winds, which can occur when tremendous amounts of rainwater fall on a single location from an intense thunderstorm. Downbursts can generate winds in excess of 70 mph.
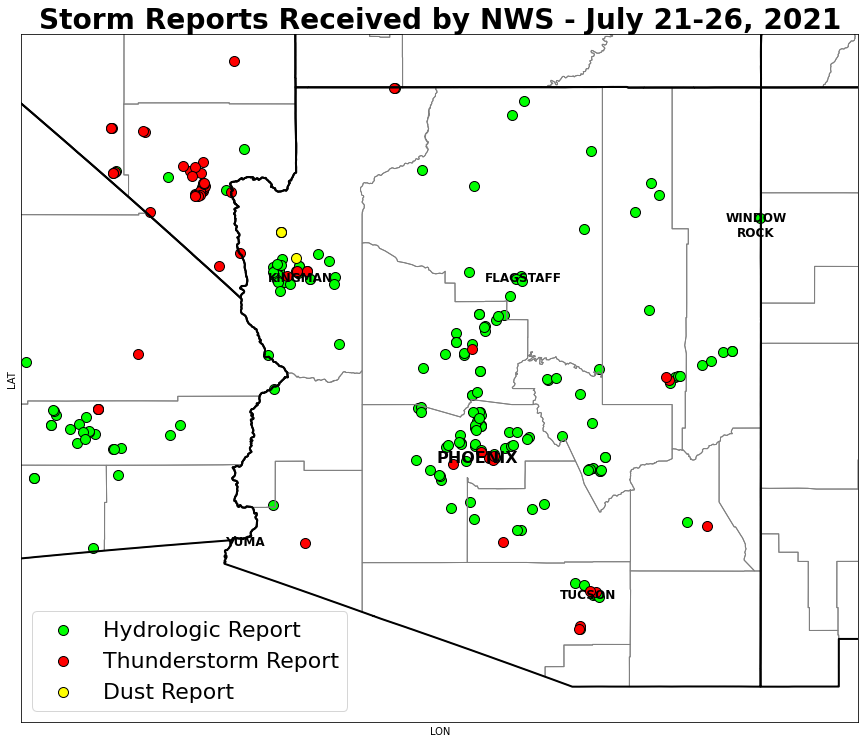
The map below (interactive map available here) shows the locations of storm reports as relayed to the NWS as of July 28, 2021. Over 250 reports were generated for this event from the NWS offices in Phoenix, Tucson, Flagstaff, Las Vegas, and San Diego.
Fig. 8. Map displaying storm reports received and documented by NWS offices in Phoenix, Flagstaff, San Diego, Tucson, and Las Vegas. Additional details available at https://mesonet.agron.iastate.edu/lsr/#FGZ,PSR,SGX,TWC,VEF/202107211300/202107261900/0000.
A large amount of lightning activity was noted across Arizona, as measured by the Vaisala National Lightning Detection Network (NLDN). Cloud-to-ground (CG) lightning strikes are measured by triangulating the observable radio frequencies they generate. Through the event, approximately 51,500 CGs were observed across Arizona which was the most for a five day period since late August 2018. The 2021 CG total (171,000) through July 26th stood at more than double the amount observed in the record dry/inactive 2020 monsoon season (83,000 CGs) (https://www.weather.gov/psr/YearinReview2020v2) and on the verge of surpassing the also inactive 2019 monsoon season (206,000 CGs) (https://www.weather.gov/psr/SouthwestMonsoon2019Review). While more than the previous inactive years, 2021 was close to the 1990-2020 average through July 26 (165,000).
Fig. 9. Cloud-to-ground (CG) lightning strikes across Arizona by hour during the event. Over 50,000 CGs were observed, the most for a five-day period since late August 2018. Note the decrease in lightning activity in the later portions of the event, indicative of a transition from strong/severe thunderstorms to heavy rain.
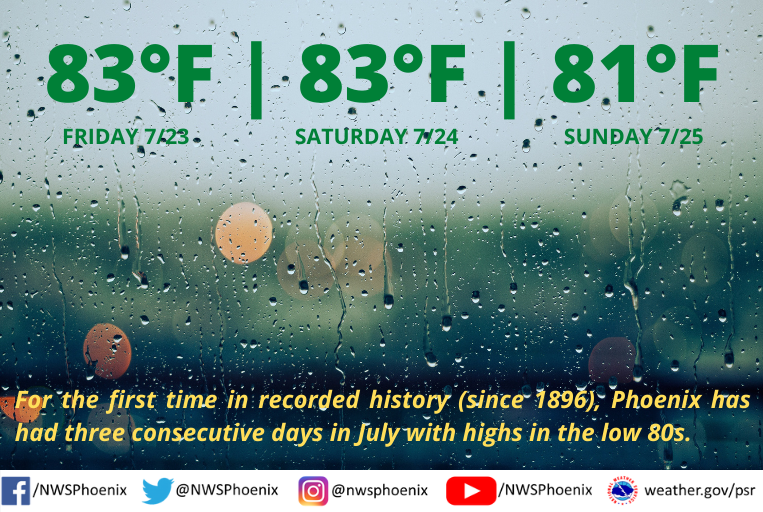
A positive from the event was record cool temperatures spreading across the region. With the excessive cloud cover and intermittent rainfall, afternoon temperatures for many areas were held in the 70s and 80s (°F) July 23-25, 2021.
Fig. 10. Social media graphic displaying the cool high temperatures experienced in Phoenix during the heart of the event. It was the first time in recorded history (since 1896) Phoenix had three consecutive days in July with highs in the low 80s.
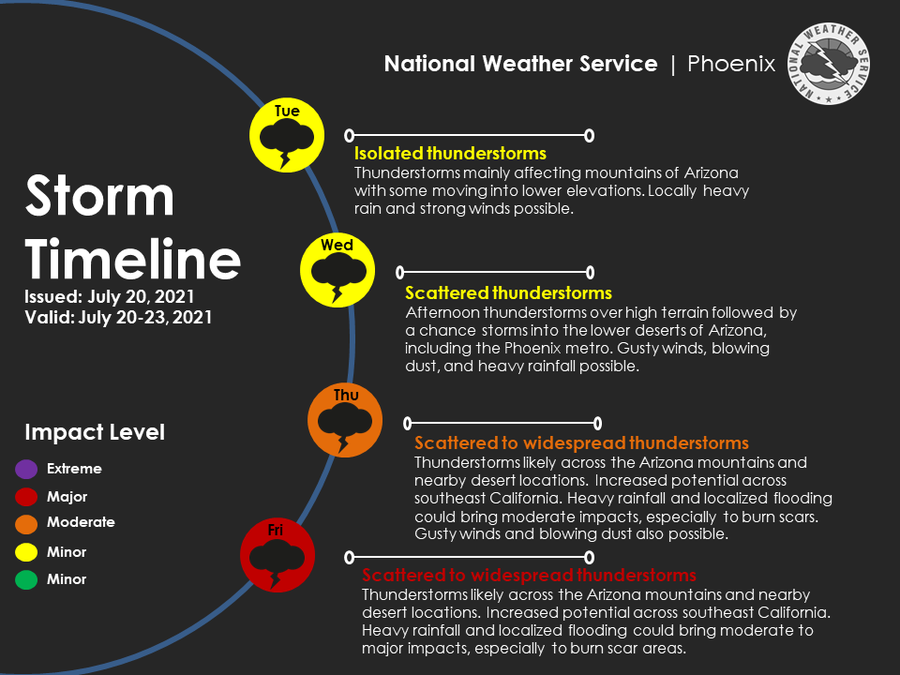
NWS Phoenix began highlighting the potential for an active monsoon period a week in advance. The Forecast Discussion on July 15, 2021 (https://mesonet.agron.iastate.edu/wx/afos/p.php?pil=AFDPSR&e=202107151011) noted a forecast pattern shift in weather model data, stating “This scenario could bring increased mid level east northeasterly flow which has in some past monsoon seasons led to organized MCSs tracking across portions of Arizona. We will definitely need to keep an eye on this potential as it could bring further heavy rain/flooding threats as well as widespread strong to severe winds.” The probability for rain within the Phoenix area for July 23, 2021 (the wettest day of the event) seven days prior was forecast at 40%, increasing to 70% the day of. As the event drew closer and confidence increased more information was highlighted through the office’s social media accounts.
Fig. 11. Graphic posted on social media on July 20, 2021 highlighting the potential for very active weather the following several days. https://twitter.com/NWSPhoenix/status/1417632740694892544
|
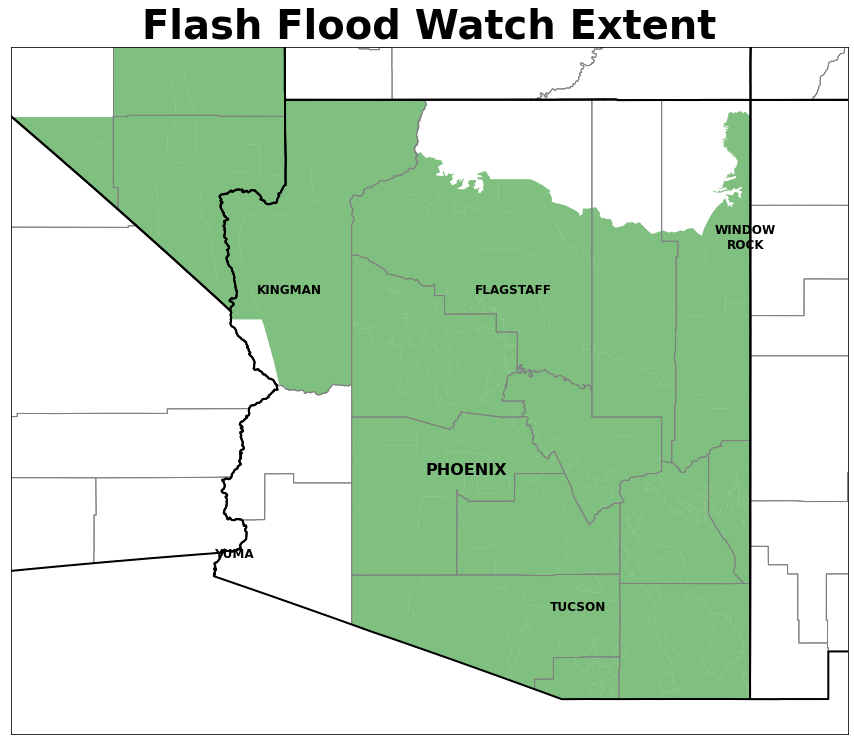
At 2 AM on July 21, 2021, a Flash Flood Watch was issued for much of Arizona, valid from 2 PM July 22 through 11 PM July 24. The Flash Flood Watch was extended on the afternoon of July 23 to last up to 12 AM on July 26. As the event unfolded, numerous weather alerts were issued by NWS offices, including 249 hydrologic alerts, 147 thunderstorm alerts, and 12 dust alerts. |
Fig. 11. Spatial extent of Flash Flood Watch issued for this event by NWS offices in Phoenix, Flagstaff, Tucson, and Las Vegas. |
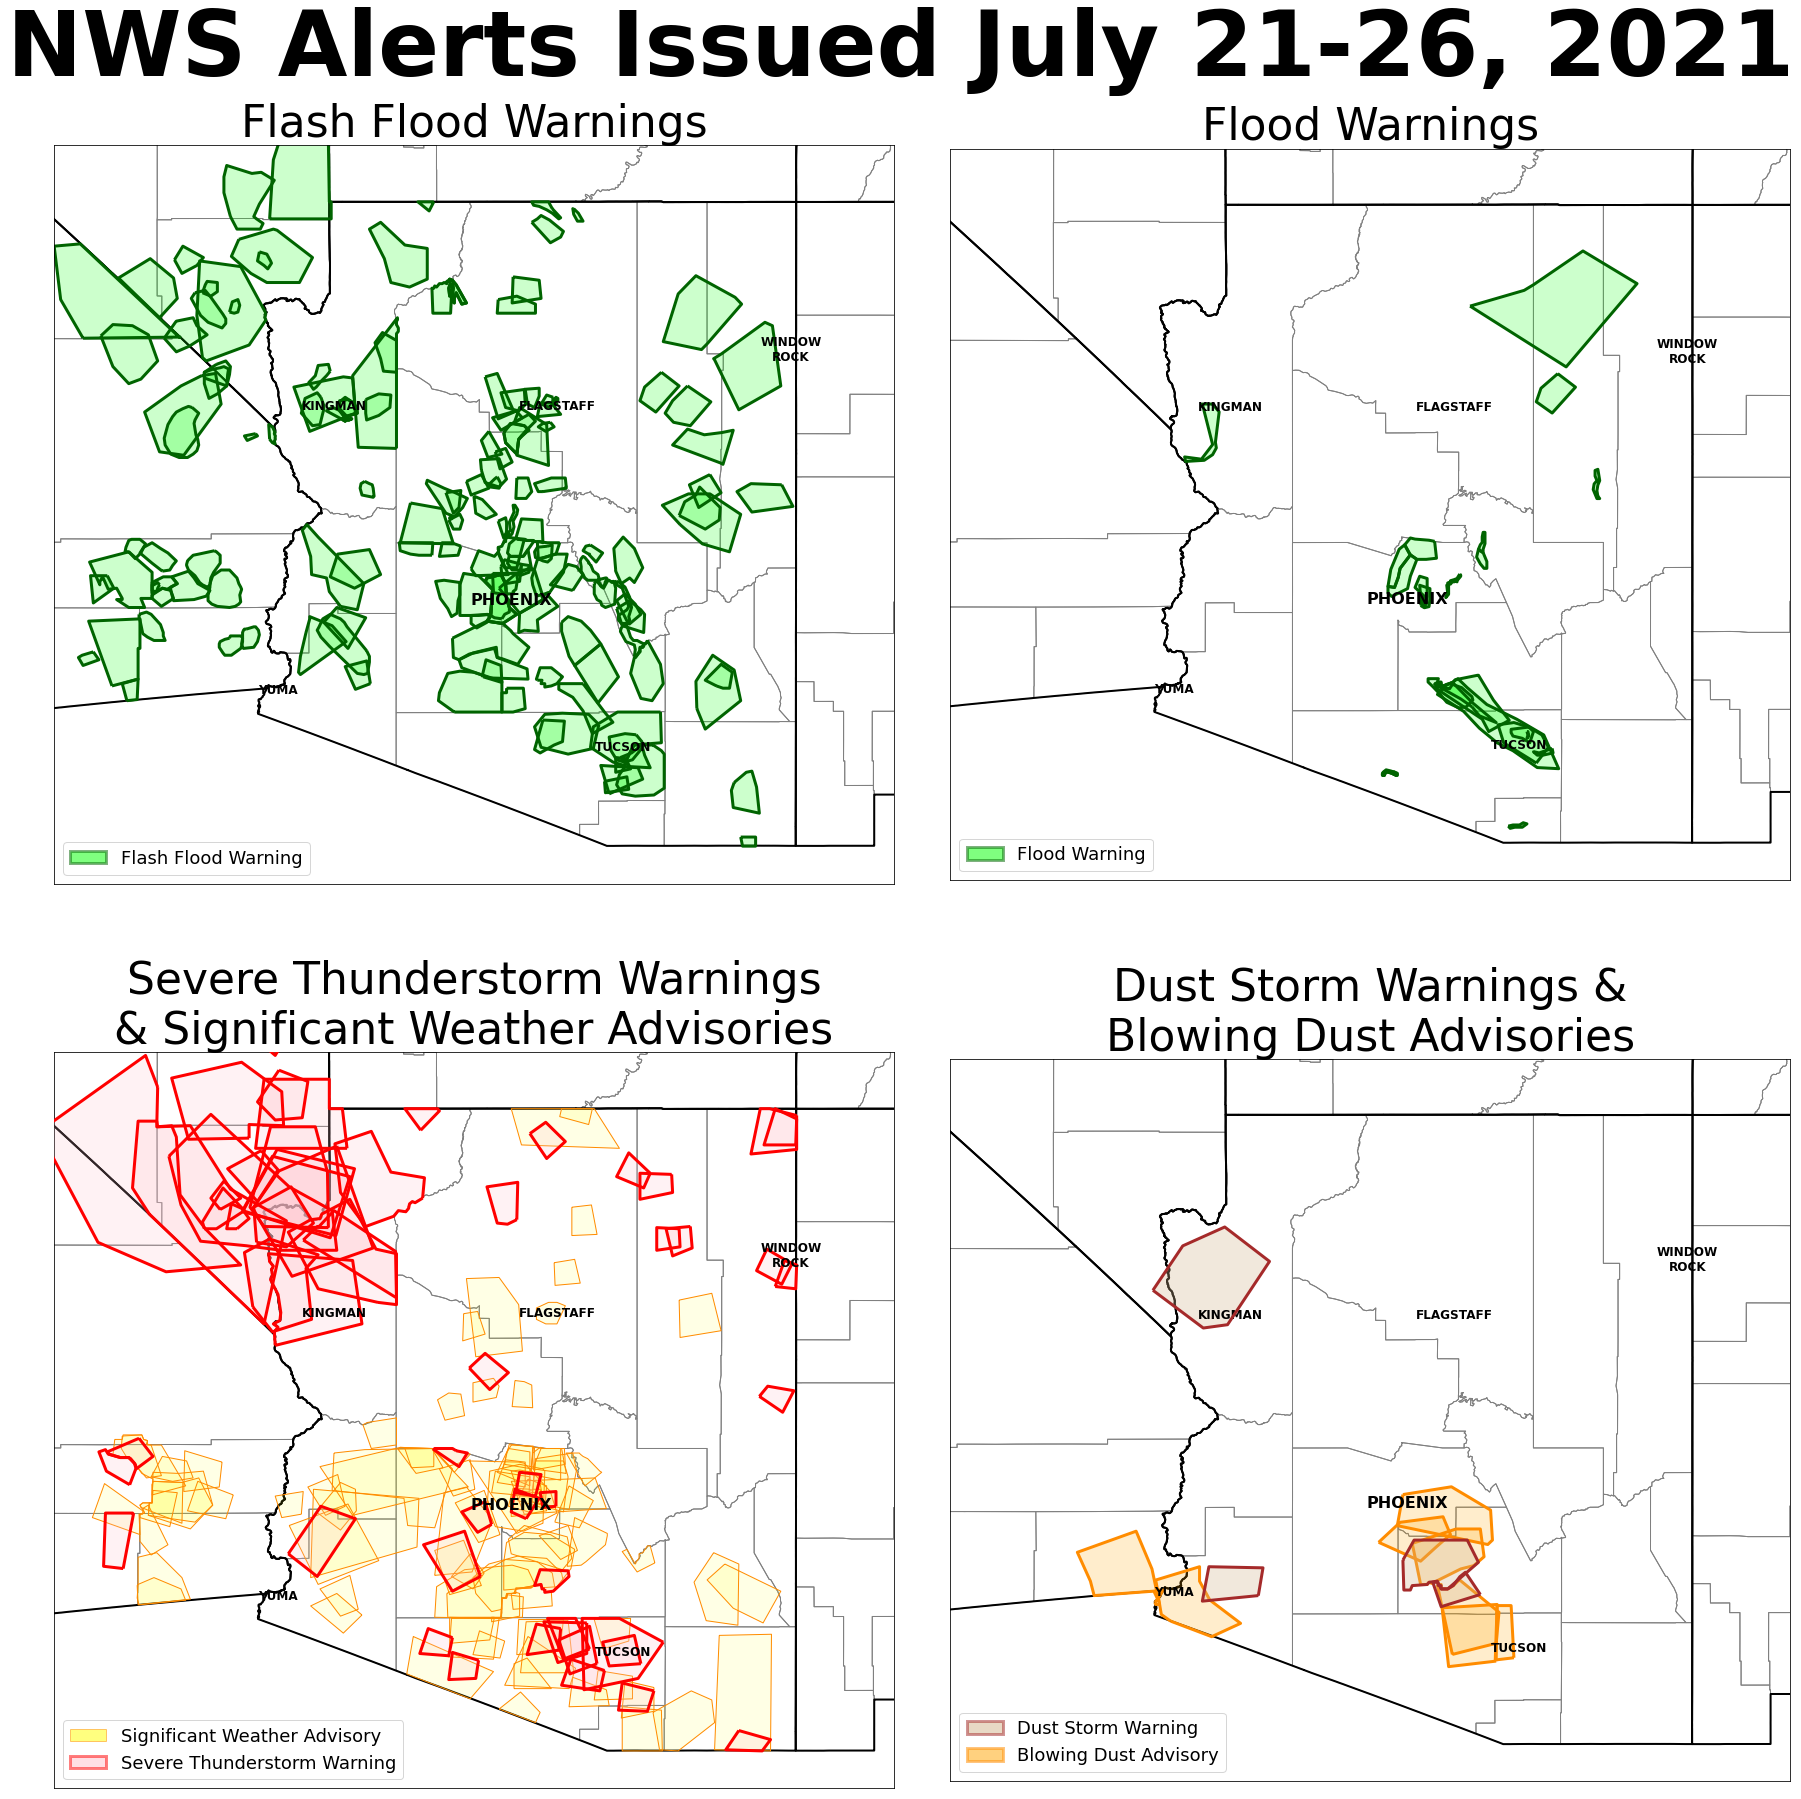
Fig. 12. Graphical depiction of location of various alerts issued by NWS during the multi-day event.