Drought Maintains Intensity with Precipitation Events Few and Far Between
|
 |
|
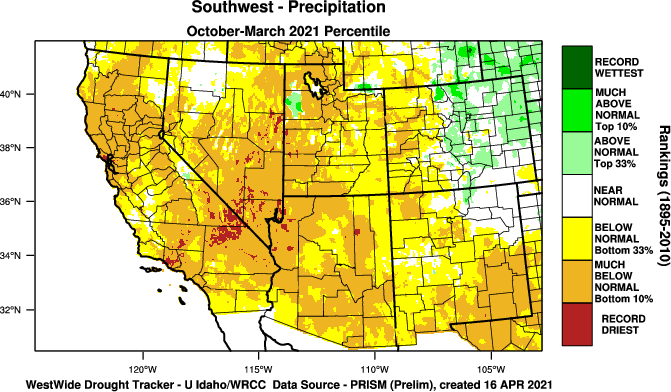
Summary: After a series of winter storms brought some minor drought relief to the area in January, drier weather has settled back into the region the past several months. Most communities have received only occasional, spotty precipitation this spring, and overall benefits have been muted and not sufficient to help drought conditions. The limited higher elevation snowfall will only result in minor runoff this year; and with the dry spring months now present, much of the region will have to wait until the summer monsoon for rainfall and potential drought relief. Much of the drought impacts have been focused in short term influences such as forage for ranchers, water availability for land based wildlife, and small stream flow for aquatic wildlife. Recent wetness during the past couple winter seasons has resulted in adequate long term hydrologic stability. However with reduced snow melt this year, reservoirs will experience little recharge.
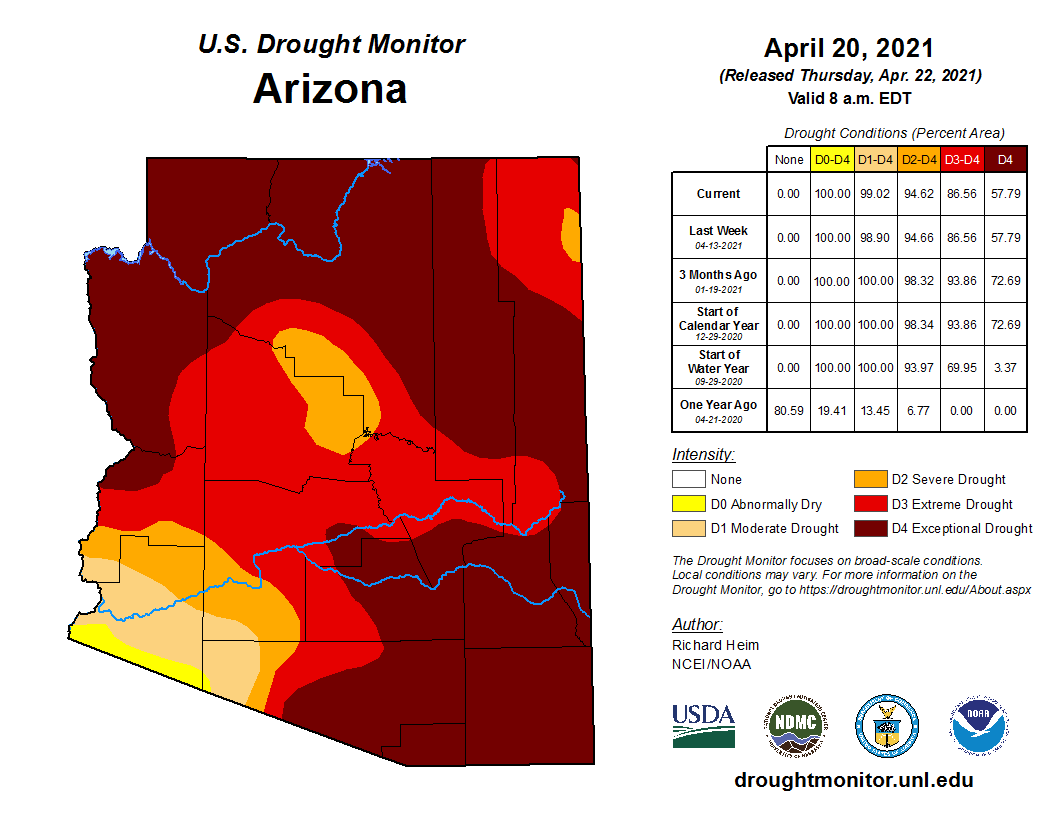
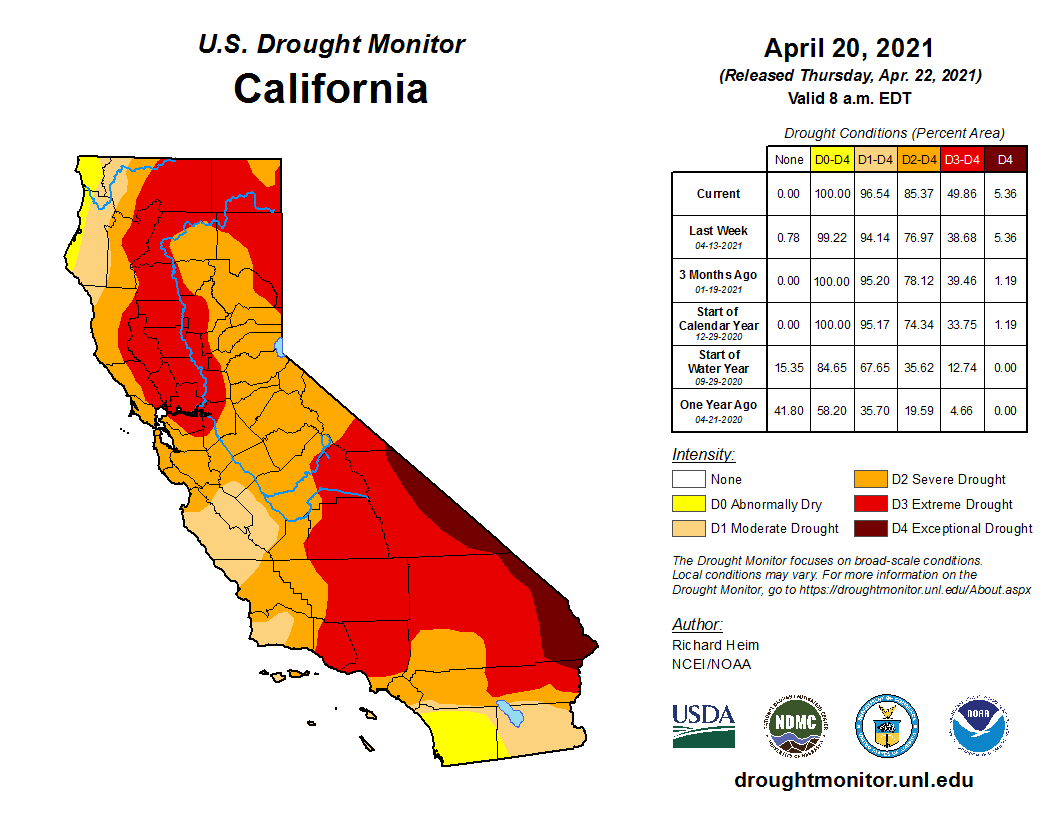
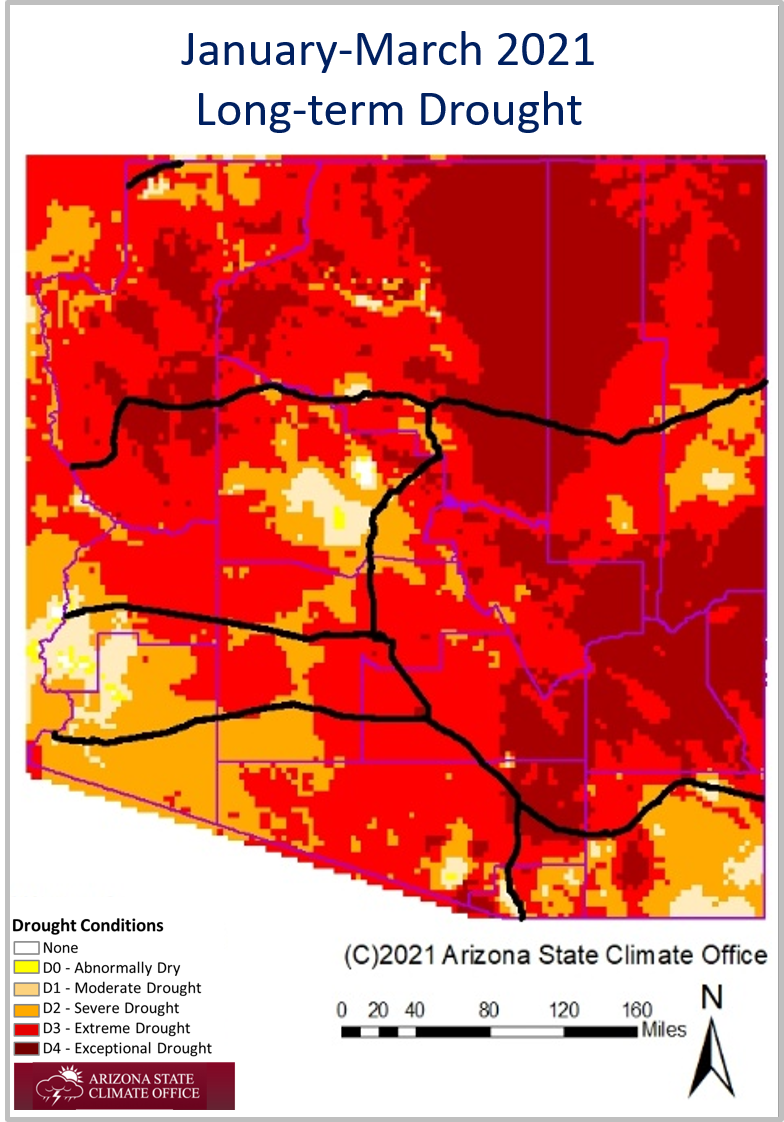
Local Area Affected: The National Drought Monitor depicts only minor deterioration of drought measures across Arizona and SE California. Exceptional Drought (D4) - parts of south-central and southwest Arizona In Arizona: far southeast Maricopa, southern Gila, eastern Pinal, and northern La Paz counties In SE California: far northeastern Riverside County Extreme Drought (D3) - across much of central, southern, and eastern Arizona and SE California In Arizona: much of Maricopa, western Pinal, and the majority of La Paz counties In SE California: most of eastern Riverside County Severe Drought (D2) - parts of southwest Arizona and SE California In Arizona: southern La Paz, northern Yuma and southwest Maricopa counties In SE California: small part of Riverside County Moderate Drought (D1) - southwest Arizona and SE California In Arizona: southern Yuma County In SE California: Imperial County Abnormally Dry (D0) - southwest Arizona and SE California In Arizona: far southern Yuma County In SE California: far southwest Imperial County
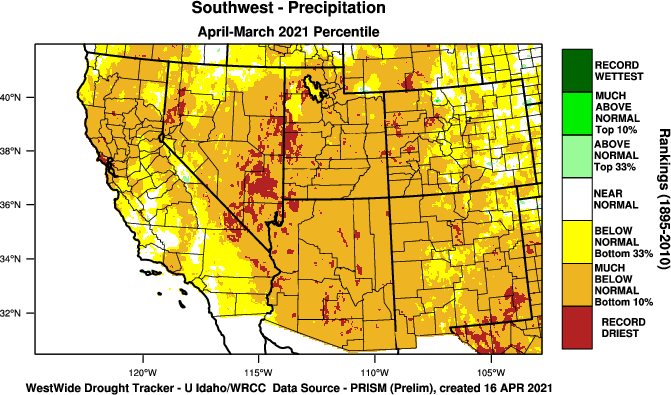
Local Climatology: Below are precipitation totals since the beginning of the 2020-21 Water Year from selected locations across Arizona and southeast California:
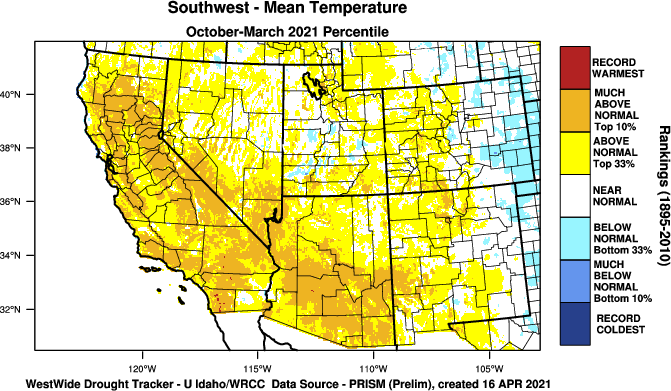
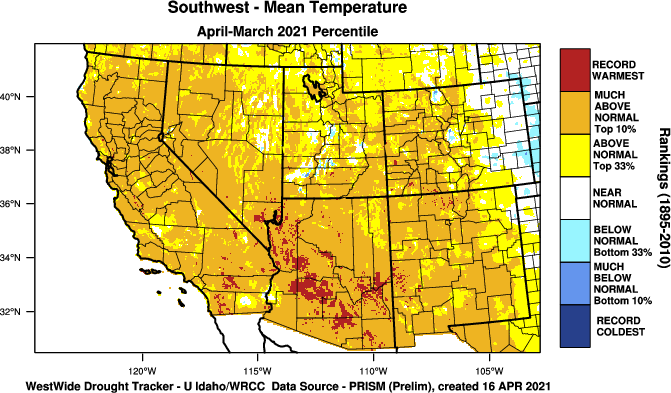
In addition to the precipitation deficit, drought conditions have worsened and expanded more rapidly as a result of extreme temperatures. Precipitation deficits over the past year are very near or at record low levels for many locations in the Southwest. Add in the near record to record heat over the past year, and it's fairly clear why Extreme and Exceptional Drought covers much of the Southwest.
|
The U.S. Drought Monitor is a weekly collaborative effort between a number of federal agencies including NOAA/NWS, U.S. Department of Agriculture and the National Drought Mitigation Center. Details and explanations of the Drought Monitor can found at the web site: http://droughtmonitor.unl.edu/ The categories of drought are defined as follows: Moderate Drought (D1) - Some damage to crops, pastures; fire risk high; streams, reservoirs, or wells low, some water shortages developing or imminent, voluntary water use restrictions requested. Severe Drought (D2) - Crop or pasture losses likely; fire risk very high; water shortages common; water restrictions imposed. Extreme Drought (D3) - Major crop/pasture losses; extreme fire danger; widespread water shortages or restrictions. Exceptional Drought (D4) - Exceptional and widespread crop/pasture losses; exceptional fire risk; shortages of water in reservoirs, streams, and wells, creating water emergencies. |
|
State and Local Actions: A Drought Emergency Declaration remains in effect for the state of Arizona as signed by the governor in accordance with the Arizona Drought Preparedness Plan. The continuation of this Drought Emergency has been recommended by the Drought Interagency Coordinating Group in their bi-annual meeting on November 10, 2020. This recommendation is based on long term precipitation deficits, along with ongoing negative impacts across the state. The next Drought Interagency Coordination Group meeting is scheduled for May 11, 2021.
|
Additional information concerning the drought in Arizona can be obtained via the Arizona Department of Water Resources web site at: https://new.azwater.gov/drought Additional information concerning the drought in California can be obtained via the California Department of Water Resources web site at: |
|
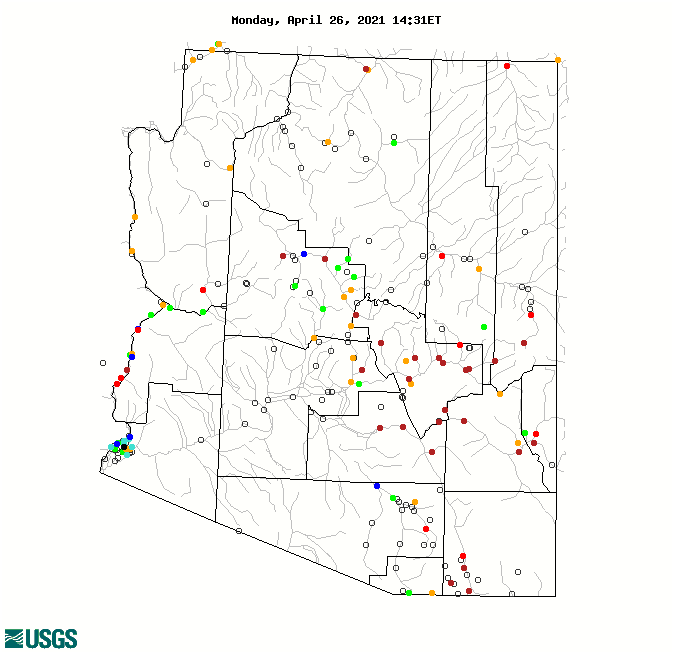
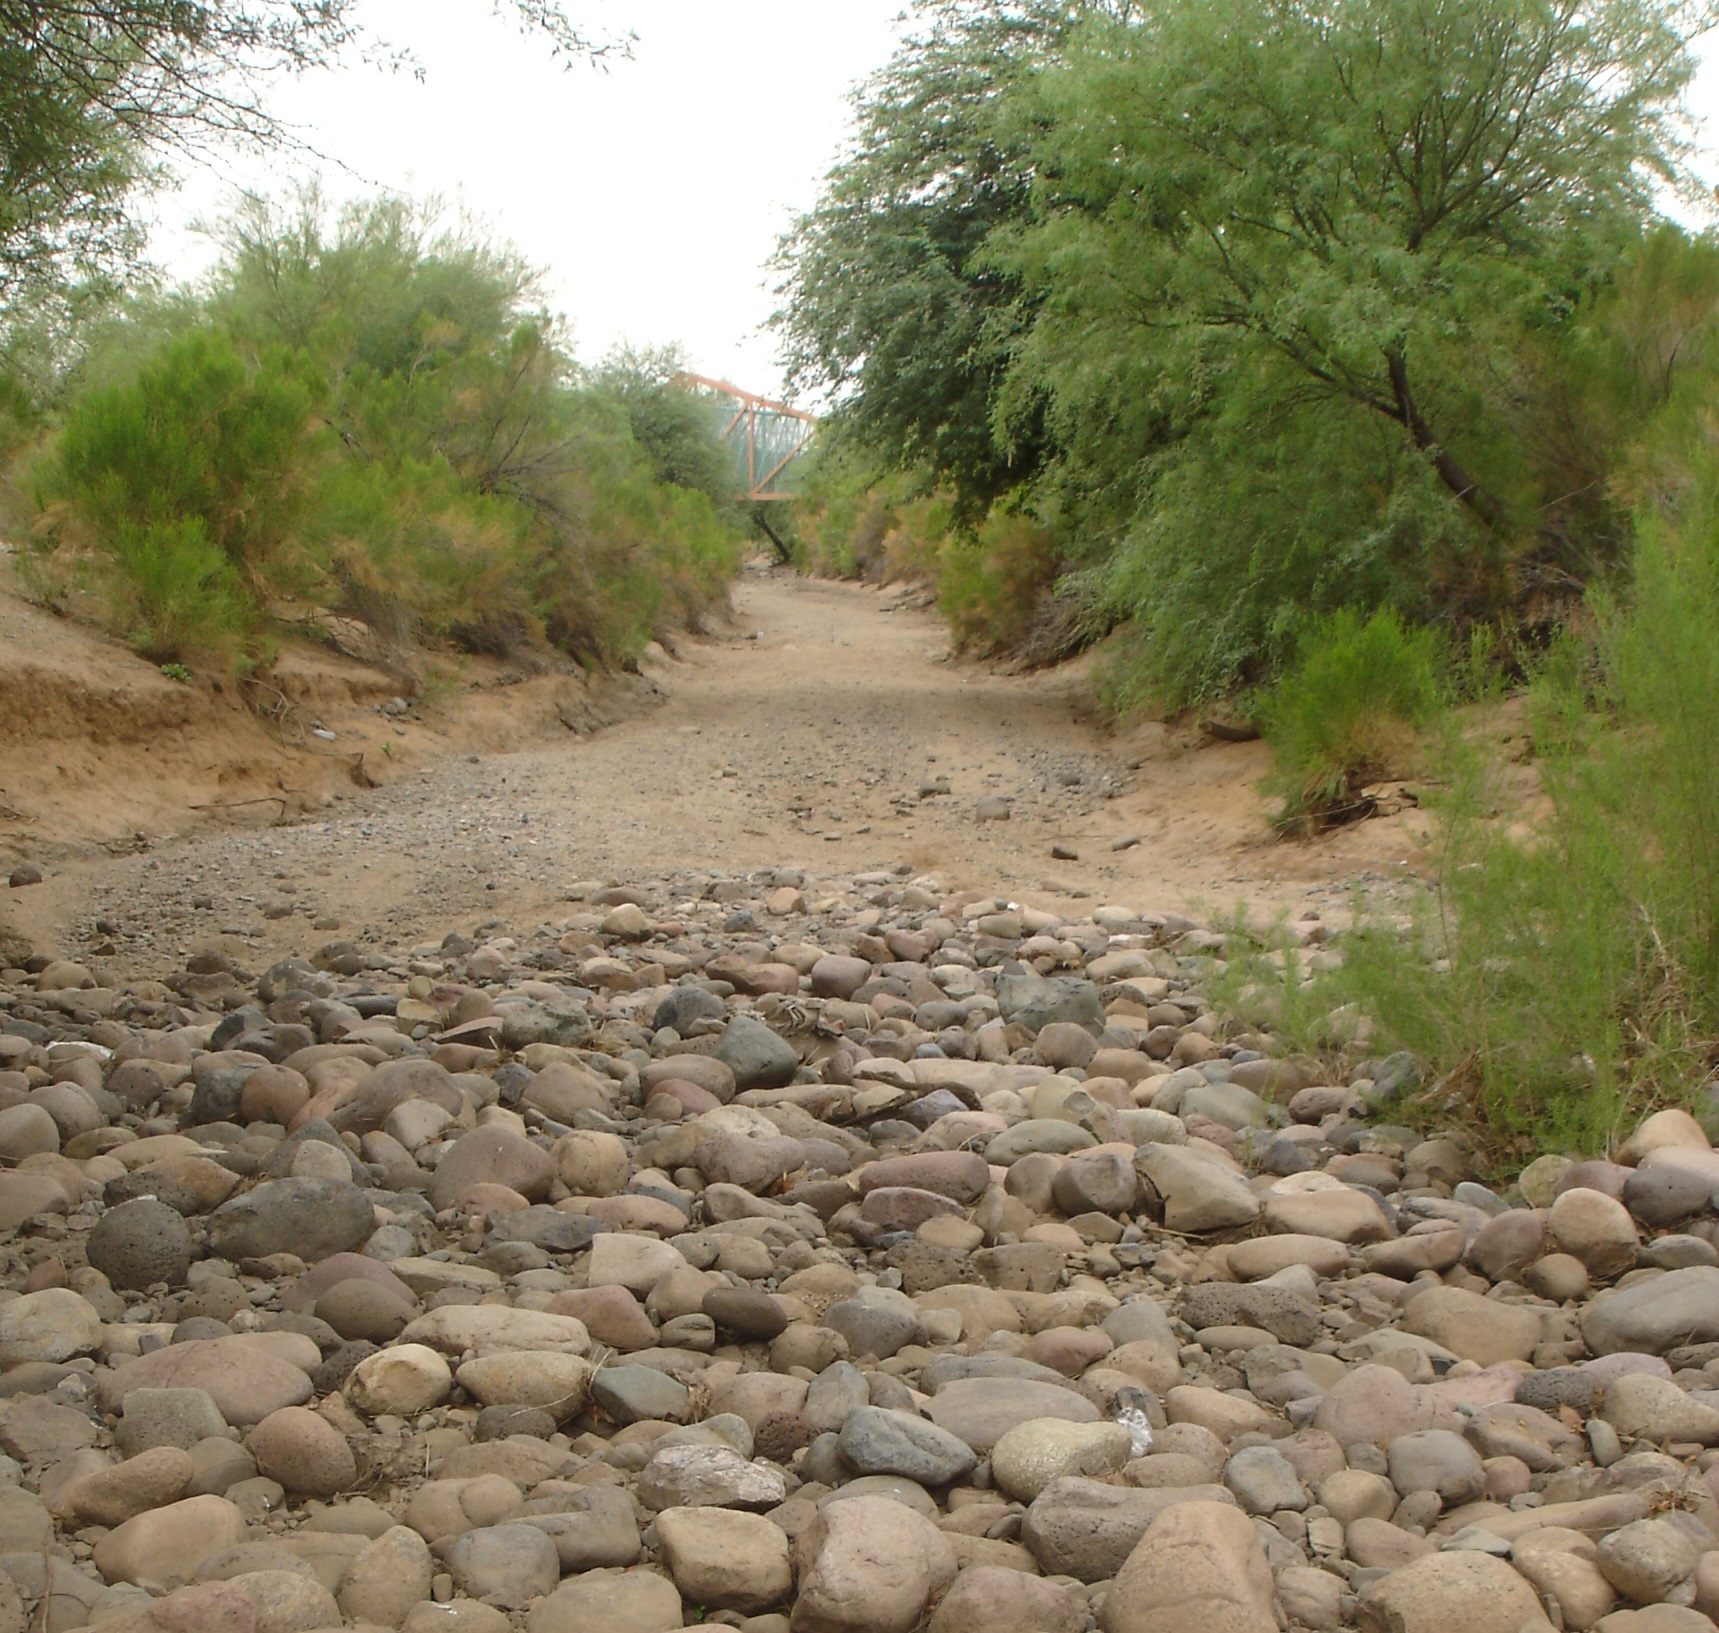
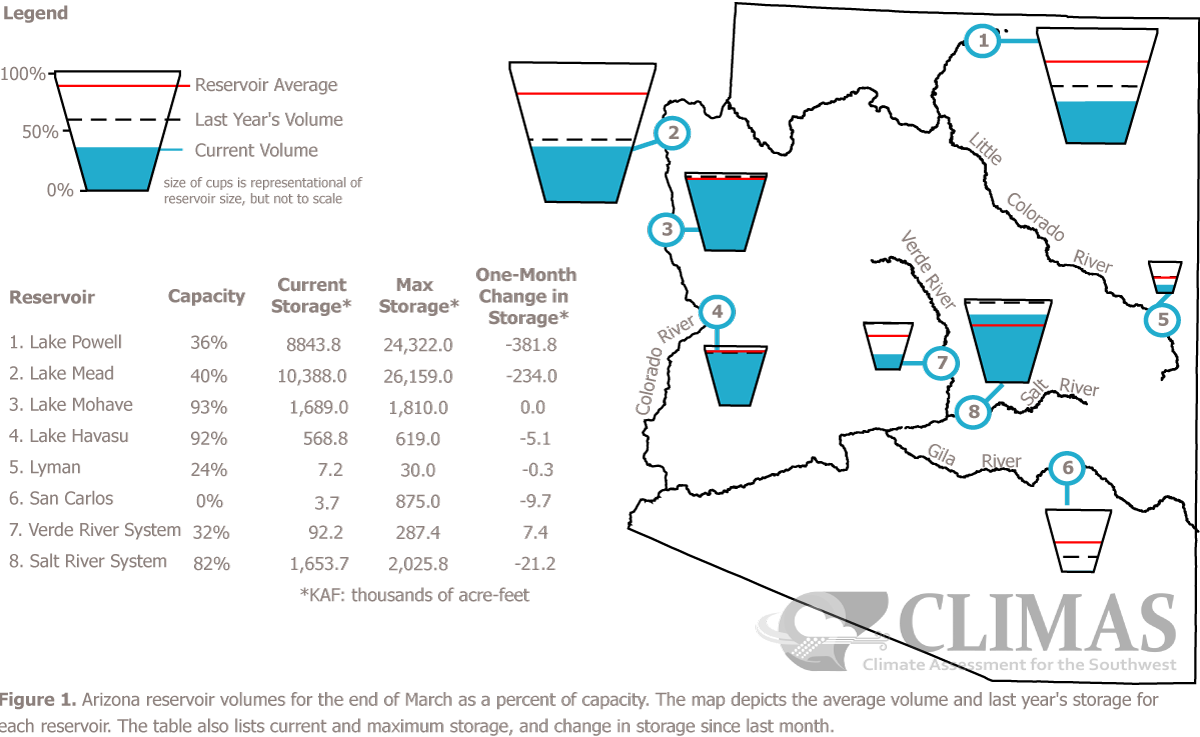
River, Stream Flow, and Reservoir Conditions: Flow on smaller streams throughout Arizona continues to worsen resulting from the lack of precipitation the past 12 months. For the most part, snow melt has been intermittent and modest yielding limited response on higher terrain small streams. Forecast runoff the remainder of the spring has been adjusted downward, and little improvement to streamflow should be expected the remainder of the spring. The more highly regulated larger rivers remain in a near normal flow rates due to continual management efforts.
Dry weather during the fall and early winter was a detriment on the Salt and Verde systems with record low inflows reported. However, excellent winter precipitation in the past 2 years has left the system in good shape. A brief period of rain and snow in January helped the system, however limited snowfall since has allowed runoff to lag well behind average. Total system forecast spring runoff has been adjusted down given the below average snowfall and impact of record warmth lessening soil moisture and encouraging recharge versus runoff.
|
Hourly and forecast river stages out to 90 days can be found at the National Weather Service's (NWS) Advanced Hydrologic Prediction Service (AHPS) web page: http://water.weather.gov/ahps2/index.php?wfo=psr Additional Current stream and river stages may be viewed at the following USGS Web Site: |
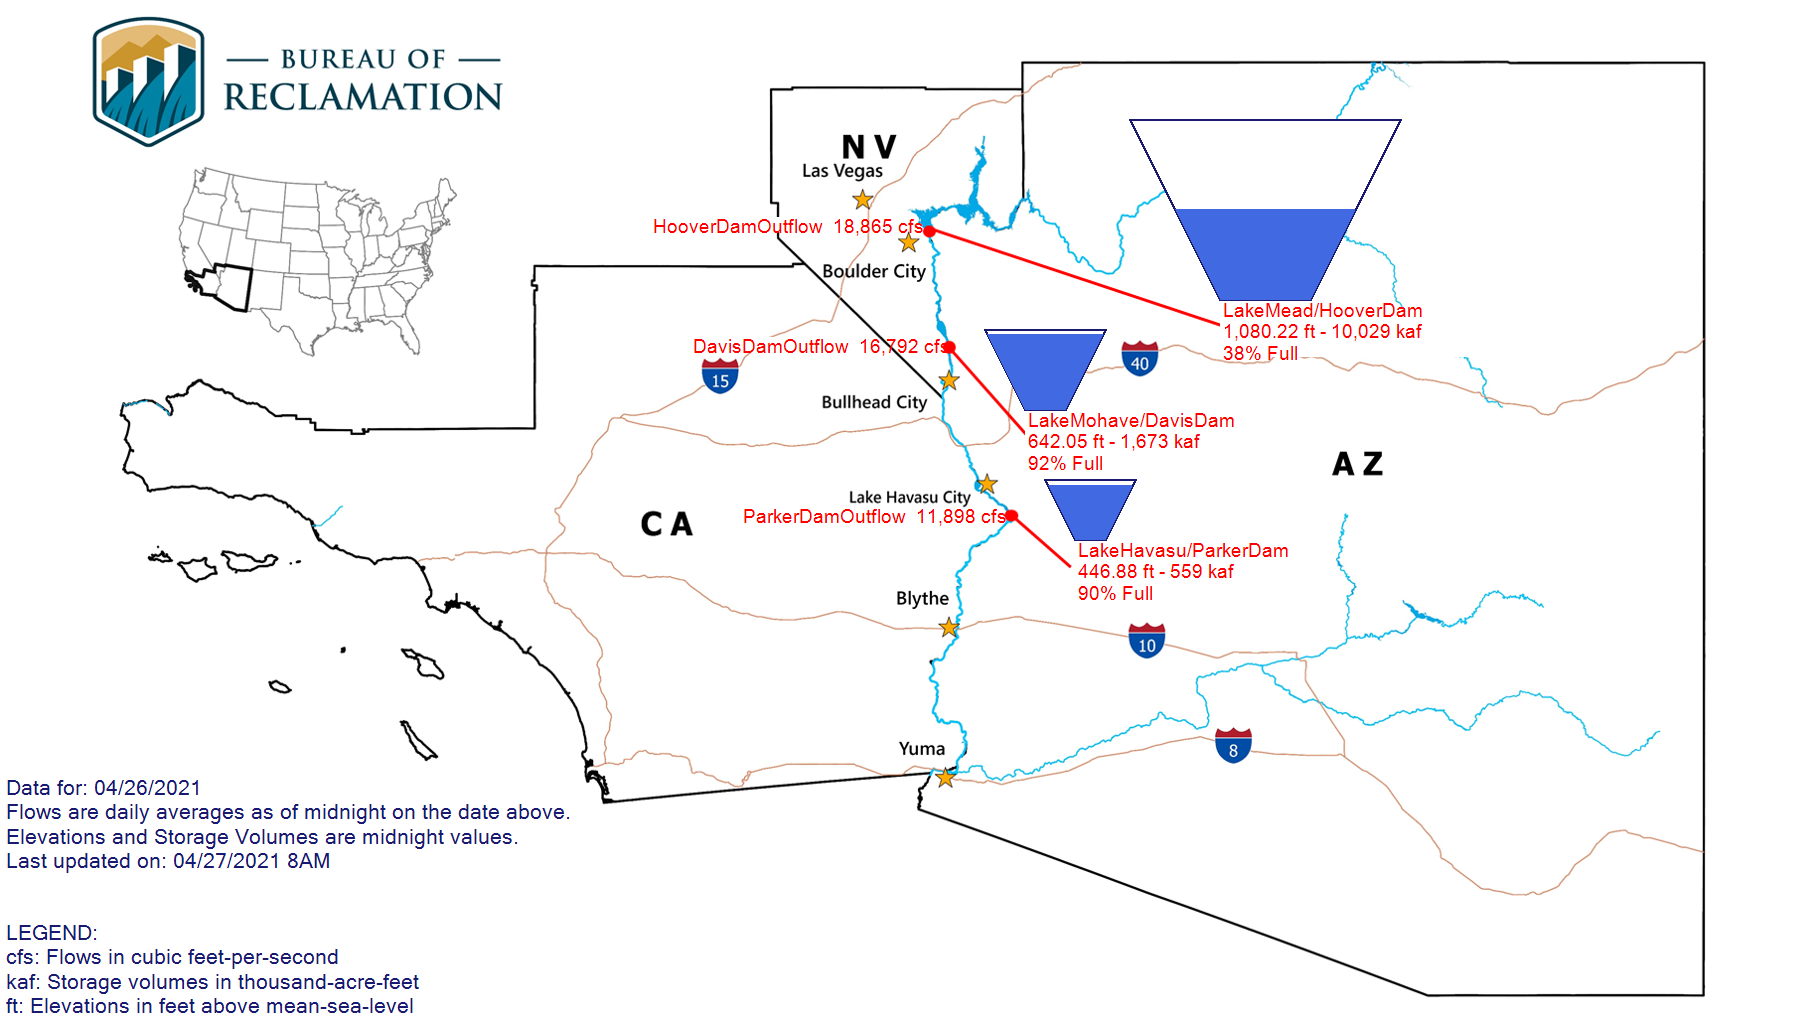
Despite adequate storage levels within the Salt-Verde basin, the greater Colorado
River basin has been hit by multiple years of drought and overextended usage. As
a result, Arizona Department of Water Resources (ADWR) and Central Arizona
Project (CAP) have issued a joint statement describing and expected Tier 1 shortage
level beginning in 2022.
|
Agriculture Impacts: Rangeland and pasture conditions remain mostly in a poor to very poor condition. 88% of the state pasture land rated as poor to very poor compared to just 13% at this time last April, and the 5-year average of 24%. January rainfall aided topsoil moisture somewhat, however recent dry weather has negated this effect. Forage area remains depleted and lack of rainfall this April has reduced typical spring growth. Reports continue to indicate many stock ponds low or empty requiring water hauling. Thus far, ranchers have experienced the worst impacts from this extreme and exceptional drought.
|
For additional information on agriculture impacts may be viewed at the United States Department of Agriculture (USDA) National Agricultural Statistics Service NASS Web Site: |
|
Fire Danger Hazards: The National Fire Danger Rating: Moderate to Very High category across the region The current KDBI: Southwest Arizona and southeast California: Ranging from Extreme lower elevations of SE California and southern Arizona and Moderate in some of the higher elevations of northern and eastern Arizona
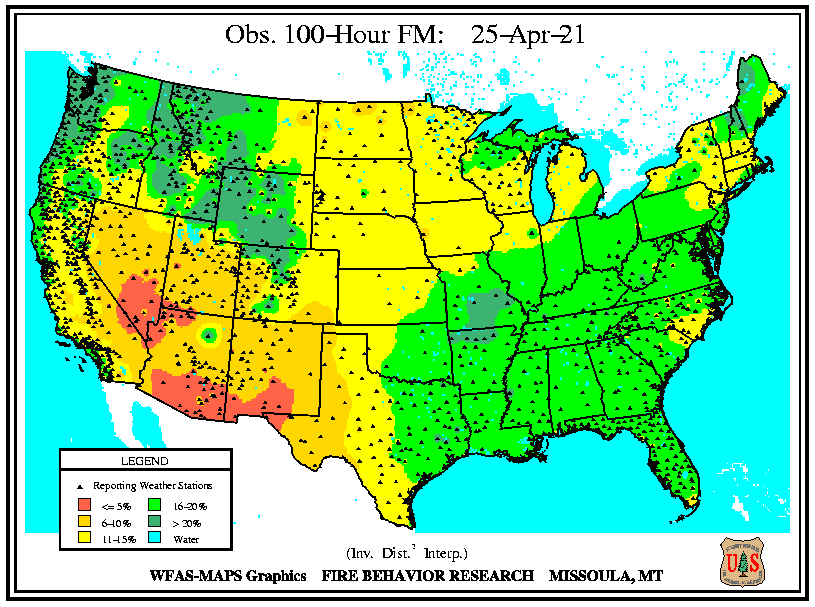
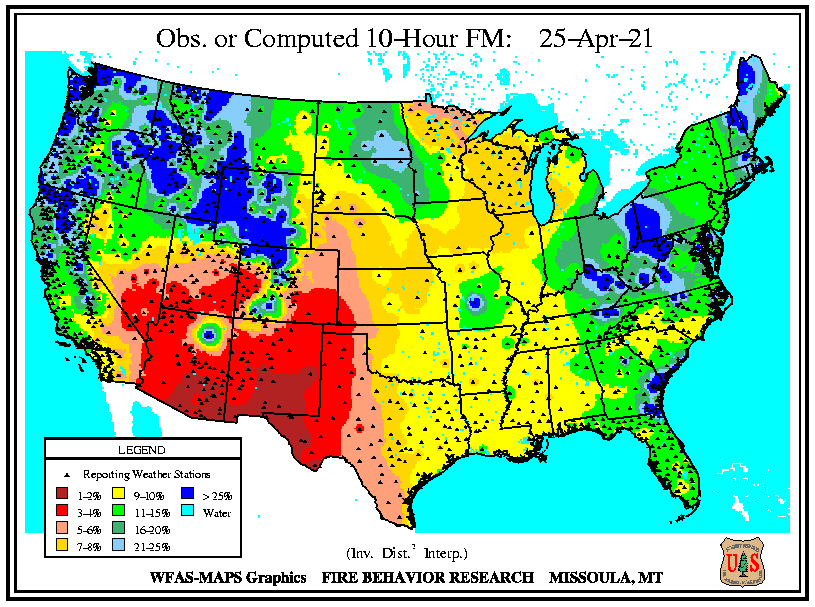
Ample precipitation during the beginning of 2020 spurred growth of fine 1 and 10-hour fuels along with some 100-hour fuels in lower elevations. Wildfires were a tremendous problem in Arizona last year with over 959,000 acres burned in the state - almost double the previous 2 years combined. A series of winter storm systems in January brought welcome rain and snow along with much colder temperatures to the region. This helped the lessen the fire threat, however the return to a typically dry spring pattern has allowed dead fuel moisture to dry. 100-hour dead fuel moisture has deteriorated below 5% at lower elevations and into a 6-10% range across higher terrain. 10-hour dead fine fuels are now ripe to burn falling into a 3-4% range. The long standing drought combined with ample fuels and the building hot weather over the next several months will likely result in another dangerous fire season across the Southwest.
|
The Keetch-Byram Drought Index (KBDI) is a drought index that is specifically related to fire potential. The KDBI is broken into four categories which indicate the susceptibility of ground fuels to fire danger. Below are the four categories and a brief description of each.
KBDI and Dead Fuel Moisture data can be found on the Wildland Fire Assessment System (WFAS) web site at: |
||||||||||||
|
Precipitation/Temperature Outlooks: The 8-14 day temperature outlook for May 4-10 period calls for somewhat better chances of above average temperatures and best odds in a near normal rainfall range. The 90 day outlook for the period May through July 2021 indicates much better chances for above average temperatures and equal chances for above, near, or below normal precipitation.
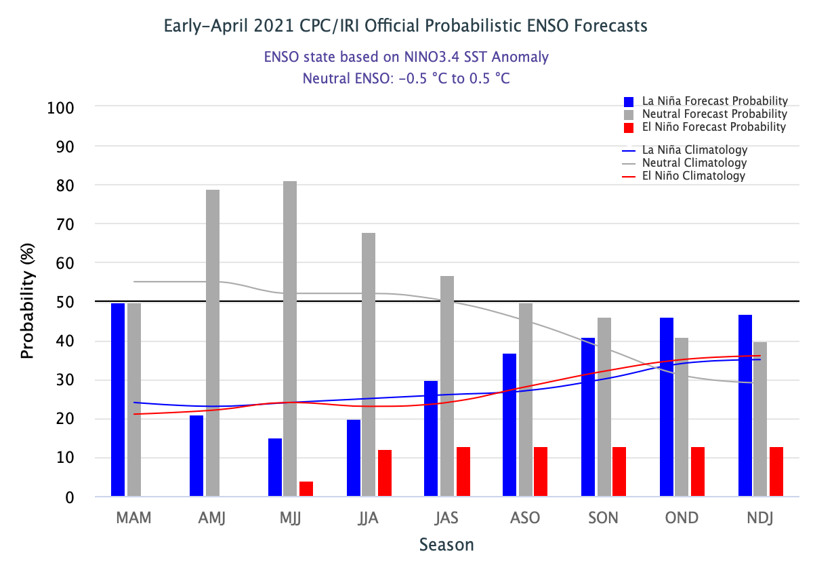
La Nina peaked in the tropical Pacific during the winter with sea surface temperatures now moderating closer to average. Models suggest a transition towards a neutral state by early summer, as the general La Nina circulation pattern breaks down. Overall, winter 2020-21 was fairly typical for La Nina in the Southwest. The region now heads into a typically dry spring period where most locations receive little to no additional precipitation in a typical year; and these locations will need to wait until the summer monsoon for realistic drought improvement.
|
For updated temperature and precipitation probabilities consult the following Climate Prediction Center (CPC) Web Sites: 8 to 14 Day Outlook: http://www.cpc.ncep.noaa.gov/ 30 Day Outlook: http://www.cpc.ncep.noaa.gov 90 Day Outlook: |
|
Questions or Comments: If you have any questions or comments about this information |
Other Contacts: For state climate impacts: http://www.stateclimate.org |
|
Acknowledgements: The Drought Monitor is a multi-agency effort involving NOAA’s National |
Related Websites : NWS - http://www.weather.gov/phoenix CPC - http://www.cpc.ncep.noaa.gov Drought Monitor - http://droughtmonitor.unl.edu/ |