August of 2025 saw a meandering ridge of high pressure across the Rockies, which brought periods of very warm and dry conditions, as well as cooler and wetter periods. There were also periods of severe weather and heavy monsoon rainfall across portions of south central and southeast Colorado, especially in the last 10 days of the month. For the month as a whole, at to above normal temperatures were experienced across south central and southeast Colorado, save for pockets of below normal temperatures across the southeast plains. As for precipitation, below normal amounts were generally experienced across south central Colorado, with near to below normal precipitation across southeast Colorado, save for pockets of above normal precipitation across the plains.
The following graphics depict monthly temperature and precipitation departures from normal across the state for the past month of August.
.png) |
.png) |
The preliminary average temperature in Alamosa for the past month of August was 64.3 degrees. This is 1.1 degrees above normal and makes August of 2025 tied as the 16th warmest August on record. This remains below the warmest August of 2024, when the average August temperature was 66.1 degrees. The average August maximum temperature in Alamosa was 83.0 degrees, which is 2.5 degrees above normal. The average August minimum temperature in Alamosa was 45.6 degrees, which is 0.2 degrees below normal. Alamosa recorded 0.40 inches of precipitation through the month of August. This is 0.89 inches below normal and makes August of 2025 the 11th driest August on record. This is remains ahead of the driest August of 2021 when only 0.10 inches of precipitation was recorded in Alamosa. (ALS POR: 1932-2024)
.png) |
.png) |
The preliminary average temperature in Colorado Springs for the past month of August was 70.3 degrees. This is 0.2 degrees above and makes August of 2025 tied as the 28th warmest August on record. This remains well behind the warmest August of 2011, when the average August temperature was 74.1 degrees. The August average maximum temperature in Colorado Springs was 84.0 degrees, which is 0.4 degrees above normal. The average August minimum temperature in Colorado Springs was 56.5 degrees, which is 0.1 degrees below normal. Colorado Springs recorded 3.15 inches of precipitation through the month of August. This is 0.19 inches above normal and makes August of 2025 the 39th wettest August on record. This remains well below the wettest August of 1929, when 7.09 inches of precipitation was recorded in Colorado Springs. Of note, most of this precipitation (3.07 inches) was recorded in a 9 day period at the end of the month (August 22nd-30th). While this may seem like a lot of precipitation in short span of time, it only ranks as the 50th greatest amount in any 9 day period through the month of August in Colorado Springs. The greatest amount recorded in any 9 day August period was between August 1st-9th, 1999, when 6.66 inches of precipitation was recorded in Colorado Springs. (COS POR: 1894-2024)
.png) |
.png) |
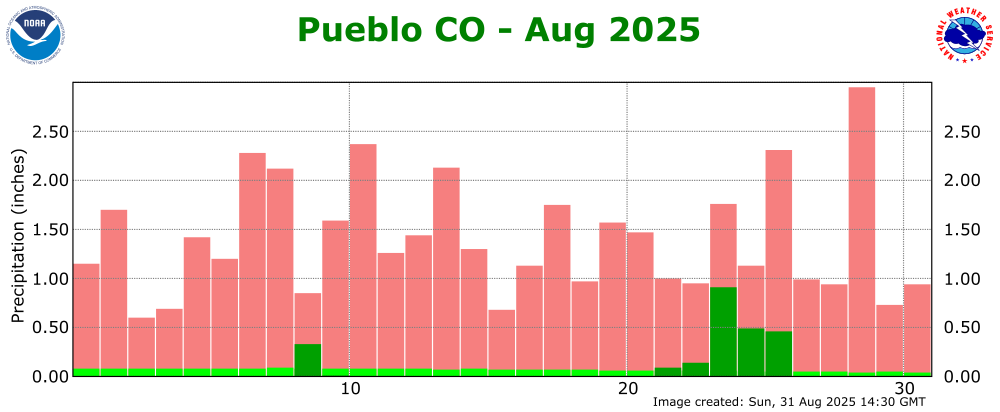
The preliminary average temperature in Pueblo for the past month of August was 75.3 degrees. This is 0.5 degrees above normal and makes August of 2025 tied as the 29th warmest August on record. This remains well behind the warmest August of 1970, when the average August temperature was 79.8 degrees. The average August maximum temperature in Pueblo was 91.5 degrees, which is 1.3 degrees above normal. The average August minimum temperature in Pueblo was 59.2 degrees, which is 0.2 degrees below normal. Pueblo recorded 2.43 inches of precipitation through the month of August. This is 0.32 inches above normal and makes August of 2025 tied as the 40th wettest August on record. This remains well behind the wettest August of 1955 when 5.85 inches of precipitation was recorded in Pueblo. Of note, most of this precipitation (2.09 inches) was recorded in a 5 day period at the end of the month (August 22nd-26th). While this may seem like a lot of precipitation in short span of time, it only ranks as the 52nd greatest amount in any 5 day period through the month of August in Pueblo. The greatest amount recorded in any 5 day August period was between August 18th-22nd, 1984, when 3.62 inches of precipitation was recorded in Pueblo. (PUB POR: 1888-2024)
.png) |
 |
Looking ahead into September in Alamosa, the average high and low temperature of 78 degrees and 42 degrees on September 1st, cool to 70 degrees and 32 degrees by the end of the month. The average temperature for the month of September in Alamosa is 55.9 degrees. Alamosa averages 0.98 inches of precipitation and 0.5 inches of snow in the of month of September. On average, Alamosa has its 1st freeze of the year on September 11th.
In Colorado Springs, the average high and low temperature of 81 degrees and 54 degrees on September 1st, cool to 72 degrees and 43 degrees by the end of the month. The average temperature for the month of September in Colorado Springs is 63.0 degrees. Colorado Springs averages 1.35 inches of precipitation and 0.2 inches of snow in the month of September.
In Pueblo, the average high and low temperature of 88 degrees and 56 degrees on September 1st, cool to 77 degrees and 43 degrees by the end of the month. The average temperature for the month of September in Pueblo is 66.6 degrees. Pueblo averages 0.65 inches of precipitation and 0.2 inches of snow in the month of September.
Below is the Climate Prediction Center's (CPC) temperature and precipitation outlook for September of 2025, which leans to above normal temperatures and equal chances of above, below and near normal precipitation across south central and southeast Colorado, save for a slight nod to above normal precipitation across the far southeast Plains.
 |
 |

