| February 2026 Monthly Review for Tucson |
| Warmest and 27th driest on record |
| |
|
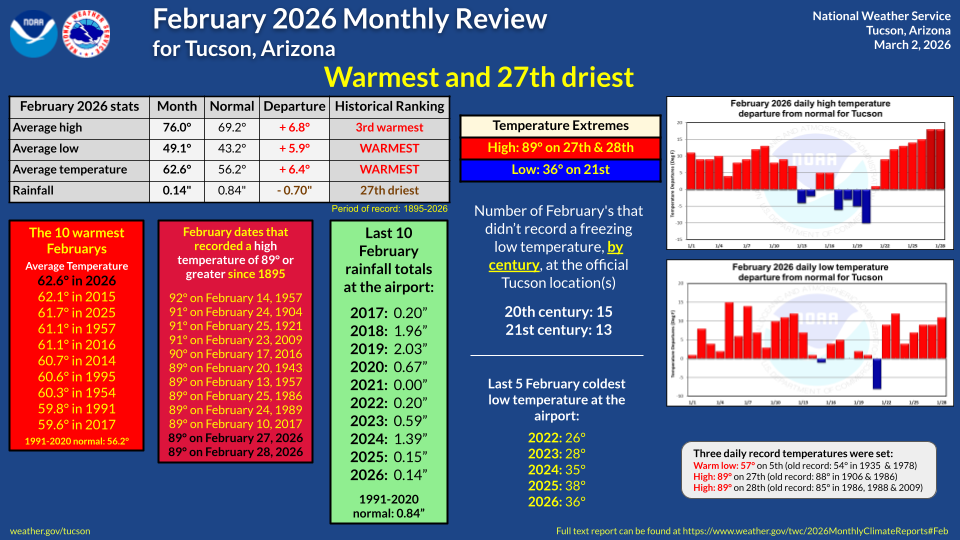
Dominated by high pressure for most of the month, February set a new milestone as the warmest on record.
|
| |
| The month opened with a warm stretch through the 13th, featuring highs in the 70s to lower 80s and lows ranging from the 40s to mid-50s. This was interrupted on the 13th and 14th by a Pacific system that brought light rain, breezy winds, and cooler highs in the 60s. Following a brief rebound with high temperatures into the lower 70s on the 15th and 16th, a second Pacific system kept high temperatures in the low-to-mid 60s through the 20th, along with some light rain and breezy conditions. The month concluded with a dry conditions and a significant warming trend, culminating in record-breaking highs on the 27th and 28th. |
| |
|
The monthly average temperature of 62.6° is 6.4° above normal and ranks as the warmest February on record. Temperature extremes for the month ranged from a high of 89° on the 27th & 28th to a low of 36° on the 21st. This is the 28th February on record in which the official site didn't record a low temperature of 32° or colder. Daily record temperatures were set on the 5th (warm low; 57°, old record 54° in 1935 & 1978), 27th (high; 89°, old record 88° in 1906 & 1986) and 28th (high; 89°, old record 85° in 1986, 1988 & 2009).
|
| |
|
Rainfall amounts varied across the metro area (per sources like rainlog.org, Pima County Regional Flood Control District, and CoCoRaHS), generally ranging from 0.10" to 0.40", with isolated totals reaching up 0.60". The Tucson International airport, the official recording location, recorded 0.14" which seven-tenths of an inch below normal and ranks as the 27th driest February on record.
The first five months of the hydrological water year, October through February, have been rather wet with 5.32" being recorded at the airport. This ranks as the 33rd wettest first five months of the water year on record.
|
| |
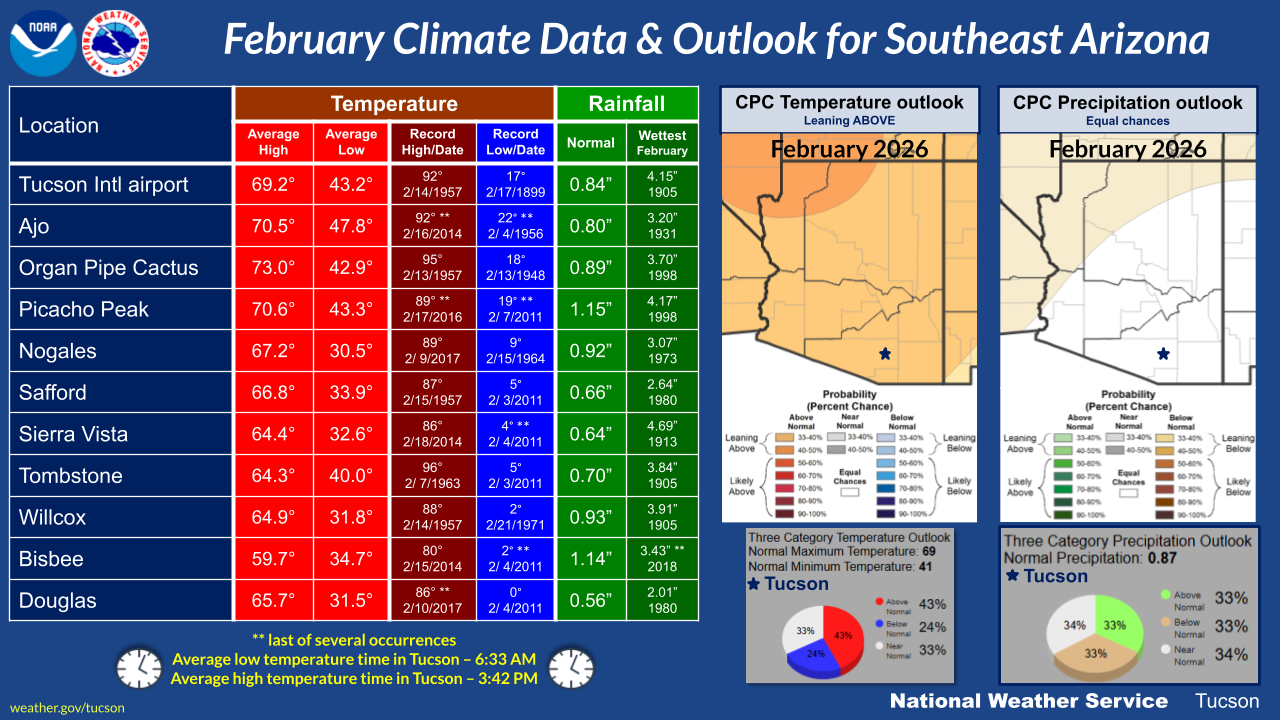
| February 2026 stats |
Month
|
Normal
|
Departure
|
Historical Ranking
|
| Average high temperature |
76.0°
|
69.2°
|
+ 6.8°
|
3rd warmest
|
| Average low temperature |
49.1°
|
43.2°
|
+ 5.9°
|
WARMEST
|
| Average temperature |
62.6°
|
56.2°
|
+ 6.4°
|
WARMEST
|
| # of days w/lows 32° or colder |
0
|
2
|
- 2 |
28th Feb with 0 |
| Rainfall |
0.14"
|
0.84"
|
- 0.70"
|
27th driest
|
| Water year rainfall (Oct-Feb) |
5.32"
|
3.87"
|
+ 1.45"
|
33rd wettest
|
|
Period of record: 132 years (1895-2026)
|
|
| |
|
| |
| Winter 2025-2026 Seasonal Review for Tucson |
| Warmest and 62nd wettest on record |
| |
|
La Niña conditions were forecast for the 2025-26 Winter season. Under the majority of La Niña conditions, a drier than normal winter typically occurs across the desert southwest. The Climate Prediction Center temperature and precipitation outlooks for Tucson called for the following:
- a 53% chance that the seasonal mean temperatures will be above normal
- a 14% chance that the seasonal mean temperatures will be below normal
- a 37% chance that the seasonal total precipitation will be below normal
- a 30% chance that the seasonal total precipitation will be above normal
|
| |
|
The monthly historical breakdowns were:
- December: Warmest and 49th driest on record
- January: 10th warmest and 21st wettest on record
- February: Warmest and 27th driest on record
|
| |
|
The seasonal average temperature of 59.3° is 5.0° above normal and goes into the record books as the WARMEST Winter on record, shattering the old record of 57.9° from the Winter of 2017-18. Temperature extremes ranged from a high of 89° on February 27th and 28th to a low of 34° on January 10th. This is the FIRST Winter on record, since 1894, that a freezing low temperature wasn't recorded at the official location in Tucson. There were 13 daily record temperatures set (7 for highs and 6 for warm lows), which is the most in Winter since 12 were recorded in Winter 1962-63.
|
| |
|
Rainfall amounts varied across the metro area (per sources like rainlog.org, Pima County Regional Flood Control District, and CoCoRaHS), ranging from 0.75" to 3.00", with isolated totals between 3.00" & 5.00". The Tucson International airport, the official recording location, recorded 2.29" which is nearly a third of an inch below normal and ranks as the 62nd wettest Winter season on record. The bulk of the Winter season rain occurred in January.
|
| |
| Winter 2025-2026 stats |
Season
|
Normal
|
Departure
|
Historical Ranking
|
| Average high temperature |
72.2°
|
67.0°
|
+ 5.2°
|
2nd warmest
|
| Average low temperature |
46.4°
|
41.5°
|
+ 4.9°
|
WARMEST
|
| Average temperature |
59.3°
|
54.3°
|
+ 5.0°
|
WARMEST
|
| Rainfall |
2.29"
|
2.64"
|
- 0.35"
|
62nd wettest
|
| # of days w/lows 32° or colder |
0
|
10
|
- 10
|
Lowest on record
|
|
Period of record: 133 years (1894-2026)
|
|
| |
|
| |
| 2026 |
|
The yearly mean temperature of 58.7°, which is 3.8° above normal, ranks as the 2nd warmest January/February period on record. On the precipitation side the Tucson International Airport, the official recording location in Tucson, has recorded 1.84" which is 0.16" above normal and ranks as the 50th wettest January/February period on record.
|
| |
|
| |
| Looking ahead into March |
|
The Climate Prediction Center's March outlook for Tucson favors a warmer-than-average month, showing a 49% chance of above-normal monthly mean temperatures compared to only an 18% chance of below-normal. For precipitation, the outlook indicated equal chances for below-, near-, or above-normal monthly total precipitation amounts.
|
| |
| Normal monthly high temperature |
75.8° |
| Normal monthly low temperature |
48.0° |
| Normal monthly temperature |
61.9° |
| Record high temperature |
99° on March 26, 1988 |
| Record low temperature |
20° on March 4, 1965 |
| Warmest March (avg.) |
67.9° in 2017 |
| Coldest March (avg.) |
51.5° in 1973 |
| Normal rainfall |
0.56" |
| Wettest March day |
1.42" on March 25, 1903 |
| Wettest March |
3.88" in 1905 |
| Driest March |
0.00" in 1895, 1928, 1933, 1956 & 1984 |
| Snowiest March |
6.0" in 1922 |
| Daily normals | Daily records |
|
|
| The number of daylight hours will increase from 11 hours 30 minutes 32 seconds on the 1st to 12 hours 29 minutes 54 seconds on the 31st, a gain of 59 minutes 22 seconds. |
| |
| Looking ahead into Spring |
|
The Climate Prediction Center's Spring outlook for Tucson favors a warmer-than-average season, showing a 58% chance of above-normal seasonal mean temperatures compared to only a 9% chance of below-normal. For precipitation, the outlook favors a drier-than-average season, showing a 50% chance of below-normal seasonal total precipitation amounts compared to a 17% chance of above-normal.
|
| |
| Normal seasonal high temperature |
83.5° |
| Normal seasonal low temperature |
54.3° |
| Normal seasonal temperature |
68.9° |
| Warmest Spring (avg.) |
72.1° in 1989 |
| Coldest Spring (avg.) |
59.0° in 1905 |
| Normal Spring rainfall |
1.00" |
| Wettest Spring |
7.43" in 1905 |
| Driest Spring |
Trace in 2018 |
| |
|
|
| The vernal equinox, otherwise known as the beginning of spring, will occur on March 20th at 7:46 AM when the sun crosses into the northern hemisphere. |
| |
| Glueck |


