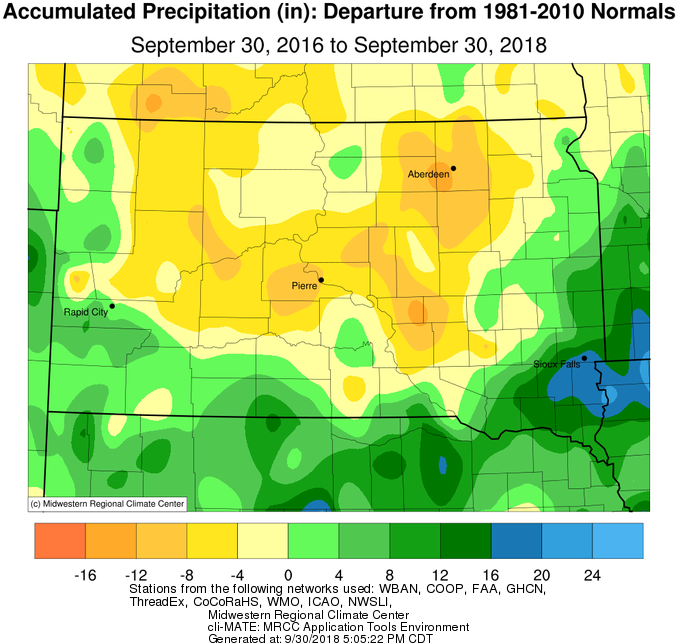
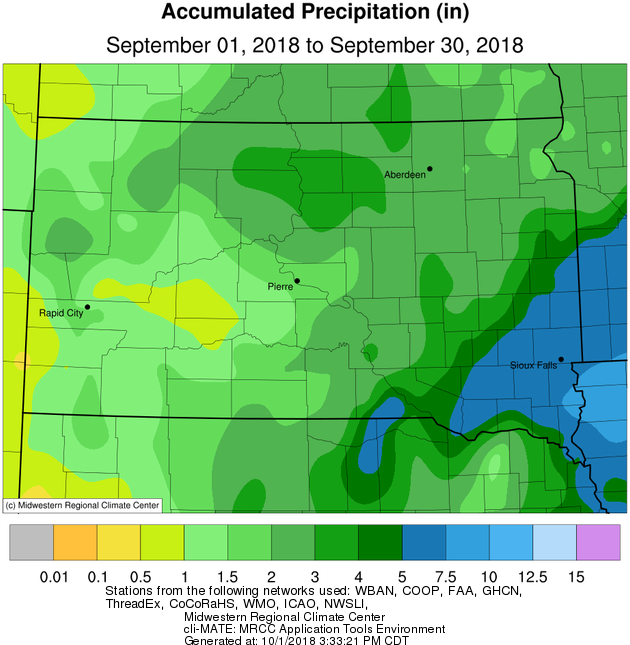
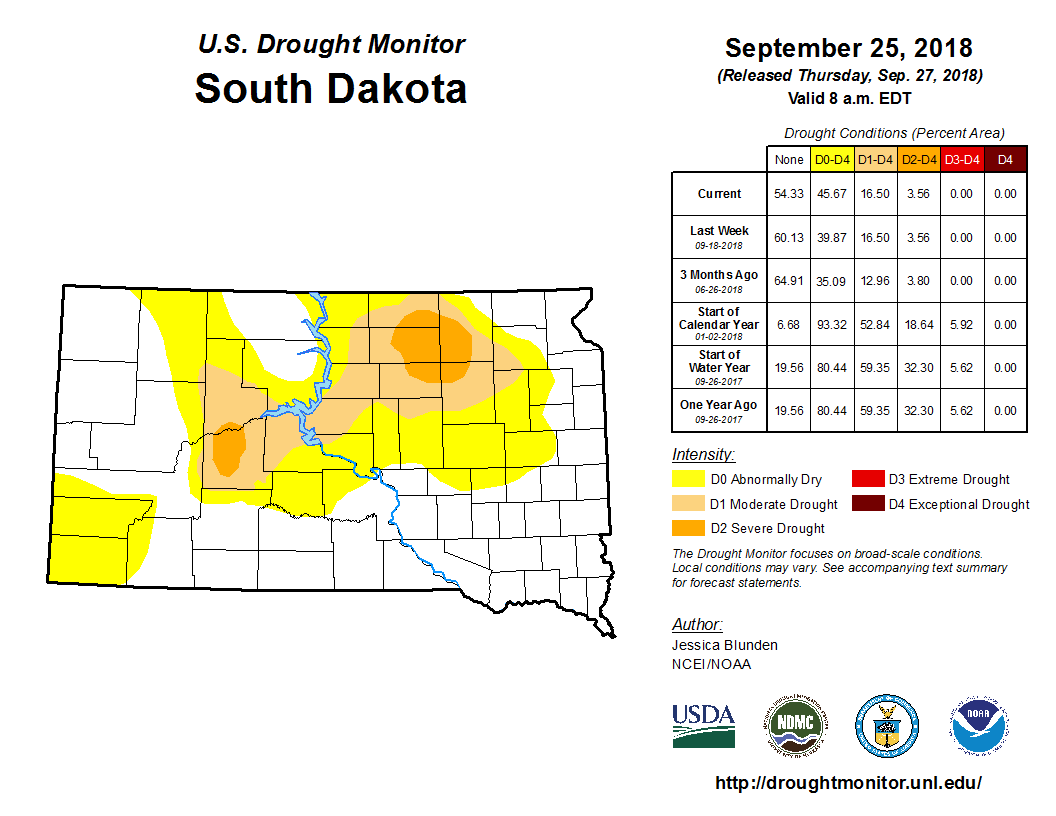
September 2018 finished between average and up to 2 inches of precipitation above average generally along and west of the James River Valley as well as across east central and southeastern South Dakota, and up to an inch of precipitation below average across the rest of northeastern South Dakota as well as west central Minnesota. Indeed, several rounds of rainfall occurred generally during the second half of the month, including a widespread 1” plus event on the 19th and 20th. Mobridge recorded 2.1” on the 20th, which broke the previous daily rainfall record of 0.96” set in 1996. This largely contributed to Mobridge recording their 7th wettest September on record with 3.33”. Timber Lake, with 3.37”, recorded their 4th wettest September on record. While this uptick in activity was helpful across the severe drought-stricken areas of portions of Brown, Spink, Faulk, Edmunds and McPherson counties, it’ll take much more moisture to alleviate long-term deficits. While opportunities have been plenty across portions of South Dakota, they’ve unfortunately been misplaced. Amazingly, Sioux Falls year-to-date has recorded 20.78 more inches of precipitation than Aberdeen has (34.32” vs 13.54”). For perspective, Sioux Falls typically receives 3.68” more precipitation than Aberdeen through the end of September. Flooding has been a large story this month across southeastern South Dakota. Finally, snow was not reported across the Aberdeen NWS County Warning Area this September, though there were a few close calls late in the month.
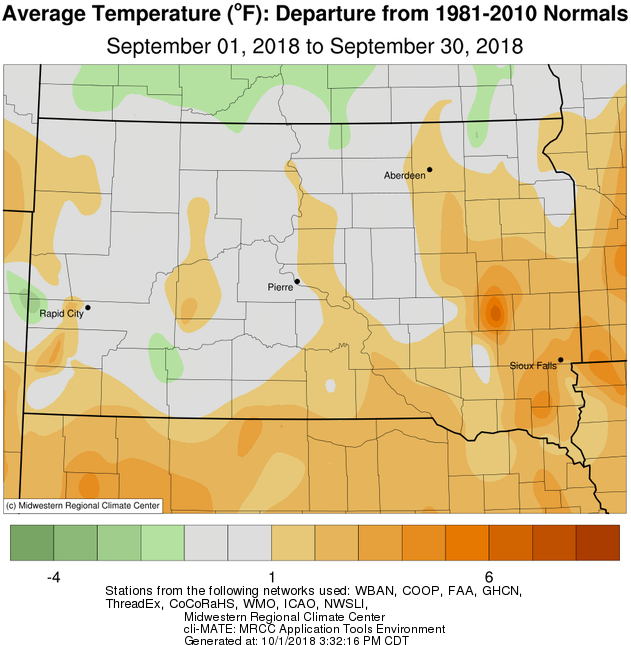
On the whole, near average to up to 2 degrees above normal temperatures were recorded this month across the area. While temperatures during the first half of the month were much above average, an active precipitation pattern during the second half of the month ushered in plenty of clouds and cool air which led to generally below average temperatures during this time. This mid-month shift was quite apparent at Aberdeen for example, as their high temperature on the 16th was 95 degrees but only 63 degrees the following day (93 followed by 61 degrees at Sisseton). By September 25th, patchy frost was possible and a widespread freeze with low temperatures between 32 and 26 degrees took place across northern South Dakota and west central Minnesota on the 28th and 29th.
|
September 2018 |
||||
|
Temperature Data |
Aberdeen |
Sisseton |
Wheaton |
Watertown |
|
Warmest Temperature / Date |
95°/ 16th |
93°/15th, 16th |
94°/17th |
91°/15th |
|
Coldest Temperature / Date |
30°/ 29th |
26°/29th |
31°/29th |
33°/28th, 29th |
|
Average High / Departure from Normal |
72.9° / +0.8 |
71.5° / -0.7 |
72.2 / +1.1 |
70.2° / -0.4 |
|
Average Low / Departure from Normal |
48.4° / +2.7 |
47.8° / +0.5 |
50.8 / +3.2 |
50.9° / +3.5 |
|
Monthly Average / Departure from Normal |
60.7° / +1.8 |
59.7° / +0.0 |
61.5 / +2.2 |
60.5° / +1.5 |
|
Precipitation Data |
||||
|
Monthly Precipitation / Departure from Normal |
2.38”/+0.19” |
1.88”/-0.66” |
1.89”/-1.2” |
2.85”/+0.21” |
|
Most Precipitation in 24 Hours / Date |
0.93”/20th |
0.81”/20th |
0.75”/20th |
0.82”/2nd |
|
Temperature Data |
Pierre |
Kennebec |
Mobridge |
Timber Lake |
|
Warmest Temperature / Date |
97°/15th |
95°/15th |
95°/12th |
91°/12th |
|
Coldest Temperature / Date |
38°/26th |
33°/26th |
37°/26th, 28th |
33°/26th, 28th |
|
Average High / Departure from Normal |
75.1° / -1.4 |
77.7° / -1.5 |
72.9° / -1.0 |
72.1° / -2.9 |
|
Average Low / Departure from Normal |
52.8° / +3.6 |
53.3° / +4.0 |
51.6° / +4.0 |
48.3° / +0.9 |
|
Monthly Average / Departure from Normal |
63.9° / +1.0 |
65.5° / +1.2 |
62.3° / +1.6 |
60.2° / -1.0 |
|
Precipitation Data |
||||
|
Monthly Precipitation / Departure from Normal |
1.45”/-0.42” |
2.26”/+0.49” |
3.33”/+1.79” |
3.37”/+1.93 |
|
Most Precipitation in 24 Hours / Date |
0.74”/20th |
0.82”/18th |
2.10”/20th |
1.43”/20th |
Monthly temperature departures from normal, from the Midwestern Regional Climate Center
Monthly precipitation departures from normal, from the Midwestern Regional Climate Center

Monthly precipitation totals, from Midwestern Regional Climate Center
Most recent (as of this writing) US Drought Monitor, from https://droughtmonitor.unl.edu/
2 year precipitation departures from normal, from the Midwestern Regional Climate Center