ABI Band #2 - 0.64 microns,for daytime monitoring of clouds.
Image
Loop
IR ("Clean IR Longwave Band")
ABI Band #13 - 10.3 microns, Less sensitive to atmospheric moisture than the other IR channels. As a result brightness temperatures are usually warmer than traditional IR as less radiation is absorbed by water vapor and re-emitted at higher altitudes.
Image
Loop
Visible/IR Combo
A Multi-spectral blend combines IR band 13 with visual band 3.
Image
Loop
IR ("Upper Troposphere WV")
ABI Band #8 - 6.2 microns, Upper-level feature detection (jet stream, waves, etc.)
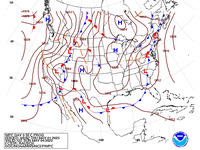
The Weather Prediction Center (WPC) produces surface maps which depicts the analysis of highs, lows, fronts, troughs, outflow boundaries, squall lines, and drylines.
WPC Days 3-7 Maps
WPC Day 3-7 surface maps which depicts the analysis of highs, lows, fronts, troughs, outflow boundaries, squall lines, and drylines.
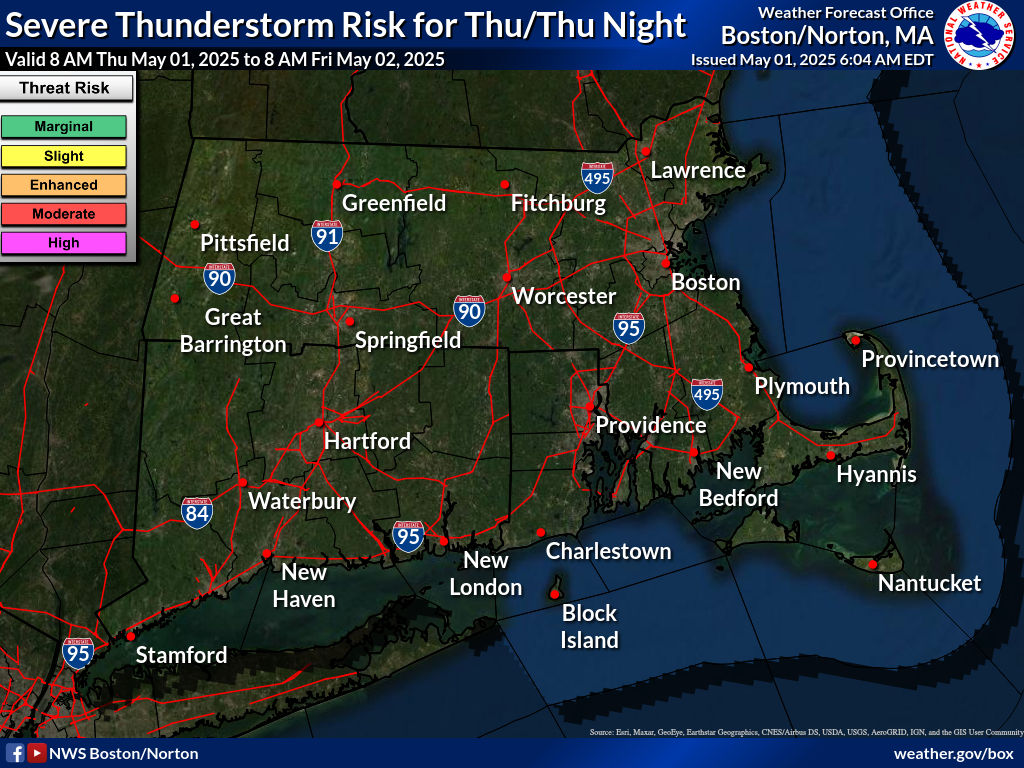
Graphical Hazardous Weather Outlook
Southern New Englands Graphical Hazardous Outlook Maps.
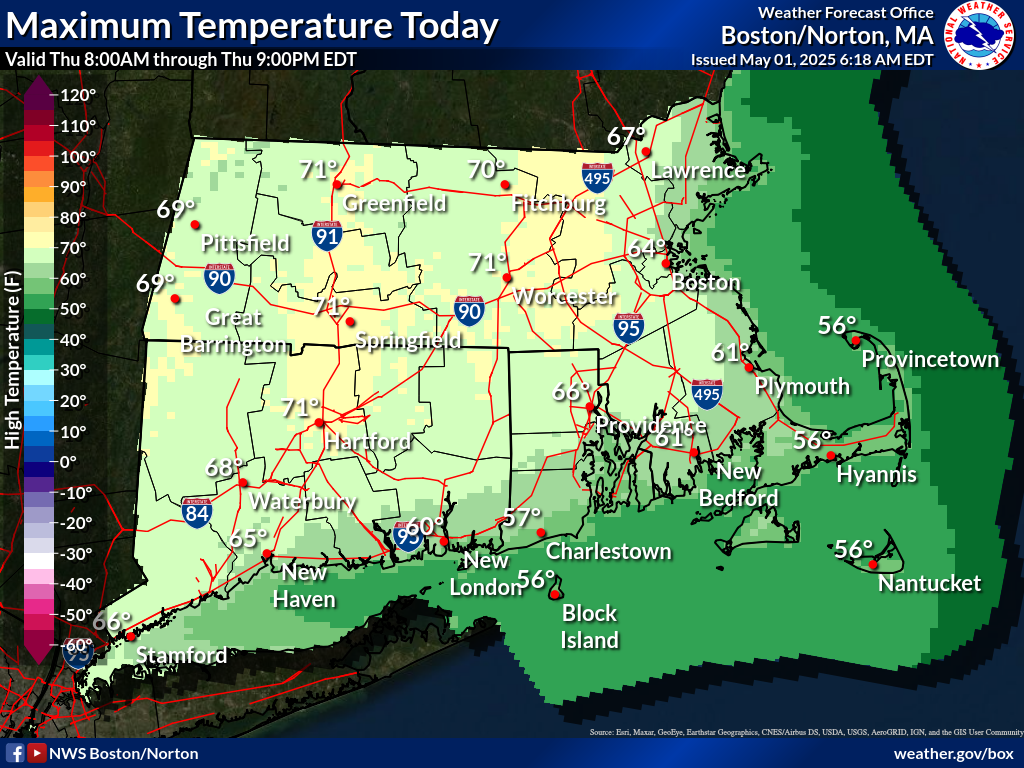
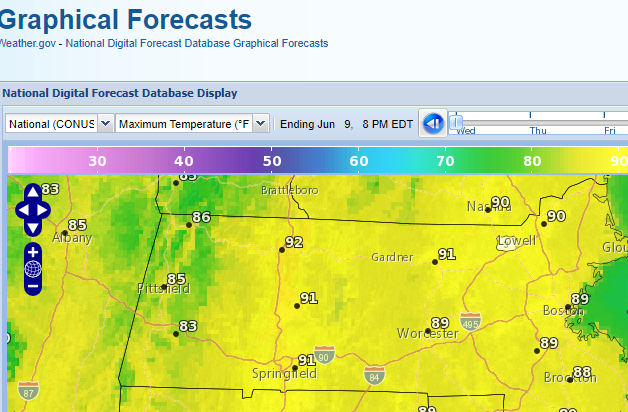
Day 1 Maximum Temperature
Map displays the Southern New England Maximum Temperature Day 1.
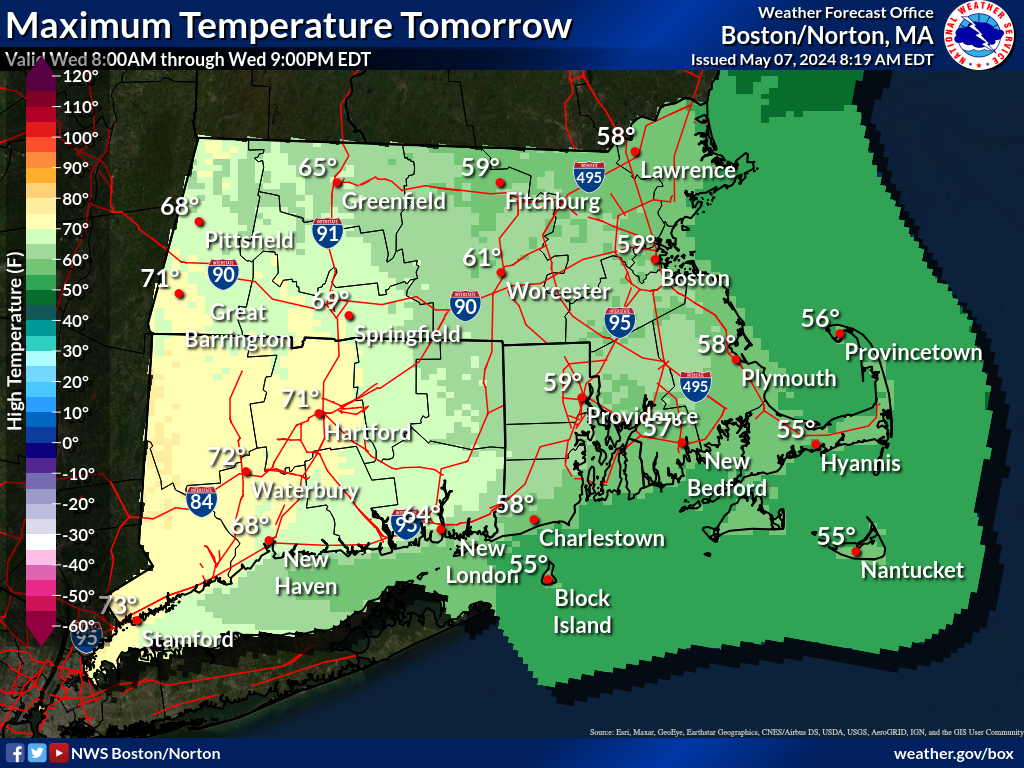
Day 2 Maximum Temperature
Map displays the Southern New England Maximum Temperature Day 2
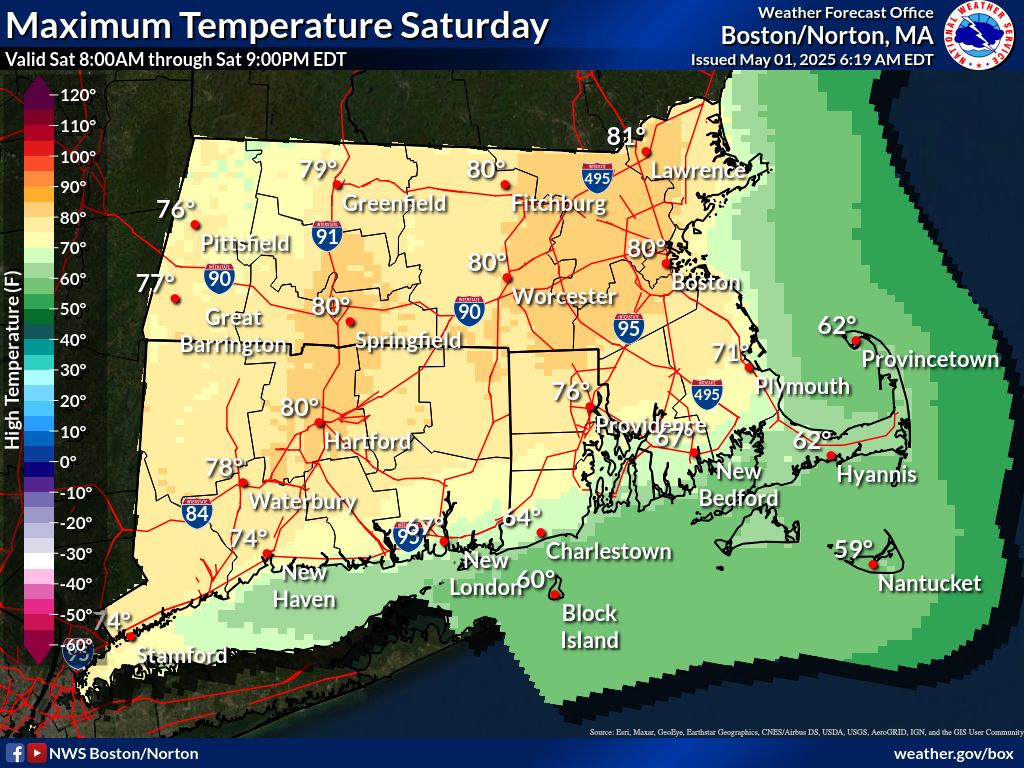
Day 3 Maximum Temperature
Map displays the Southern New England Maximum Temperature Day 3
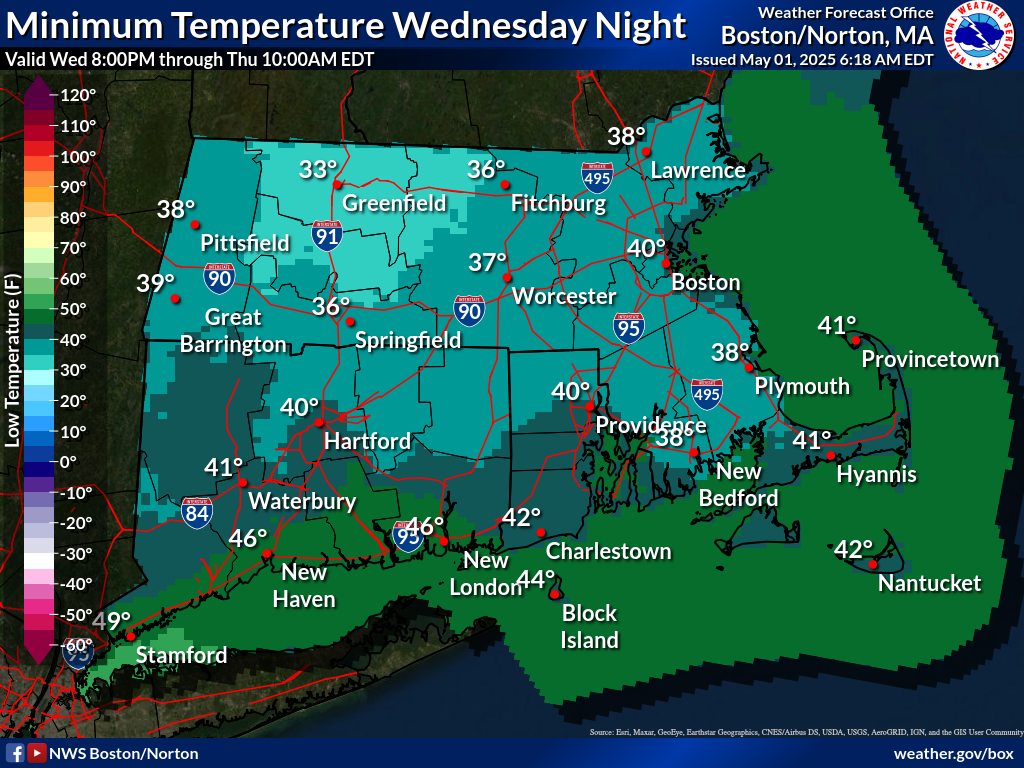
Day 1 Minimum Temperature
Map displays the Southern New England Minimum Temperature Day 1.
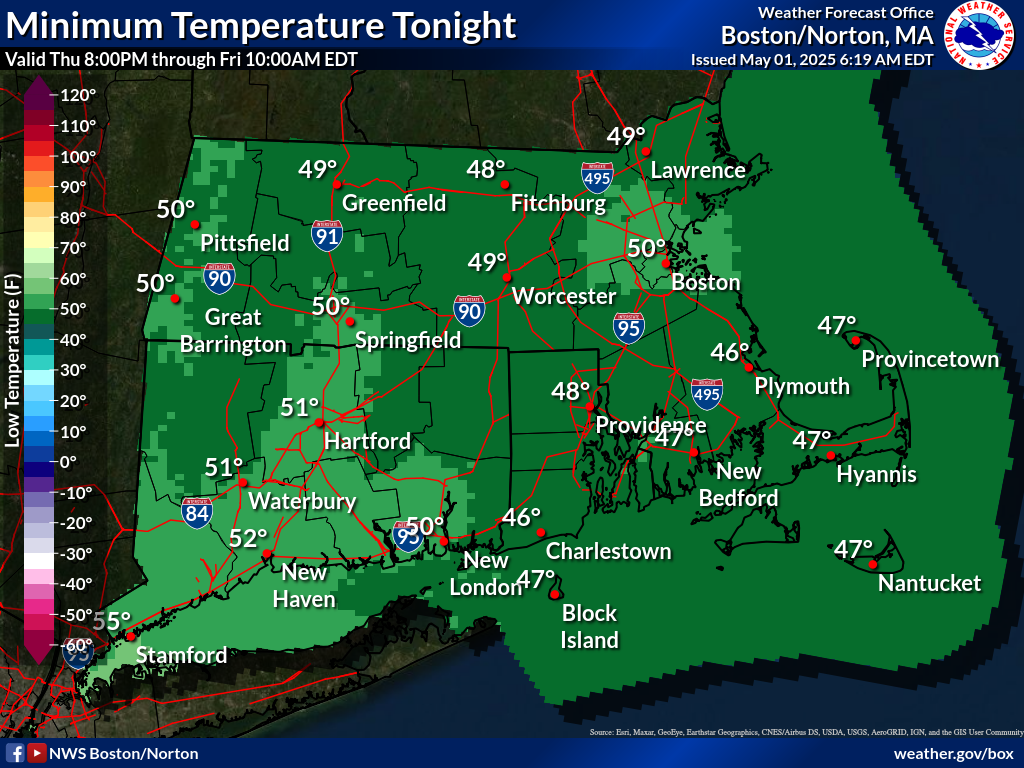
Day 2 Minimum Temperature
Map displays the Southern New England Minimum Temperature Day 2
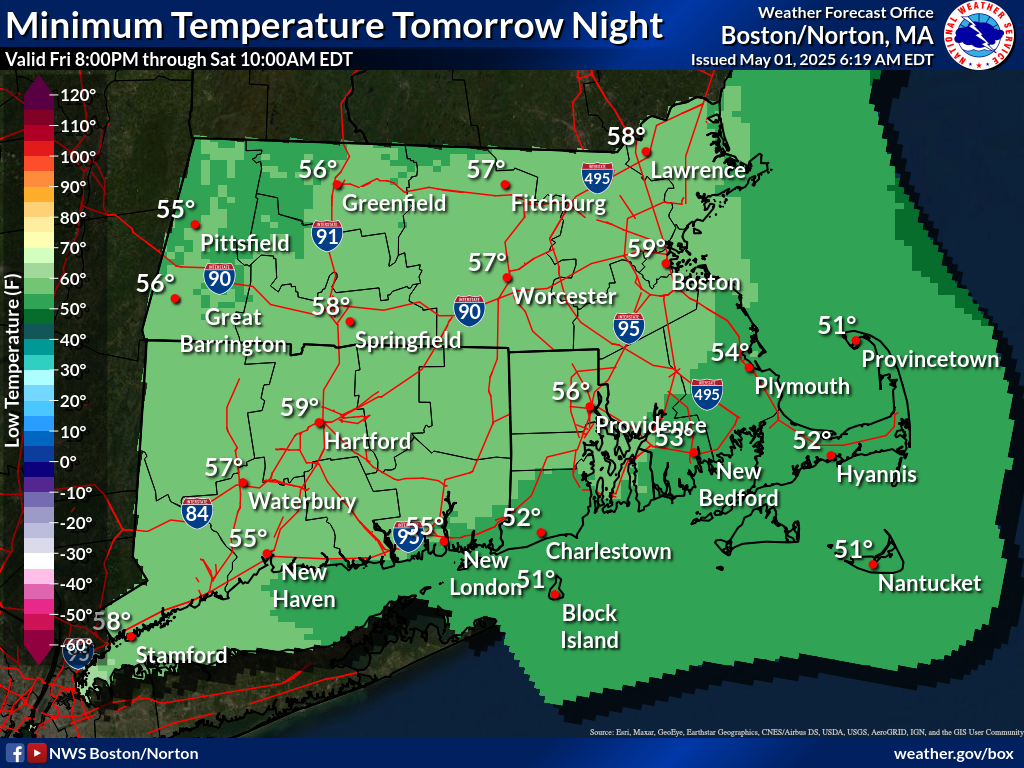
Day 3 Minimum Temperature
Map displays the Southern New England Minimum Temperature Day 3
Graphic showing any severe thunderstorm and tornado watches which are in effect over the contiguous United States.
SPC - Mesoscale Discussions
Description of what is currently happening, what is expected in the next few hours, the meteorological reasoning for the forecast, and when and where SPC plans to issue the watch.
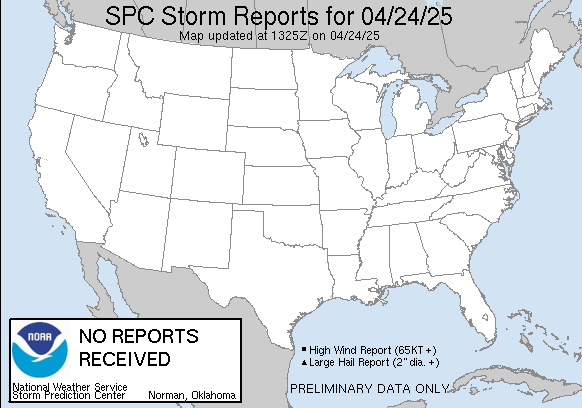
Storm Reports
These reports are preliminary and are plotted and listed as is from NWS Local Storm Reports usually sent in realtime.
Boston, MA Radar
WSR-88D Doppler Radar from Taunton, MA
Standard
Enhanced
New York, NY Radar
WSR-88D Doppler Radar from Brookhaven, NY
Standard
Enhanced
Portland, ME Radar
WSR-88D Doppler Radar from Grey, ME
Standard
Enhanced
Albany, NY Radar
WSR-88D Doppler Radar from Albany, NY
Standard
Enhanced
NE Sector Mesoscale Analysis
Nine fixed regional sectors and a national sector provide hourly gridded mesoanalysis graphics across the CONUS.
Forecast Tools
Including upper air maps, upper air soundings, mesoanalysis graphics, Short-Range Ensemble Forecast (SREF), Storm-Scale Ensemble of Opportunity (SSEO) and Compmap.
Upper Air Soundings
Skew-T charts for all observed soundings across the United States. An archive of seven days of data is available.
Severe Thunderstorm Outlook
Day 1
Convective outlook for organized severe thunderstorms over the contiguous United States on Day 1.
Severe Thunderstorm Outlook
Day 2
Convective outlook for organized severe thunderstorms over the contiguous United States on Day 2.
Severe Thunderstorm Outlook
Day 3
Convective outlook for organized severe thunderstorms over the contiguous United States on Day3.
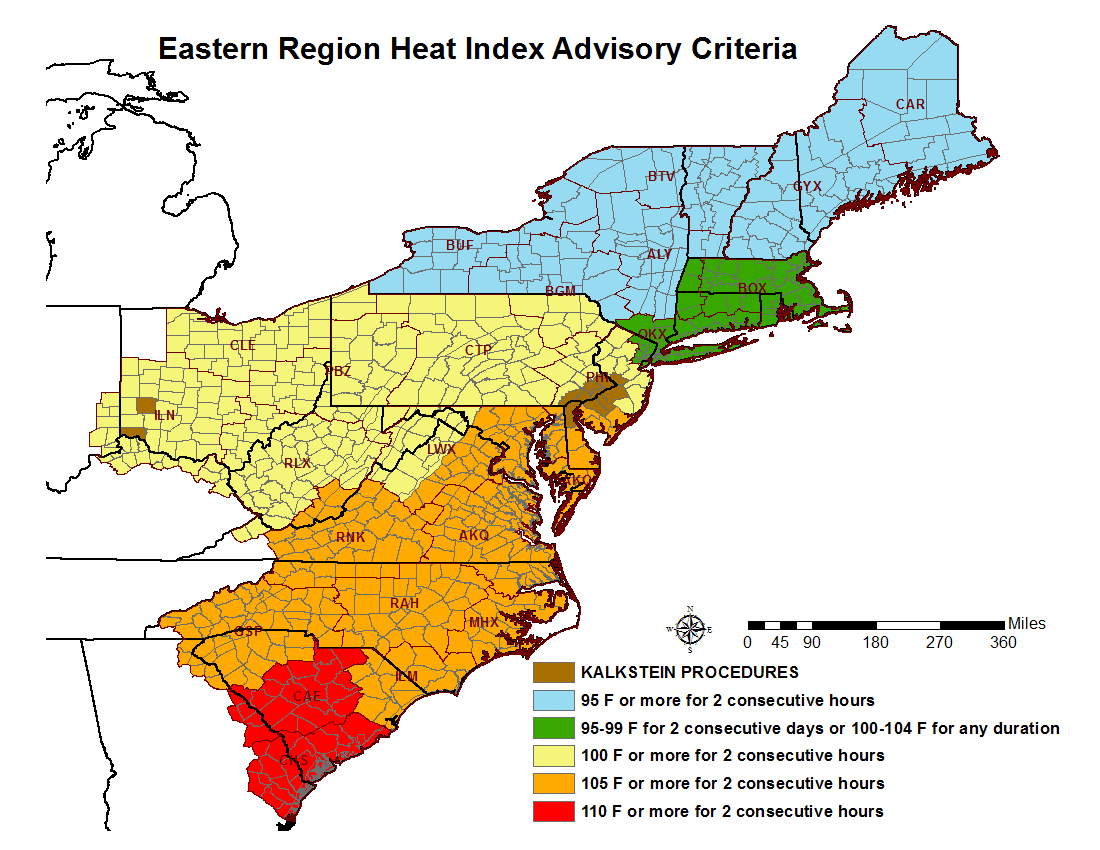
Eastern Region Heat Index Advisory Criteria
A map displaying Heat Index Advisory criteria for the NWS Eastern Region.
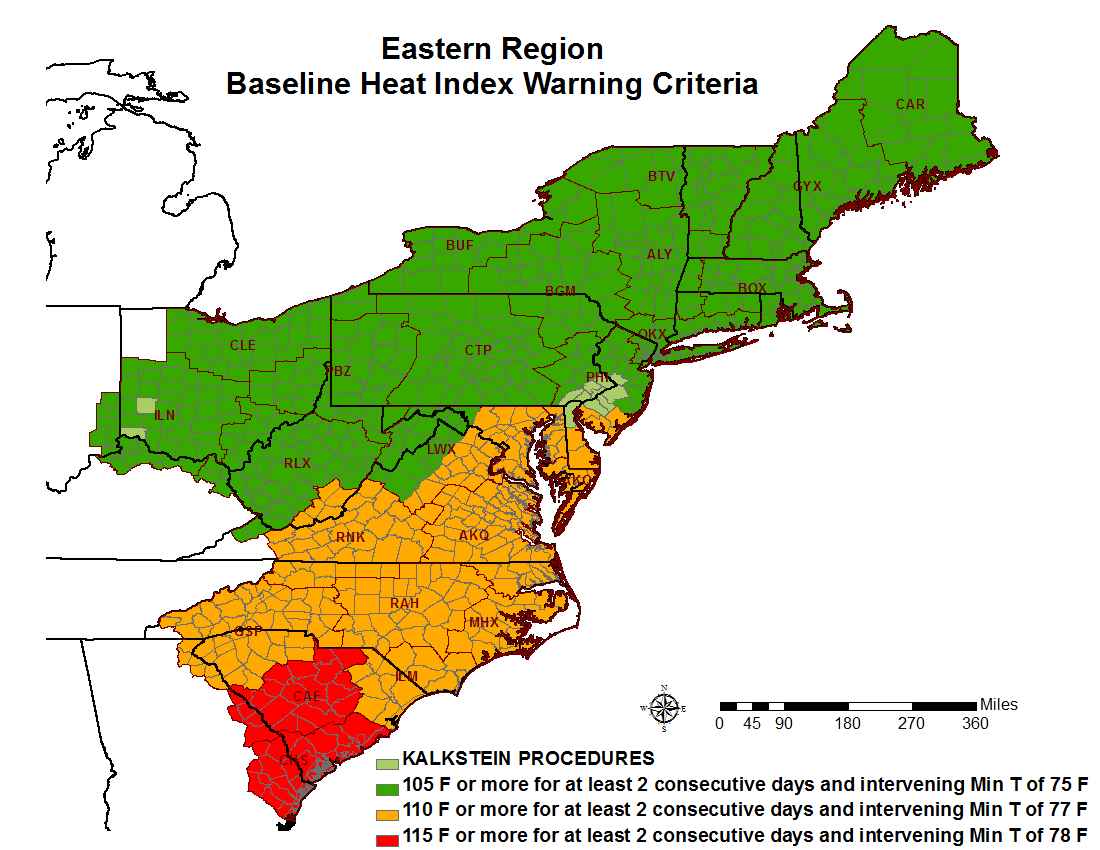
Eastern Region Heat Index Warning Criteria
A map displaying Heat Index Warning criteria for the NWS Eastern Region.
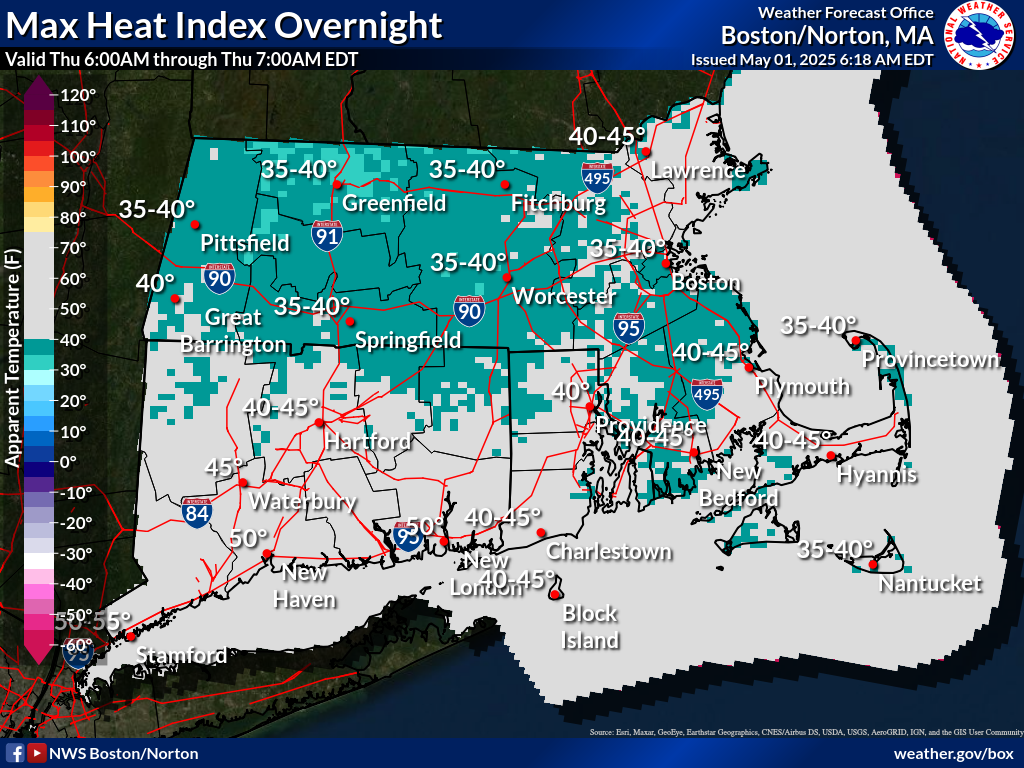
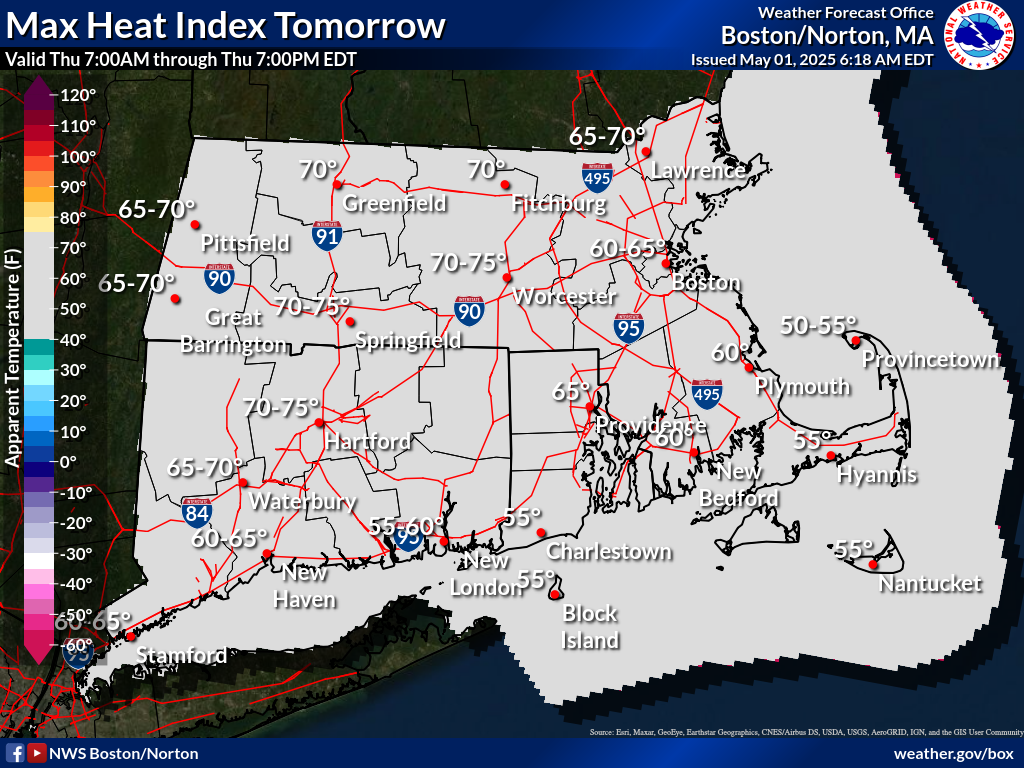
Day 1 Maximum Heat Index
Map displays the 24 Hour Maximum Heat Index Temperatures Day 1.
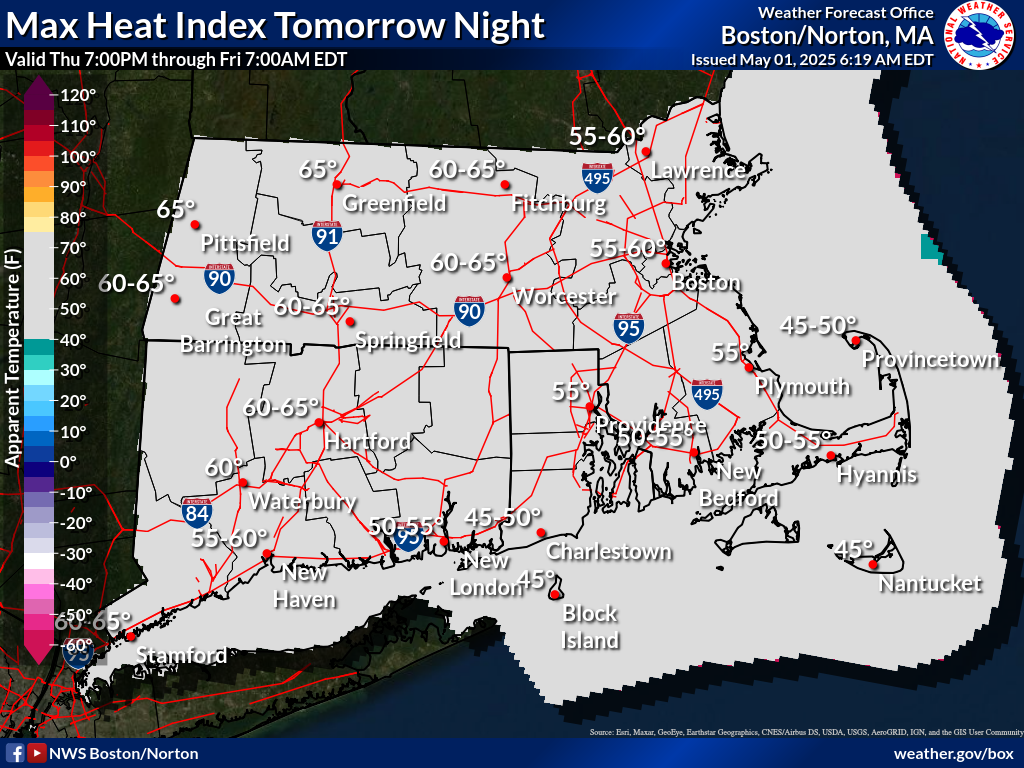
Day 2 Maximum Heat Index
Map displays the 24 Hour Maximum Heat Index Temperatures Day 2
Day 3 Maximum Heat Index
Map displays the 24 Hour Maximum Heat Index Temperatures Day 3
Day 1 Maximum Temperature
Map displays the Southern New England Maximum Temperature Day 1.
Day 2 Maximum Temperature
Map displays the Southern New England Maximum Temperature Day 2
Day 3 Maximum Temperature
Map displays the Southern New England Maximum Temperature Day 3
Day 1 -delineate areas of the continental U.S. where pre-existing fuel conditions, combined with forecast weather conditions, will result in a significant threat for the ignition and/or spread of wildfires.
Day 2 SPC Fire Weather Outlook
Day 2 - delineate areas of the continental U.S. where pre-existing fuel conditions, combined with forecast weather conditions, will result in a significant threat for the ignition and/or spread of wildfires.
Day 3 SPC Fire Weather Outlook
Day 3 - delineate areas of the continental U.S. where pre-existing fuel conditions, combined with forecast weather conditions, will result in a significant threat for the ignition and/or spread of wildfires.
Forecast Graphics
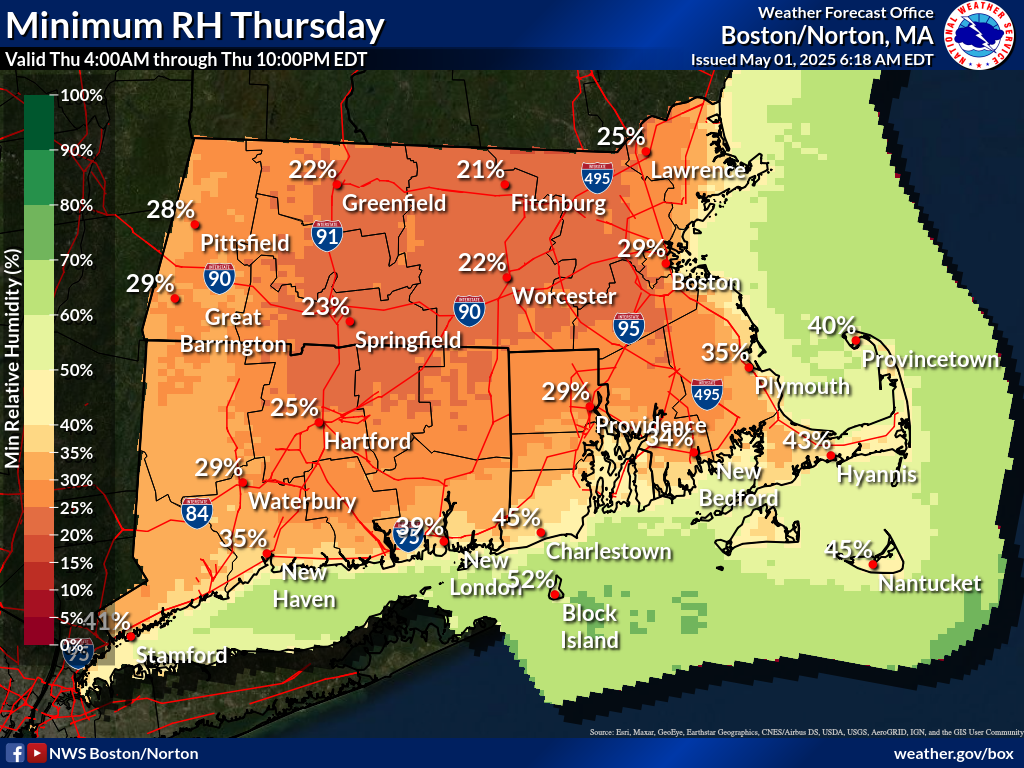
Day 1 Minimum RH
Map displays the Southern New England Minimum RH Day 1.
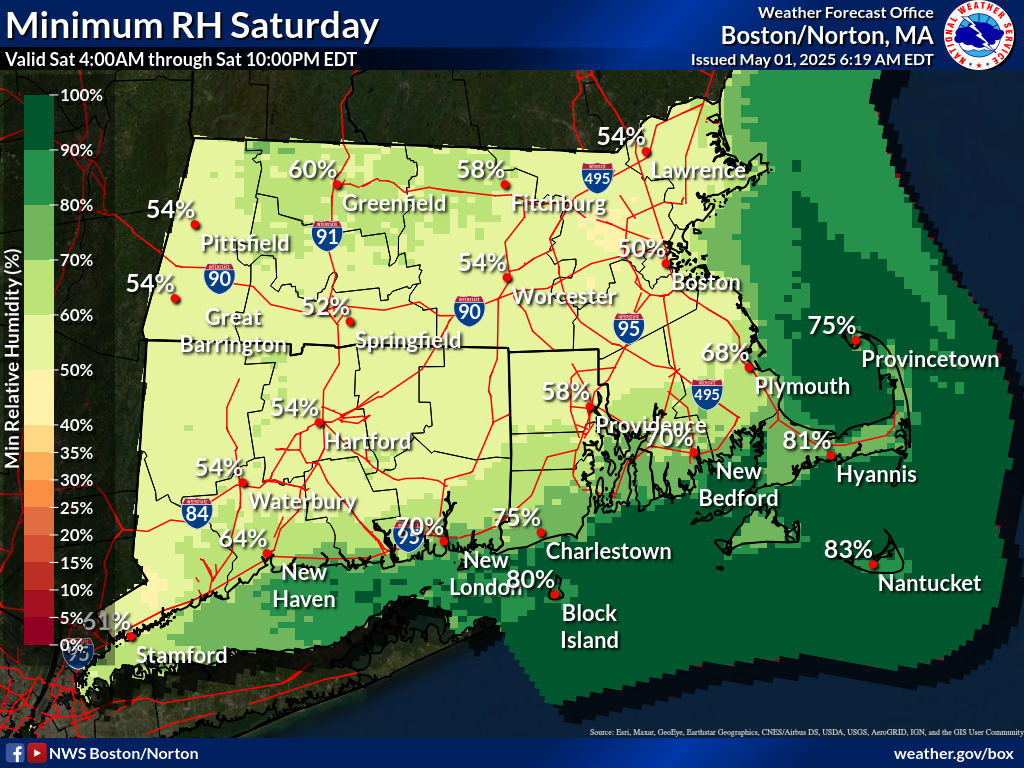
Day 2 Minimum RH
Map displays the Southern New England Minimum RH Day 2
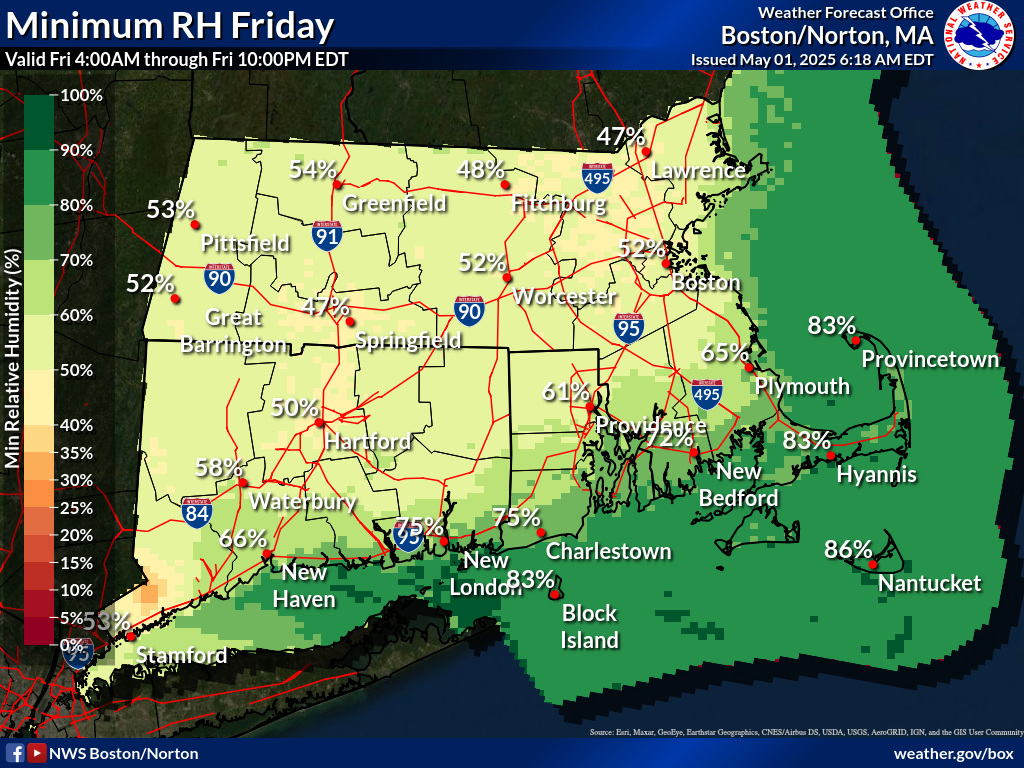
Day 3 Minimum RH
Map displays the Southern New England Minimum RH Day 3
U.S. Monthly Drought Outlook displays the probability of drought development or improvement. Outlook is updated monthly at the beginning of each month.
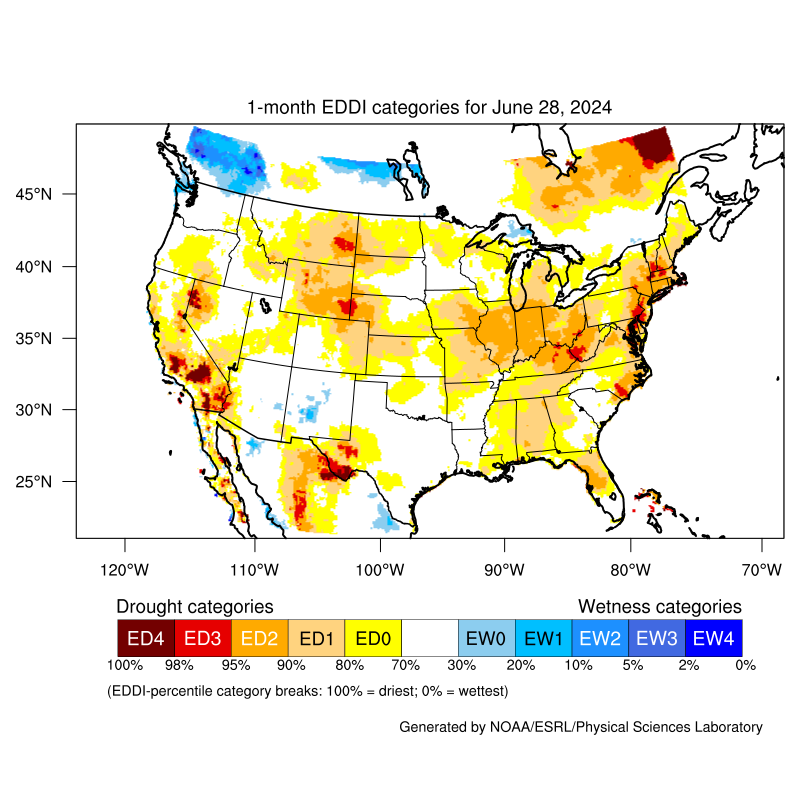
Evaporative Demand Drought Index
The EDDI maps display atmospheric evaporative demand anomalies across a timescale of interest relative to its climatology to indicate the spatial extent and severity of drought.
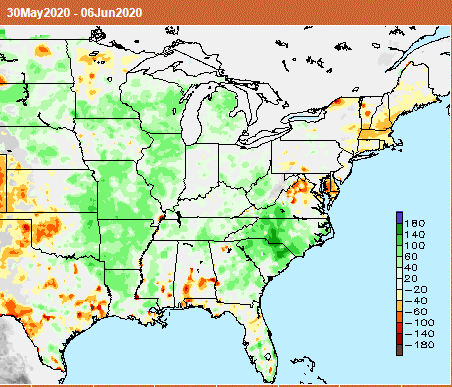
Total Soil Moisture Anomaly
Map displays the total soil moisture anomaly for the past week and/or month.
CPC Long Range Outlooks
Maps display weekly and monthly precipitation outlooks.
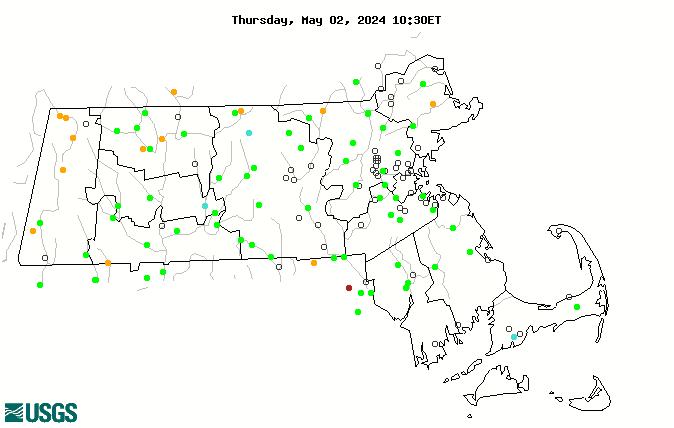
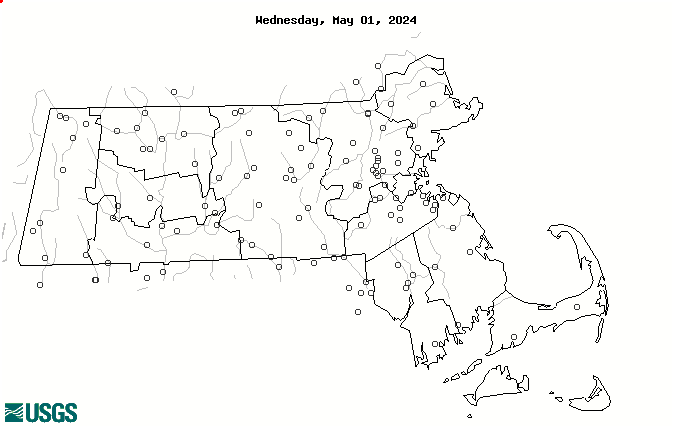
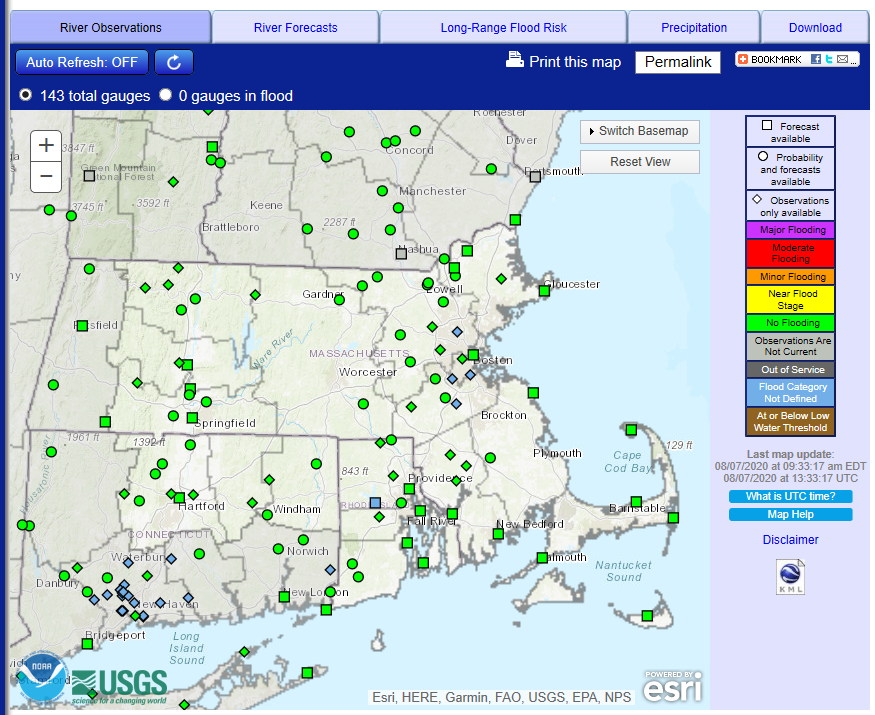
Massachusetts
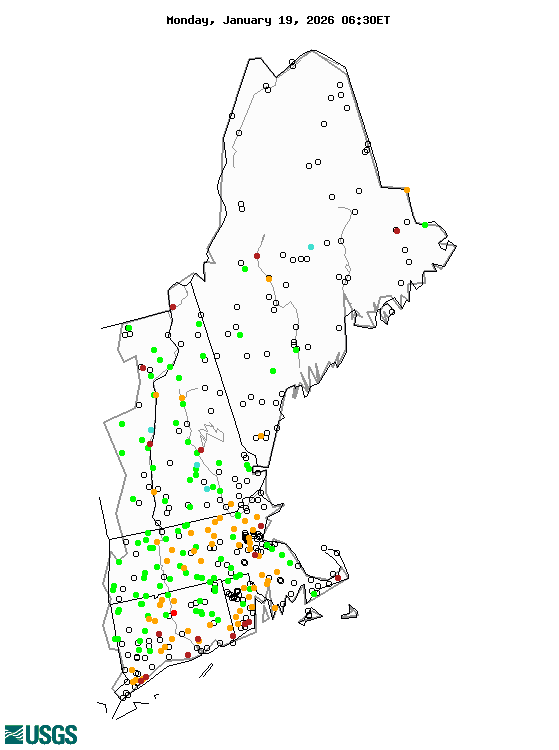
USGS Water Conditions Map
Map of Massachusetts real-time streamflow compared to historical streamflow for the day of the year.
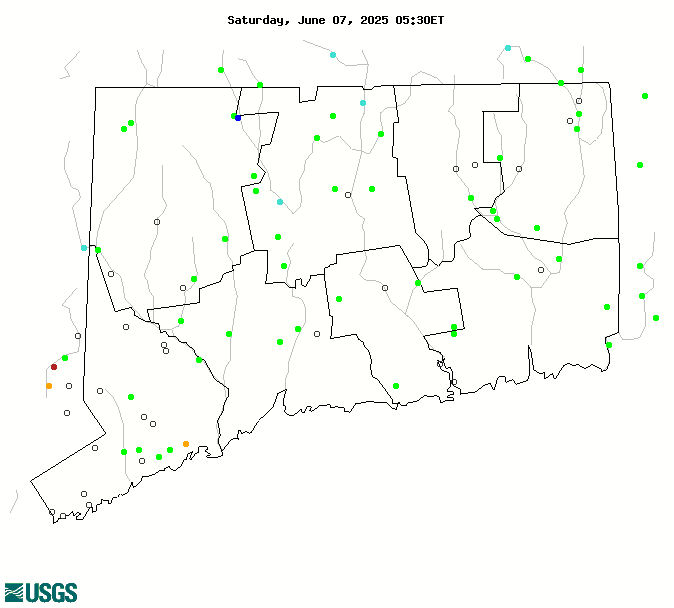
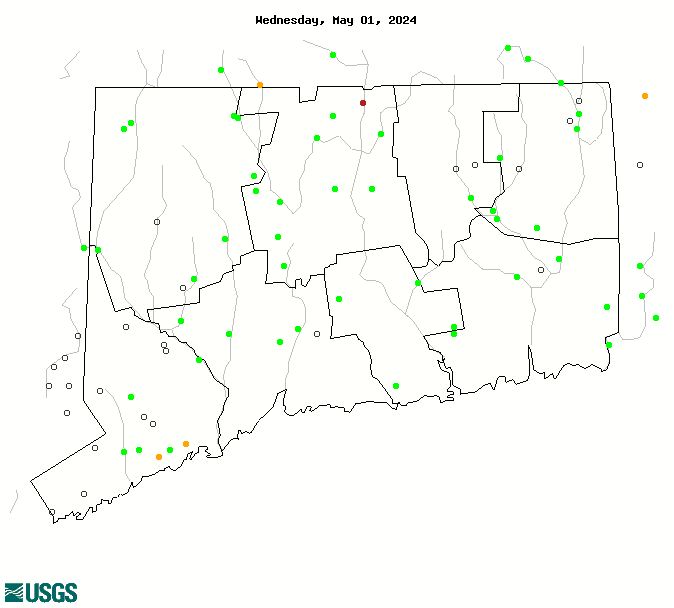
Connecticut
USGS Water Conditions Map
Map of Connecticut real-time streamflow compared to historical streamflow for the day of the year.
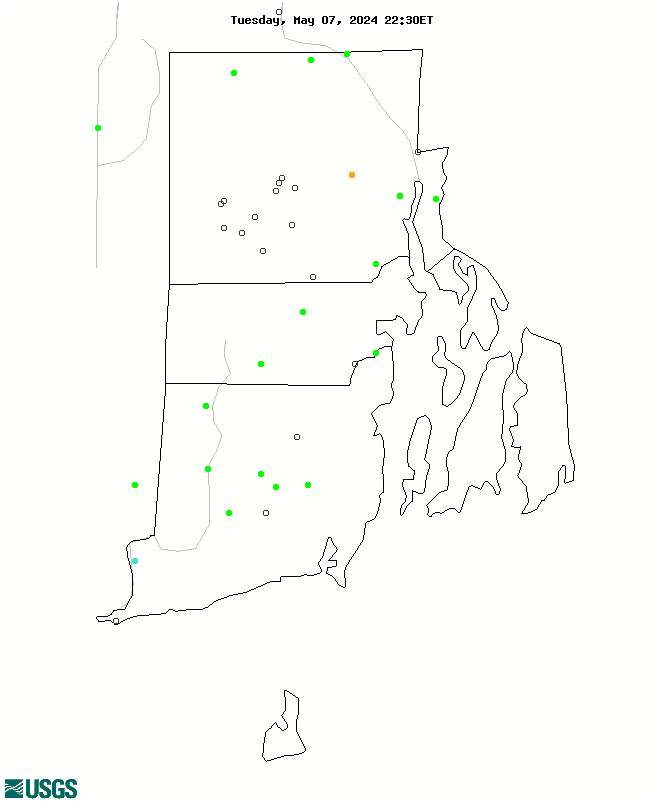
Rhode Island
USGS Water Conditions Map
Map of Rhode Island real-time streamflow compared to historical streamflow for the day of the year.
Massachusetts
USGS 7-day average streamflow
Map of 7-day average streamflow compared to historical streamflow for the day of the year (Massachusetts).
Connecticut
USGS 7-day average streamflow
Map of 7-day average streamflow compared to historical streamflow for the day of the year (Connecticut).
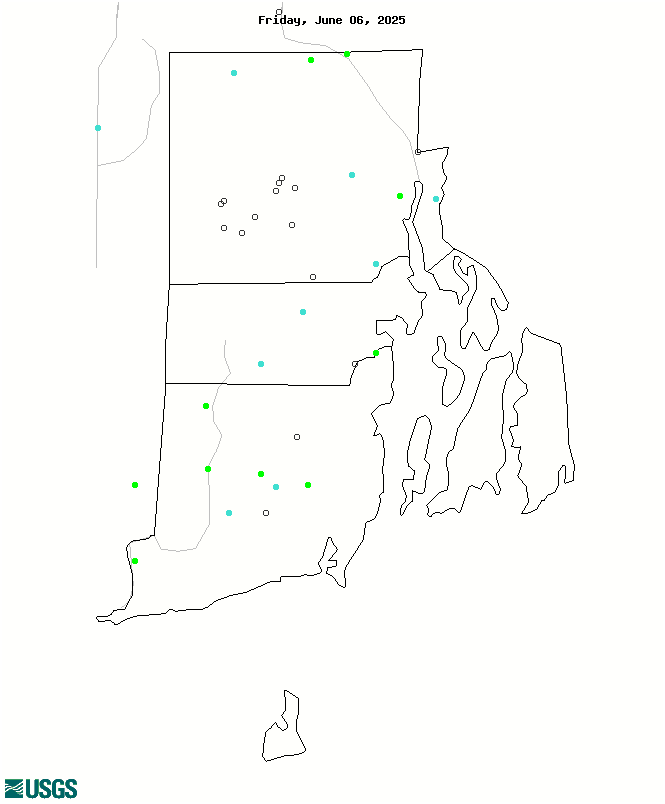
Rhode Island
USGS 7-day average streamflow
Map of 7-day average streamflow compared to historical streamflow for the day of the year (Rhode Island).
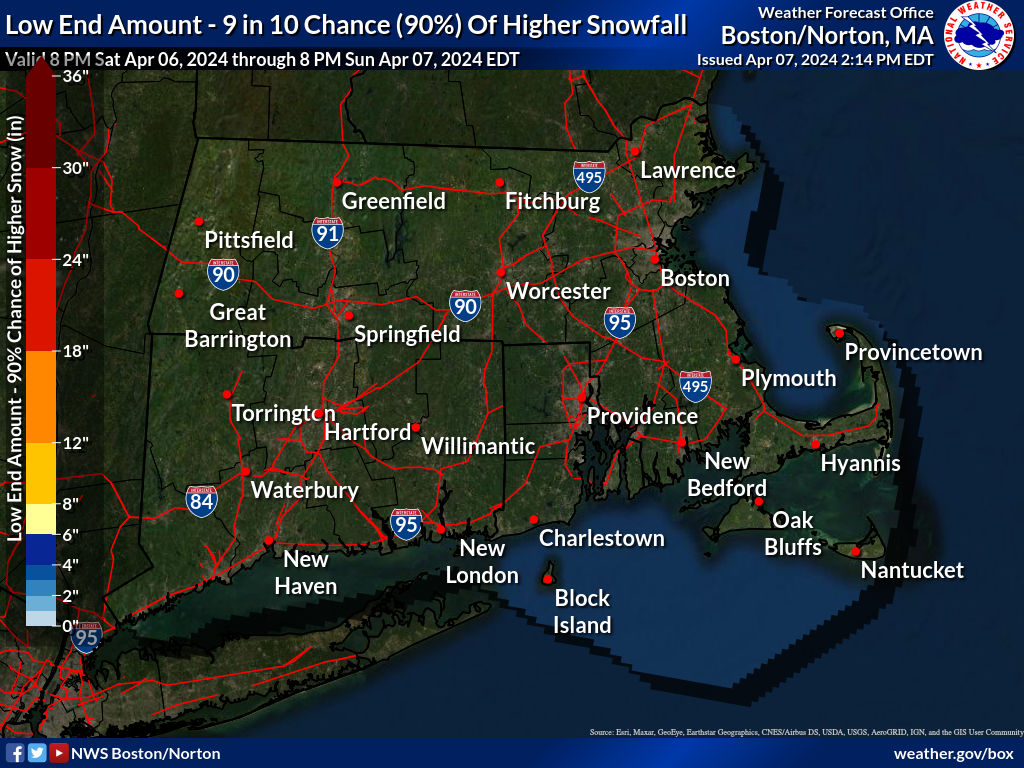
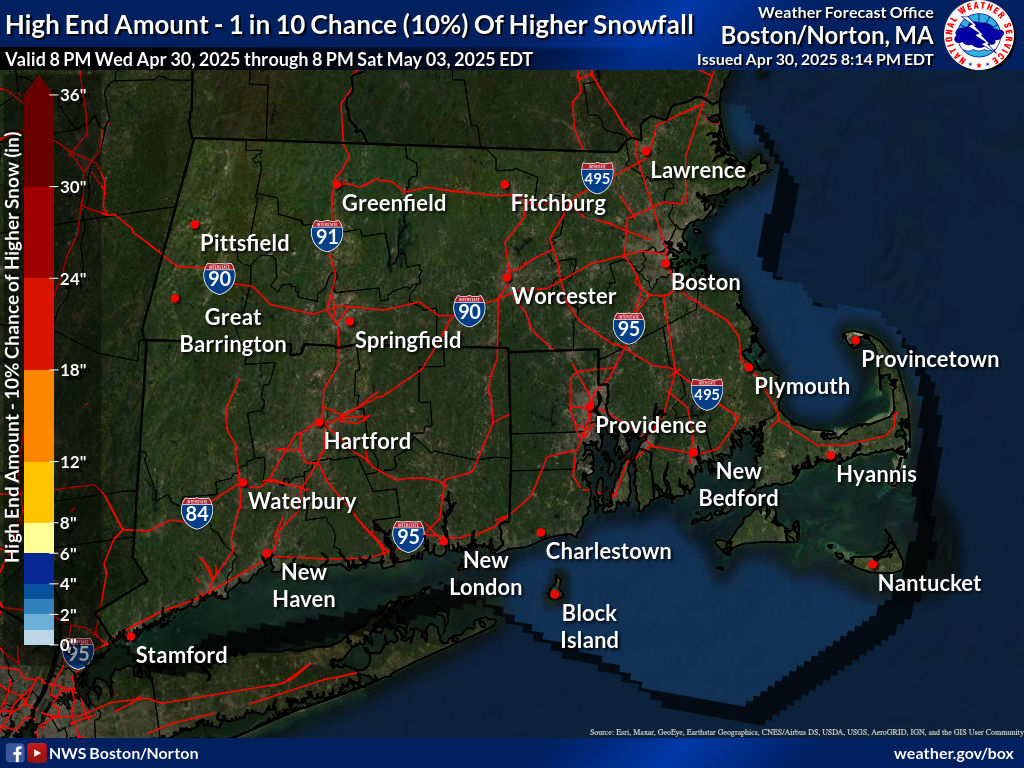
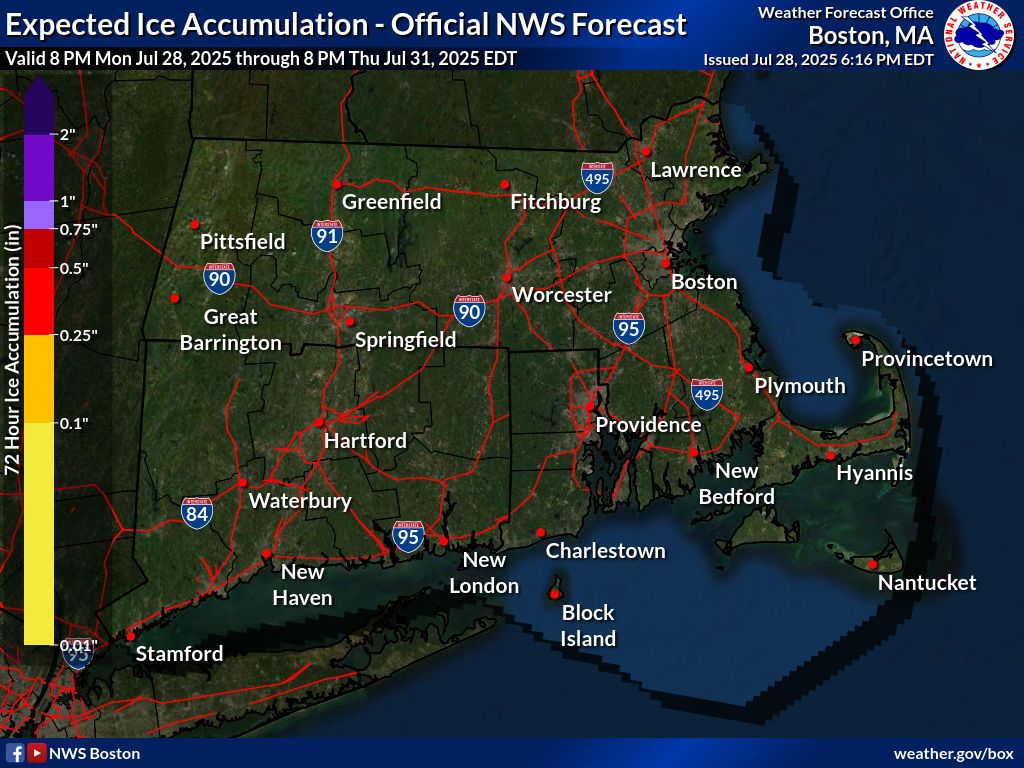
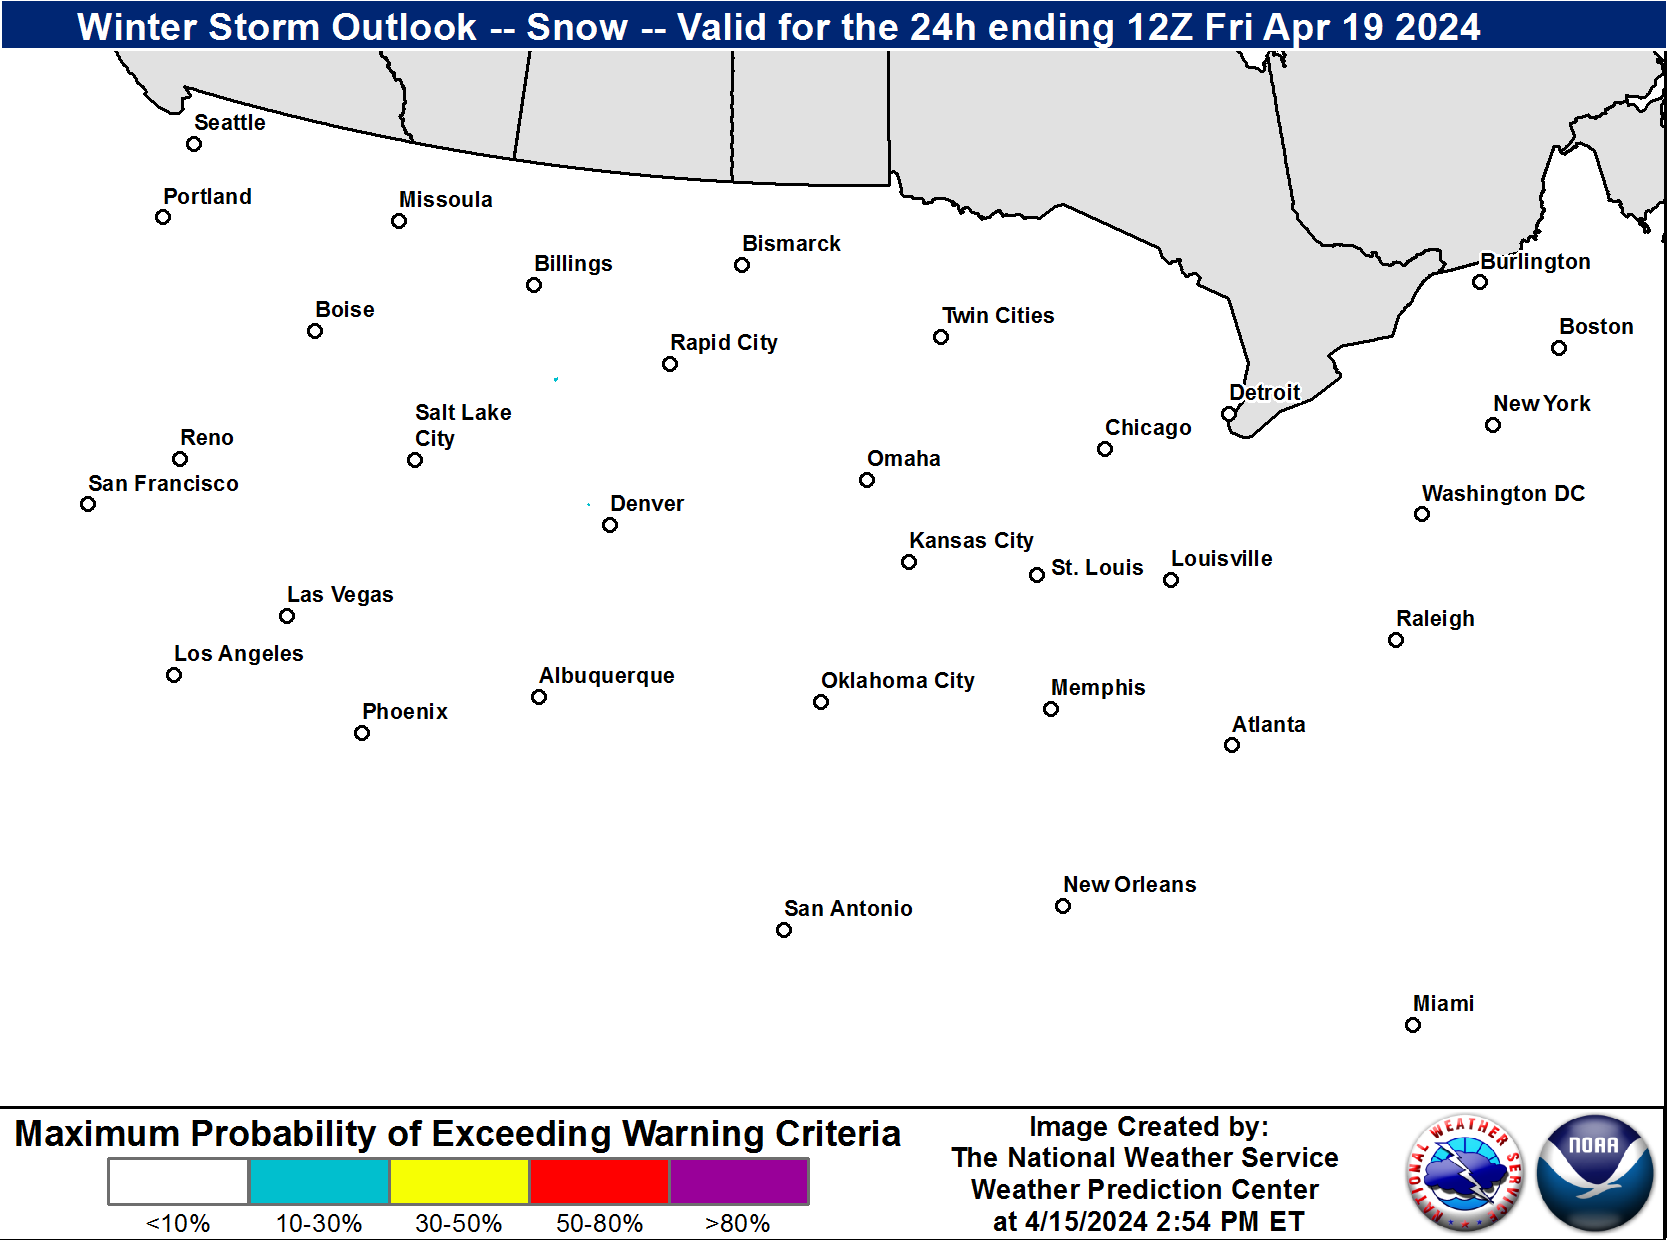
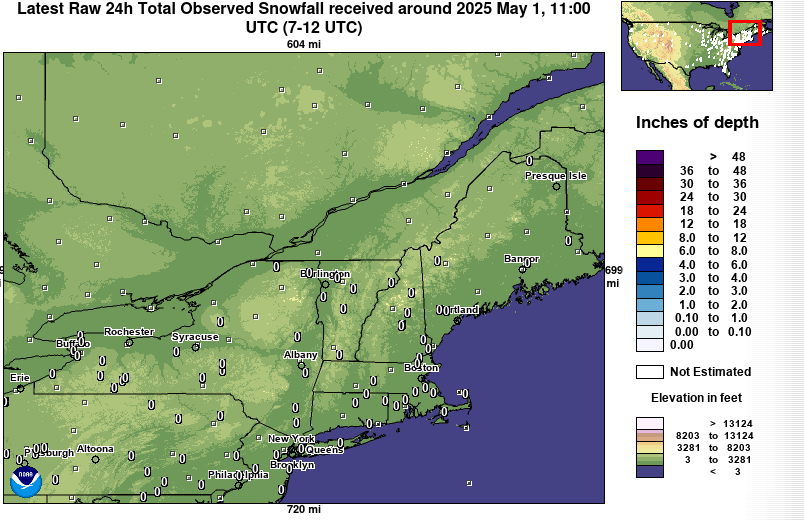
Probability of Exceeding Warning Criteria (Snowfall) Day 1
The probability of exceeding winter storm warning criteria (for snow and ice) during 12-hour and 24-hour time periods on Day 1 for any given location in the US.
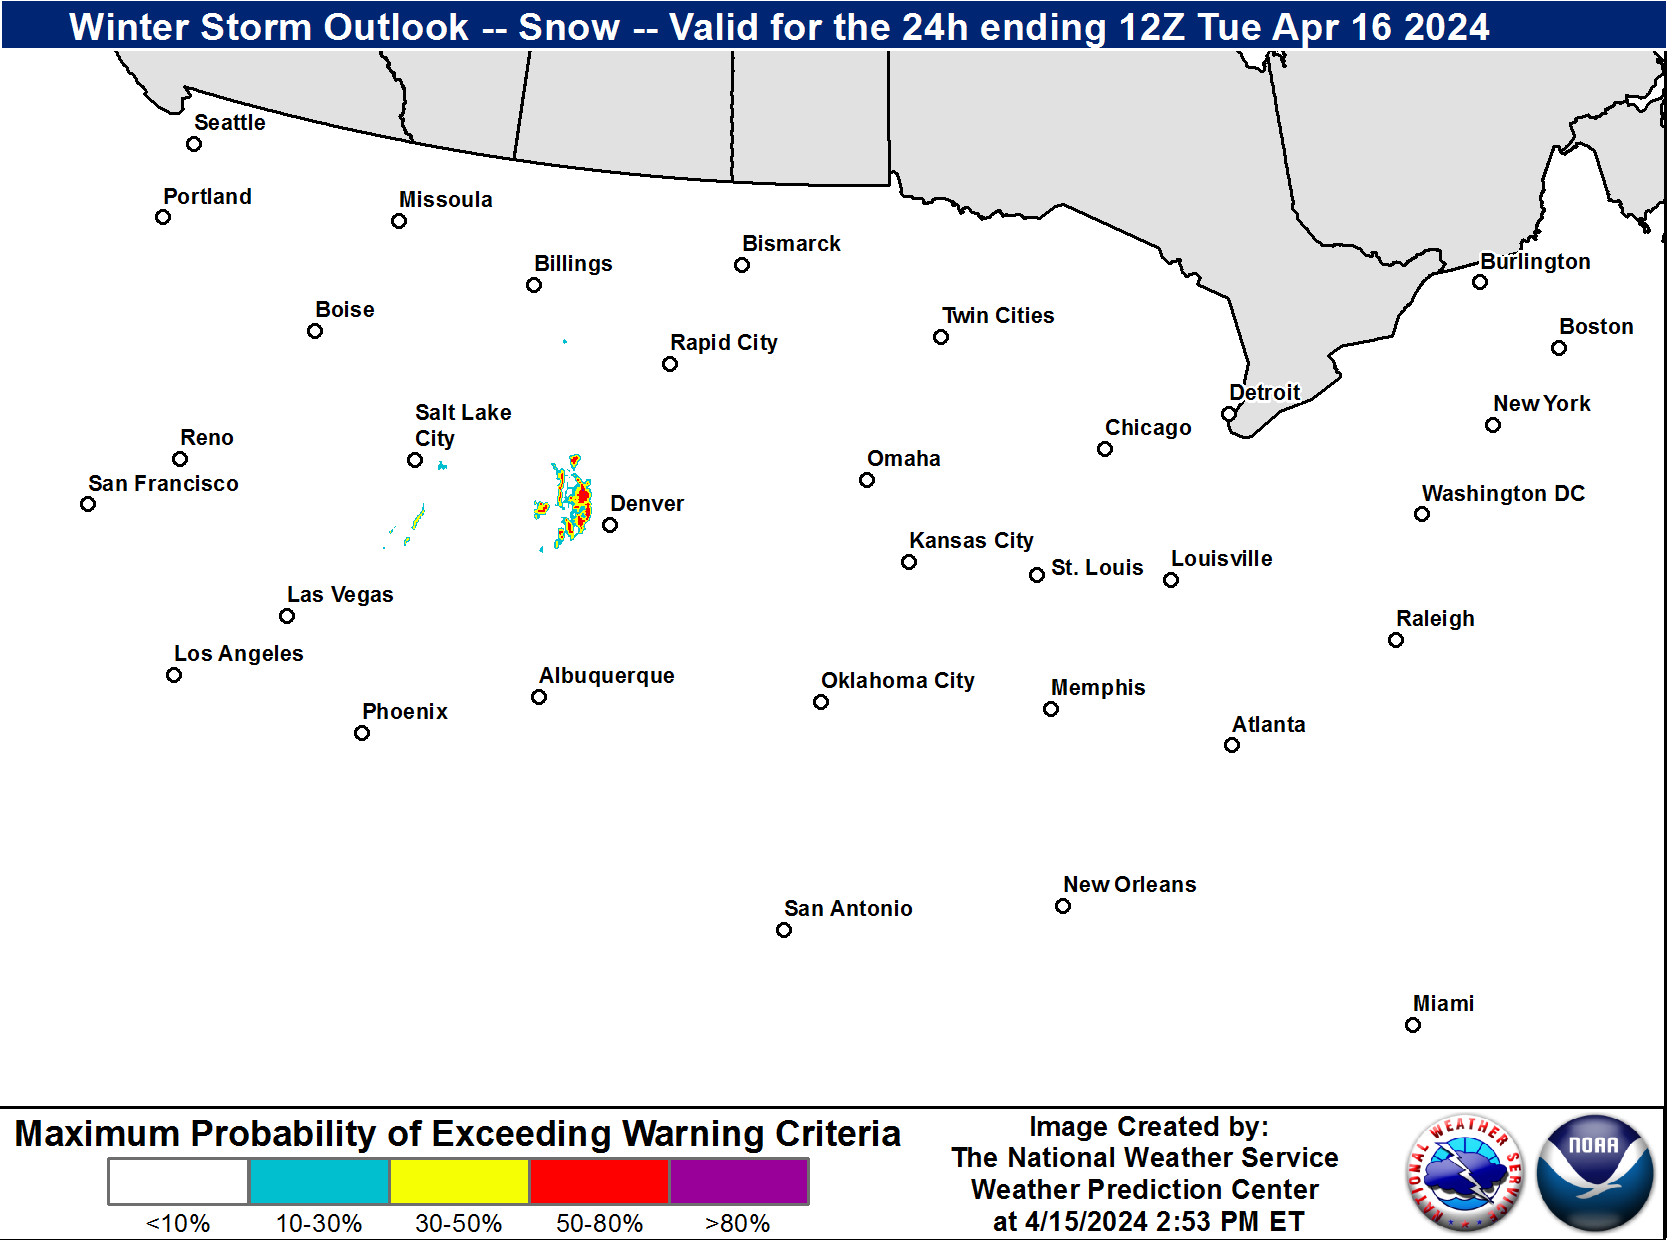
Probability of Exceeding Warning Criteria (Snowfall) Day 2
The probability of exceeding winter storm warning criteria (for snow and ice) during 12-hour and 24-hour time periods on Day 2 for any given location in the US.
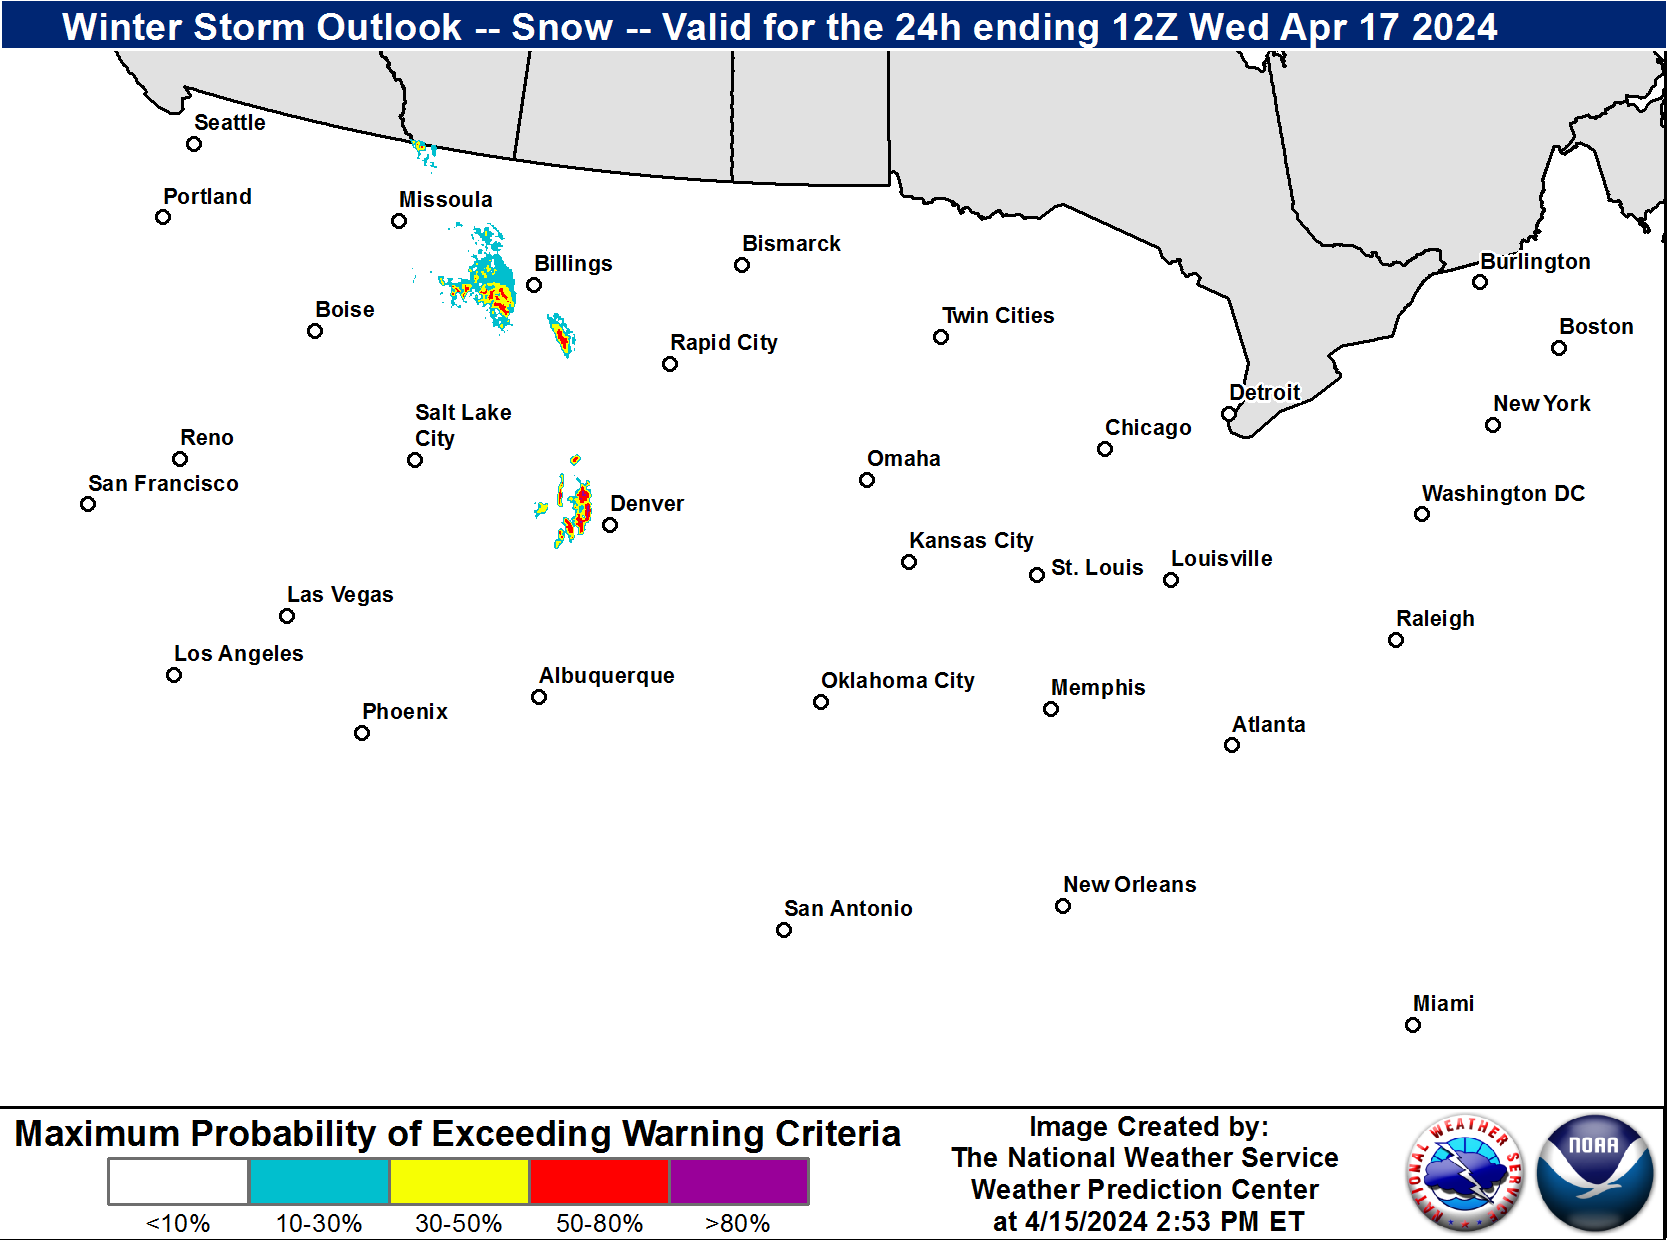
Probability of Exceeding Warning Criteria (Snowfall) Day 3
The probability of exceeding winter storm warning criteria (for snow and ice) during 12-hour and 24-hour time periods on Day 3 for any given location in the US.
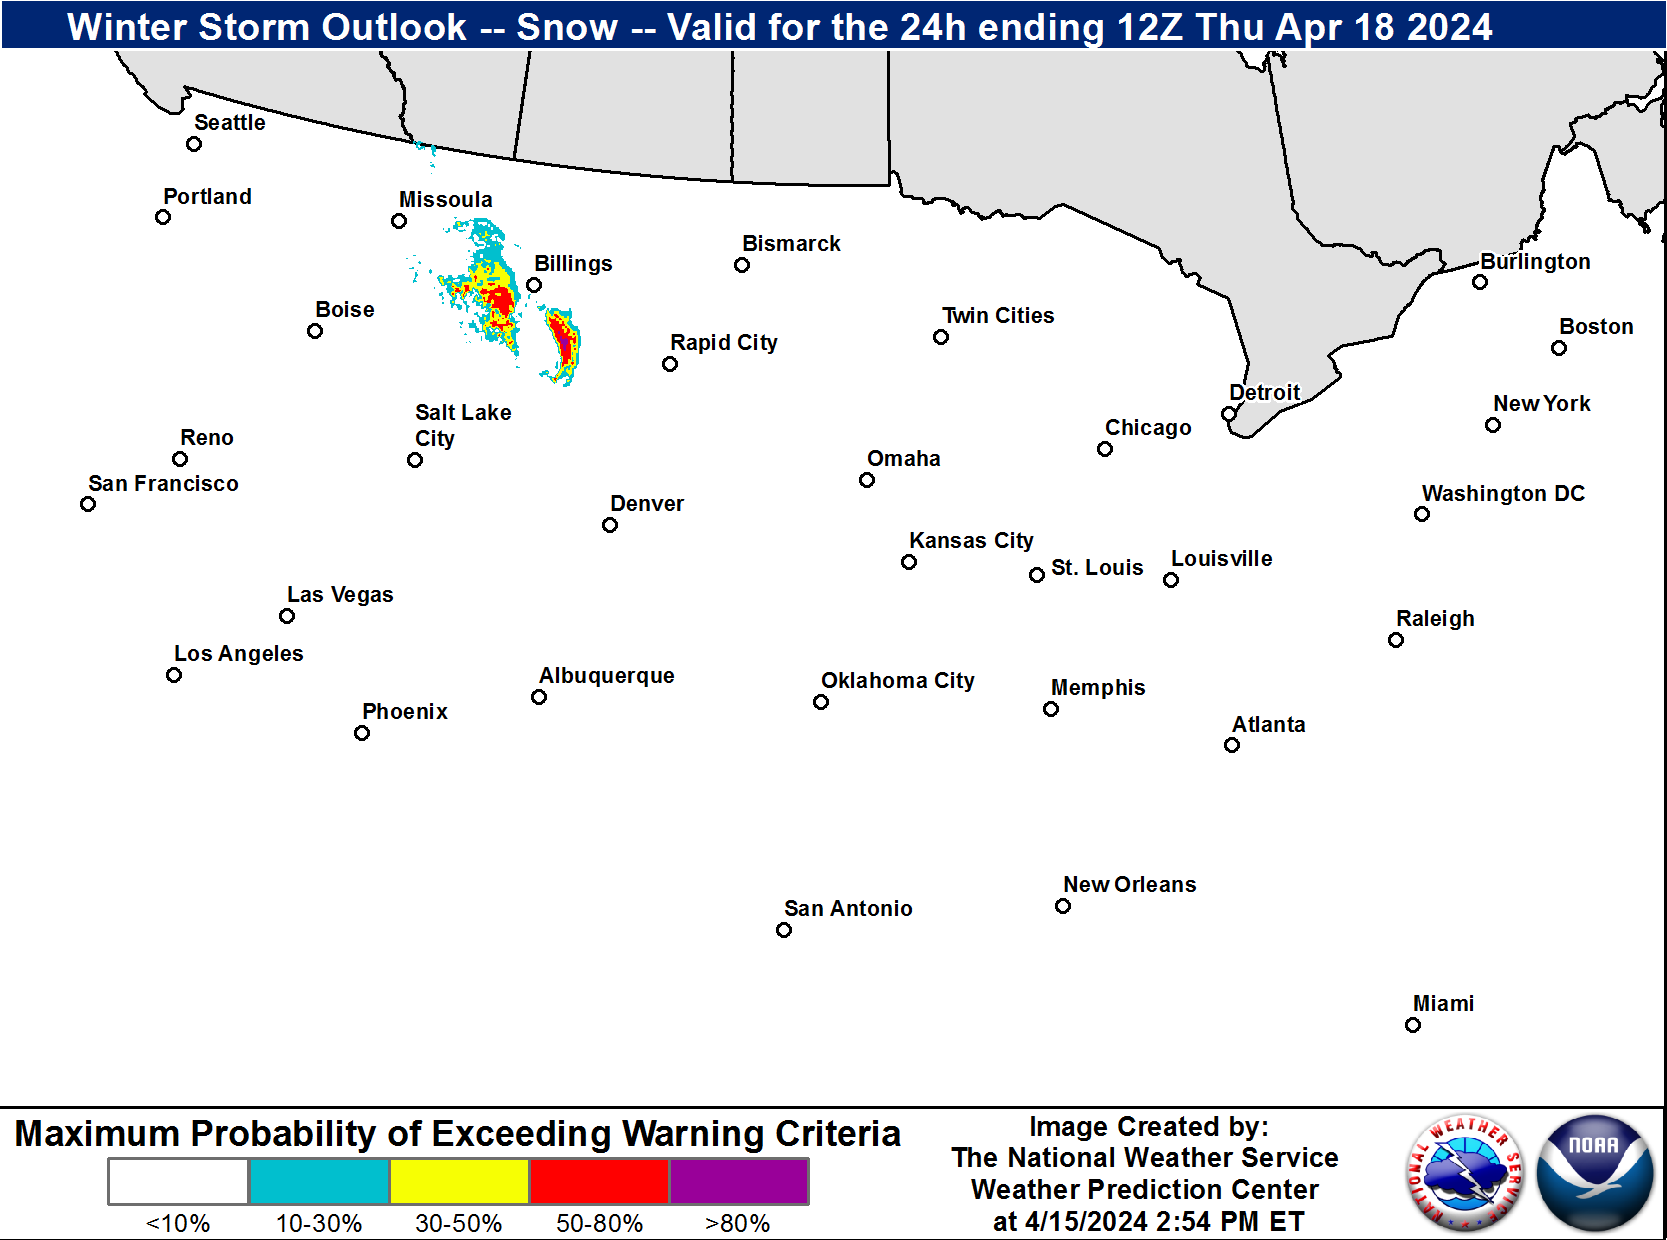
Probability of Exceeding Warning Criteria (Snowfall) Day 4
The probability of exceeding winter storm warning criteria (for snow and ice) during 12-hour and 24-hour time periods on Day 4 for any given location in the US.
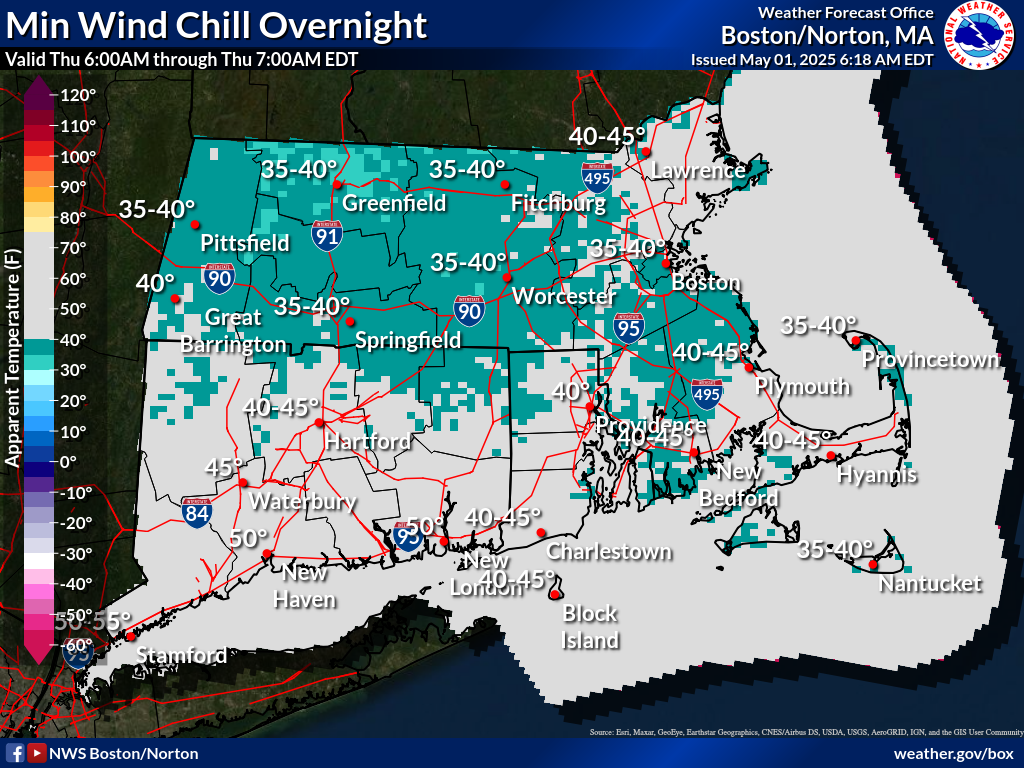
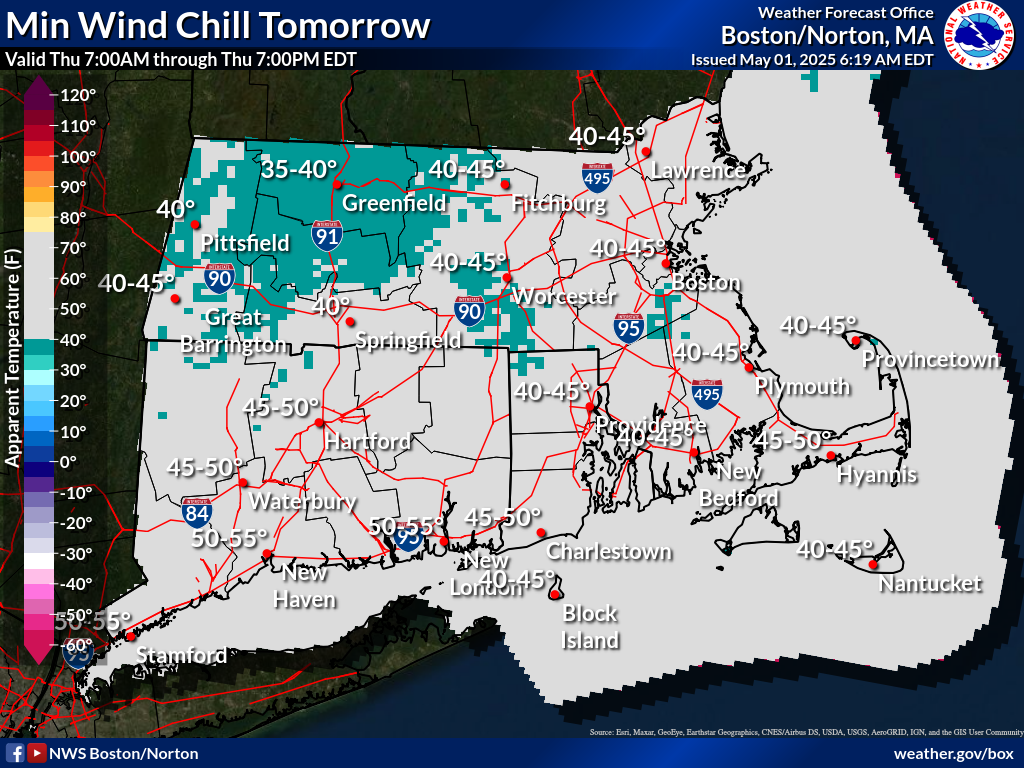
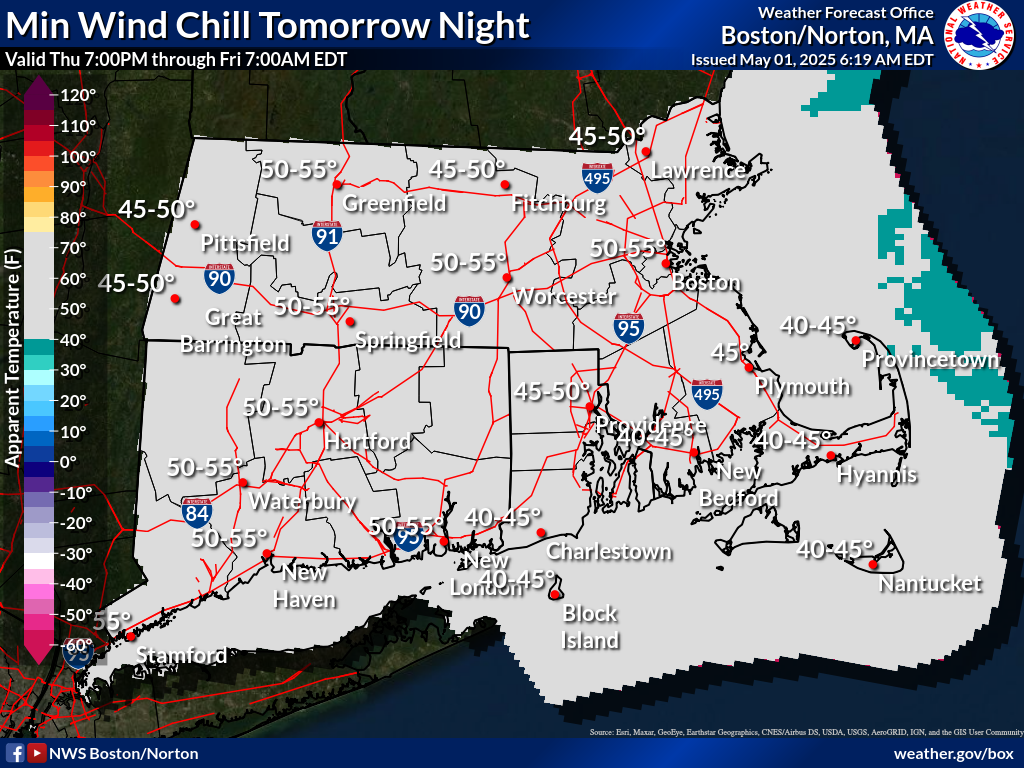
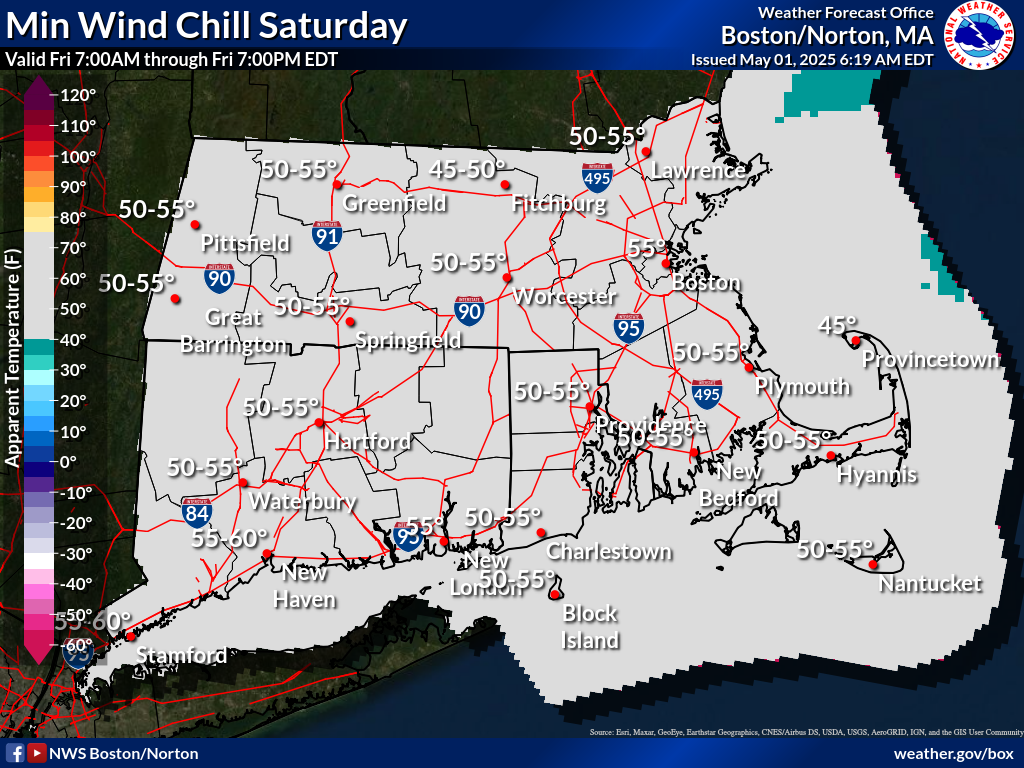
The wind chill temperature is how cold people and animals feel when outside. Wind chill is based on the rate of heat loss from exposed skin caused by wind and cold.
Day 1 Minimum Temperature
Map displays the Southern New England Minimum Temperature Day 1.
Day 2 Minimum Temperature
Map displays the Southern New England Minimum Temperature Day 2
Day 3 Minimum Temperature
Map displays the Southern New England Minimum Temperature Day 3
Day 1 Maximum Temperature
Map displays the Southern New England Maximum Temperature Day 1.
Day 2 Maximum Temperature
Map displays the Southern New England Maximum Temperature Day 2
Day 3 Maximum Temperature
Map displays the Southern New England Maximum Temperature Day 3