National Weather Service United States Department of Commerce

NWS BOX COOP Program

The National Weather Service (NWS) Cooperative Observer Program (COOP Program) is older than the United States, dating to the pre-Revolutionary War colonies. Farmers like Thomas Jefferson and George Washington and scientists like Ben Franklin were always interested in the weather. Many kept detailed daily records and these records are part of the continuing study of our weather and our climate. This interest in weather followed settlers throughout Southern New England and continues today.

The COOP Program is truly the Nation's weather and climate observing network of, by and for the people. Nearly 10,000 volunteers across our Nation take daily weather observations on farms, in urban and suburban areas, National Parks, Water Treatment Plants / Pumping Stations, U.S. Army Corps of Engineer Projects, seashores and mountaintops. The weather data collected is representative of where people live, work and play.

Volunteer Cooperative Observers (COOPs) conscientiously contribute their time and are the weather eyes and ears for their community. The weather observed by our Nation's COOPs is vital to learning more about the floods, droughts, heat and cold waves affecting us all. Users of COOP data include climatologists, builders, architects, engineers, hydrologists, insurance companies, attorneys, politicians and/or public utilities to name but a few. Long term COOP data plays a critical role in the efforts to recognize and evaluate climate trends from local to global scales.
A typical COOP Site

The COOP Program was formally created in 1890 under the Organic Act. Its mission is two-fold:
  • To provide observational meteorological data, usually consisting of daily maximum and minimum temperatures, snowfall and 24-hour precipitation totals, required to define the climate of the United States and to help measure long-term climate changes; and
  • To provide observational meteorological data in near real-time to support forecast, warning and other public service programs of the NWS.
Across Southern New England, there are 70 active COOP sites. Some of these active COOP sites have continuous official weather records dating back to the mid and late 1800s. These sites are: Amherst, MA (1836), Blue Hill in Milton, MA (1885), Brockton, MA (1894), Haverhill, MA (1899), Hyannis, MA (1892), Kingston, RI (1888), Lawrence, MA (1856), Lowell, MA (1826), Middleboro, MA (1887), Storrs, CT (1888) and Taunton, MA (1871).


The COOP Program is a National treasure brought to you by its citizens. These volunteer weather observers are silent patriots who on a daily basis throughout the year provide an imprint of climate history across our great Nation. Thus a special thanks to all COOP Observers!

The nuts and bolts of climate data from COOPs include measurements of precipitation, snowfall and temperature. Other measurements made by COOPs include soil temperature, evaporation and hourly precipitation data (HPD). A few COOPs across Southern New England record soil temperature, evaporation and HPD but the majority record precipitation, snowfall and temperature. Descriptions of various COOP equipment are provided below:

Standard Rain Gauge

The instrument used for recording precipitation is the 8-inch Standard Rain Gauge (SRG) and interestingly this has been the instrument of choice for more than a century. The diameter of the can is 8-inches - thus the name. The components of the SRG include the outer can (also know as an overflow can), innertube, funnel, precipitation stick and tripod support.

For the Boston / Taunton Weather Forecast Office area of responsibility, all weather stations are equipped with the SRG (pictured below) to record daily precipitation.

The funnel does just that - it funnels the rainfall into the innertube. In order to provide rainfall measurements to the hundredths of an inch, the measuring tube has a cross sectional area that is one-tenth the cross-section of the funnel. Therefore, when 1 inch of rain falls into the funnel, it fills the measuring tube to a depth of 10 inches. Accordingly, the scale of the measuring stick used with the SRG is graduated to hundredths of an inch.

The measuring tube is 20 inches high and holds exactly 2.00 inches of water. Any additional rainfall will cause the tube to overflow into the outer can - thus the name overflow can. Since rainfall depths in the overflow can are not increased 10 times, the measuring stick can not be used in the overflow can. Instead, the accumulated water in the overflow can must be poured into the innertube then measured with the precipitation stick. This overflow amount is then added to the 2.00 inches which originally caused the water to flow into the overflow can. While the innertube can hold up to 2.00 inches of water, the overflow can has the capacity to hold 20.00 inches of water.

Rain/Snow Gauge Funnel/Tube rain gauge Rain/Snow Gauge

Snow Board and Snow Stick

Pictured, below, left, is a 5-foot snow stake.

Pictured below, center, is a 3-foot snow stake. This stake is helpful in winter to determine the amount of snow remaining on the ground - snow depth. The stake is hatched in whole inches which is how COOPs report snow depth.

Pictured below, far right, is a 40 inch snow stick used for measuring snowfall. The stick is hatched in tenths of an inch which is how COOPs report snowfall.

In the winter time the SRG becomes a snow gauge. The measuring tube and funnel are removed, allowing wintry precipitation to fall directly into the overflow can. At the time of observation, if there is snow in the overflow can, the COOPs will bring the snow gauge indoors, melting the snow with a pre-measured amount of hot water from the inner-tube, then pour both the melted snow and hot water back into the inner-tube, subtracting the amount of hot water added to get the true amount of water for the melted snow. Using the precipitation stick, the COOPs can then get the liquid measure of the wintry precipitation that fell.

At the time of observation, COOPs will also measure any snow that fell during the observation period. Using a snow stick they measure snowfall to the nearest tenth of an inch. They also will report any snow remaining on the ground (snow depth) to the nearest whole inch. Snow depth is the accumulated snow from previous snow storms.

Snow Stick Snow Stake Snow Stick

Temperature Sensor

Many observers record temperature readings: the 24-hour high and low temperatures and the temperature at observation. COOPs report temperature to the nearest whole degree Fahrenheit.

Most COOP sites are equipped with an electronic Maximum/Minimum Temperature System (MMTS) which electronically measures and memorizes the daily maximum and minimum temperatures. But there are a few sites in Southern New England that use the old style liquid-in-glass (LIG) thermometers. The LIG thermometers are housed in a Cotton Region Shelter (CRS) which provides a shaded, well-ventilated area for maximum and minimum thermometers used to acquire daily temperature extremes. The maximum thermometer is made of a long tubular glass filled with mercury whereas the minimum thermometer is a long tubular glass filled with alcohol. Another LIG thermometer that is used by some COOPs is the Taylor U-Tube thermometer.

Maximum/Minimum Temperature System Maximum/Minimum Temperature System Cotton Region Shelter


Pictured is an MMTS system sensor (center) along with the Nimbus readout display unit (left). Inside the CRS (right) are the LIG Max/Min thermometers. On the outside of this CRS and to the right is a Taylor U-Tube Max/Min thermometer.


Evaporation

Some stations have evaporation equipment to document moisture evaporation data used in both hydrology and agriculture.

An evaporation station consists of a pan filled with water, an anemometer that measures wind-run across the pan of water, a submergible thermometer that measures the pan-water temperature, and a hook gauge that measures the amount of evaporation from the pan.

Evaporation Pan


River Gages

Many observers take river and stream level reading to support the NWS hydrology forecast and warning programs. Water levels are measured using either a Wire Weight River Gage or Staff Gage (shown below, respectively).

River Gage Wire Weight River Gage Staff


The COOPs keep a log of their daily weather data on an official NWS form. This information then gets entered into a software program specifically designed for COOPs called WxCoder. At the end of each month, the digitized data in WxCoder gets downloaded by the National Centers of Environmental Information (NCEI) and the Northeast Regional Climate Center (NERCC), where it is quality checked before getting archived and then published.

000
SXUS51 KBOX 261430
HYDBOX


Hydrologic Observations
National Weather Service Boston/Norton MA
1030 AM EDT Fri Apr 26 2024


This summary provides data for Rhode Island, North Central
and Northeast Connecticut, and Massachusetts except for
Berkshire County.


5-8am Local Time Hydrologic Observations
Station 24 Hour Temps 24 hr Present Snow
Precip Cur Max Min Weather Depth New
Ending @7 am


Western Massachusetts...
Including Franklin, Hampshire, Hampden Counties
Amherst 0.00 33 57 27 Clear 0 0.0
Belchertown 0.00 37 57 31 Clear 0 0.0
East Hawley 0.00 34 49 24 Clear 0 0.0
Greenfield No. 3 0.00 35 58 28 Clear 0 0.0
Leverett No. 2 0.00 40 62 29
Sunderland 0.00
Westfield 3 SW 0.00 44 58 30 Clear 0 0.0
Worthington


Central Massachusetts...
Including Worcester County
Ashburnham 0.00 31 55 28 Clear 0 0.0
North Ashburnham
Barre Falls Dam 0.00 29 62 27 Clear 0 0.0
Birch Hill Dam 0.00 0 0.0
Buffumville Lake
East Brimfield Lk 0.00 32 59 31 Clear
Fitchburg Coop
Hardwick 0.00 34 Clear 0 0.0
Milford 0.00 Clear 0 0.0
Northbridge 0.00
Southbridge 0.00 30 Clear 0 0.0
Tully Lake 0.00 36 58 32 0 0.0


Northeast Massachusetts...
Including Middlesex, Essex, Suffolk Counties
Beverly 0.00 40 47 30 Clear 0 0.0
Jamaica Plain 0.00 43 56 32 Clear 0 0.0
Lawrence
Lowell 0.00 32 59 32
Middleton 0.00 48 54 28 Clear 0 0.0
Reading


Southeast Massachusetts...
Including Bristol, Norfolks, Plymouth, Barnstable, Dukes Counties
Blue Hill Coop 0.00 41 55 32 Clear 0 0.0
MISSING
East Sandwich 0.00 50 50 27 Clear 0 0.0
East Wareham
Edgartown
Franklin
Hyannis Coop 0.00 43 52 32 Clear 0 0.0
Middleboro
Nantucket Coop
Norton West 0.00 30 56 29 Clear 0 0.0
NWS Boston/Norton 0.00 31 55 29 Clear 0 0.0
Rochester 0.00 32 54 28
Vineyard Haven
Walpole 0.00 Clear 0 0.0
West Harwich


North Central and Northeast Connecticut...
Including Hartford, Tolland, Windham, and Eastern Litchfield
Counties
Barkhamsted
Burlington
Hampton
Staffordville 0.00 29 55 29 Clear 0 0.0
Storrs 0.00 40 55 29
West Thompson Lk 0.00 31 57 27 Clear 0 0.0


Rhode Island...
Including Providence and Kent Counties
Block Island Coop 0.00 44 47 33 Clear 0 0.0
Coventry 0.00 0 0.0
MISSING


River stage and pool elevation data are contained in the
Daily River Summary Product under the Header BOSRVDBOX or
WMO Header FGUS51.


$$


000
ASUS61 KBOX 270020
RTPBOX
Max/Min Temperature and Precipitation Table for
Most of Southern New England
National Weather Service Boston/Norton MA
820 PM EDT Fri Apr 26 2024

This is an automated product. These data are preliminary and have not
undergone final quality control by the National Climatic Data Center
(NCDC). Therefore, these data are subject to revision. Final and
certified climate data can be accessed at www.ncdc.noaa.gov.


Values represent lows over the last 18 hours,
highs over the last 18 hours and precipitation over the
last 24 hours.

.BR BOX 0426 ES DH19/TAIRZS/TAIRZI/PPDRZZ
: Max Min 24 Hour
:ID Location Temp Temp Precipitation
:
:Eastern Massachusetts...
BED : Bedford : 57 / 27 / 0.00
BVY : Beverly : 52 / 27 / 0.00
BOS : Boston : 51 / 37 / 0.00
LWM : Lawrence : 58 / 30 / 0.00
EWB : New Bedford : 57 / 29 / 0.00
OWD : Norwood : 61 / 30 / 0.00
PYM : Plymouth : 54 / 29 / 0.00
GHG : Marshfield : 50 / 30 /
:
:Cape Cod and the Islands...
CQX : Chatham : 52 / 31 / T
HYA : Hyannis : 52 / 27 / 0.00
MVY : Marthas Vineyard : 55 / 20 / 0.00
ACK : Nantucket : 53 / 28 / 0.00
FMH : Falmouth : 52 / 27 /
PVC : Provincetown : 52 / 38 /
:
:Central and Western Massachusetts...
FIT : Fitchburg : 62 / 29 / T
ORE : Orange : 61 / 25 / T
CEF : Springfield : 61 / 27 / 0.00
BAF : Westfield : 63 / 28 / 0.00
ORH : Worcester : 59 / 37 / 0.00
:
:Rhode Island...
BID : Block Island : 50 / 32 /
SFZ : Smithfield : 61 / 28 /
UUU : Newport : 52 / 31 / 0.00
PVD : Providence : 59 / 33 / 0.00
WST : Westerly : 52 / 30 / 0.00
:
Northern Connecticut...
BDL : Hartford-Bradley : 65 / 33 / 0.00
HFD : Hartford : 62 / 34 / 0.00
IJD : Willimantic : 61 / 29 / 0.00
:
.END


$$


Historical records for all Cooperative Weather Observing sites across our Nation are available at National Centers of Environmental Information (NCEI): Historical records can also be accessed at the NERCC:
  • Northeast Regional Climate Center
  • 1123 Bradfield Hall
  • Cornell University
  • Ithaca, NH 14853
  • (607) 255-1751
  • www.nrcc.cornell.edu

Climate information can also be accessed via an applied climate information system provided by the NERCC:

http://climodtest.nrcc.cornell.edu/

This climate information system allows one to query climate data in different ways whether for a single station or multi-stations. Here is a list of what you can query:
  • Almanac Data for a Day
  • Activity Planner for a Day
  • Daily Data for a Month
  • Daily Data Listing
  • Daily Degree Days
  • Calendar Day Summaries
  • Monthly Summarized Data
  • Seasonal Ranking
  • Frost/Freeze Summaries
  • Daily/Monthly Normals
  • Temperature Graph
  • Accumulation Graph
And yet another avenue to query climate data from Coop sites as well as Automated Service Observing Systems (ASOS) is through what is called NOAA Online Weather Data (NOWData). NOWData is an applied climate information system complements of the NERCC.

NOWData can be accessed at:
http://www.nws.noaa.gov/climate/xmacis.php?wfo=box

Here is a list of what you can query:
  • Daily Data for a Month
  • Daily Almanac
  • Monthly Summarized Data
  • Calendar Day Summaries
  • Daily/Monthly Normals
  • Climatology for a Day
  • First/Last Dates
  • Temperature Graph
  • Accumulation Graph

Cooperative Weather Observer Training


WxCoder IV-ROCS
Precipitation Measurement Training
(videos courtesy of CoCoRaHS)

Temperature Measurements Liquid Precipitation Measurements Snowfall Measurements Snow Depth Measurements Liquid Water Equivalent (LWE) Measurements Ice Accretion Measurements


The map below displays Cooperative Observing Stations, airports, and United States Climate Reference Network (USCRN) sites to which the National Centers of Environmental Information (NCEI) maintains records. Data is available in a variety of forms, but for the simplicity of purposes we have provided destinations to station daily, monthly, and annual data, as available.

You can also find a majority of this data in a more dynamic and option-oriented format at the following: NOWdata.

All data herein is considered to be preliminary. In order to obtain certified data, please consult the following:
https://www.ncdc.noaa.gov/customer-support/certification-data


What is the Cooperative Observing Program?ExpandCollapse

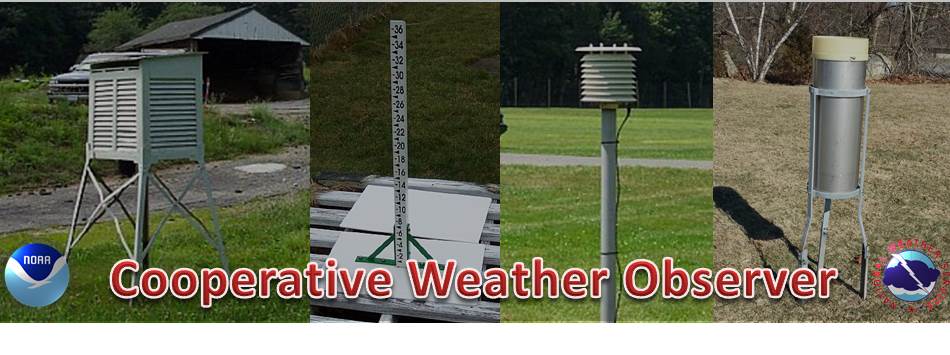
The National Weather Service (NWS) Cooperative Observer Program (COOP Program) is truly the Nation's weather and climate observing network of, by and for the people. Nearly 10,000 volunteers take observations on farms, in urban and suburban areas, National Parks, seashores, and mountaintops. The data are truly representative of where people live, work and play.

The COOP Program was formally created in 1890 under the Organic Act. Its mission is two-fold:
  • To provide observational meteorological data, usually consisting of daily maximum and minimum temperatures, snowfall, and 24-hour precipitation totals, required to define the climate of the United States and to help measure long-term climate changes.
  • To provide observational meteorological data in near real-time to support forecast, warning and other public service programs of the NWS.
Coop observational data supports the NWS climate program and field operations. The program responsibilities include:
  • Selecting data sites.
  • Recruiting, appointing and training of observers.
  • Installing and maintaining equipment.
  • Keeping station documentation.
  • Collecting data and its delivery to users.
  • Maintaining data quality control.
  • Managing human resources required to accomplish program objectives.
Volunteer weather observers conscientiously contribute their time so that their observations can provide the vital information needed. These data are invaluable in learning more about the floods, droughts, heat and cold waves affecting us all. The data are also used in agricultural planning and assessment, engineering, environmental-impact assessment, utilities planning, and litigation. COOP data plays a critical role in efforts to recognize and evaluate the extent of human impacts on climate from local to global scales.

A quick fact sheet can be found here: COOP Factsheet

What is a Cooperative Observing Station?ExpandCollapse

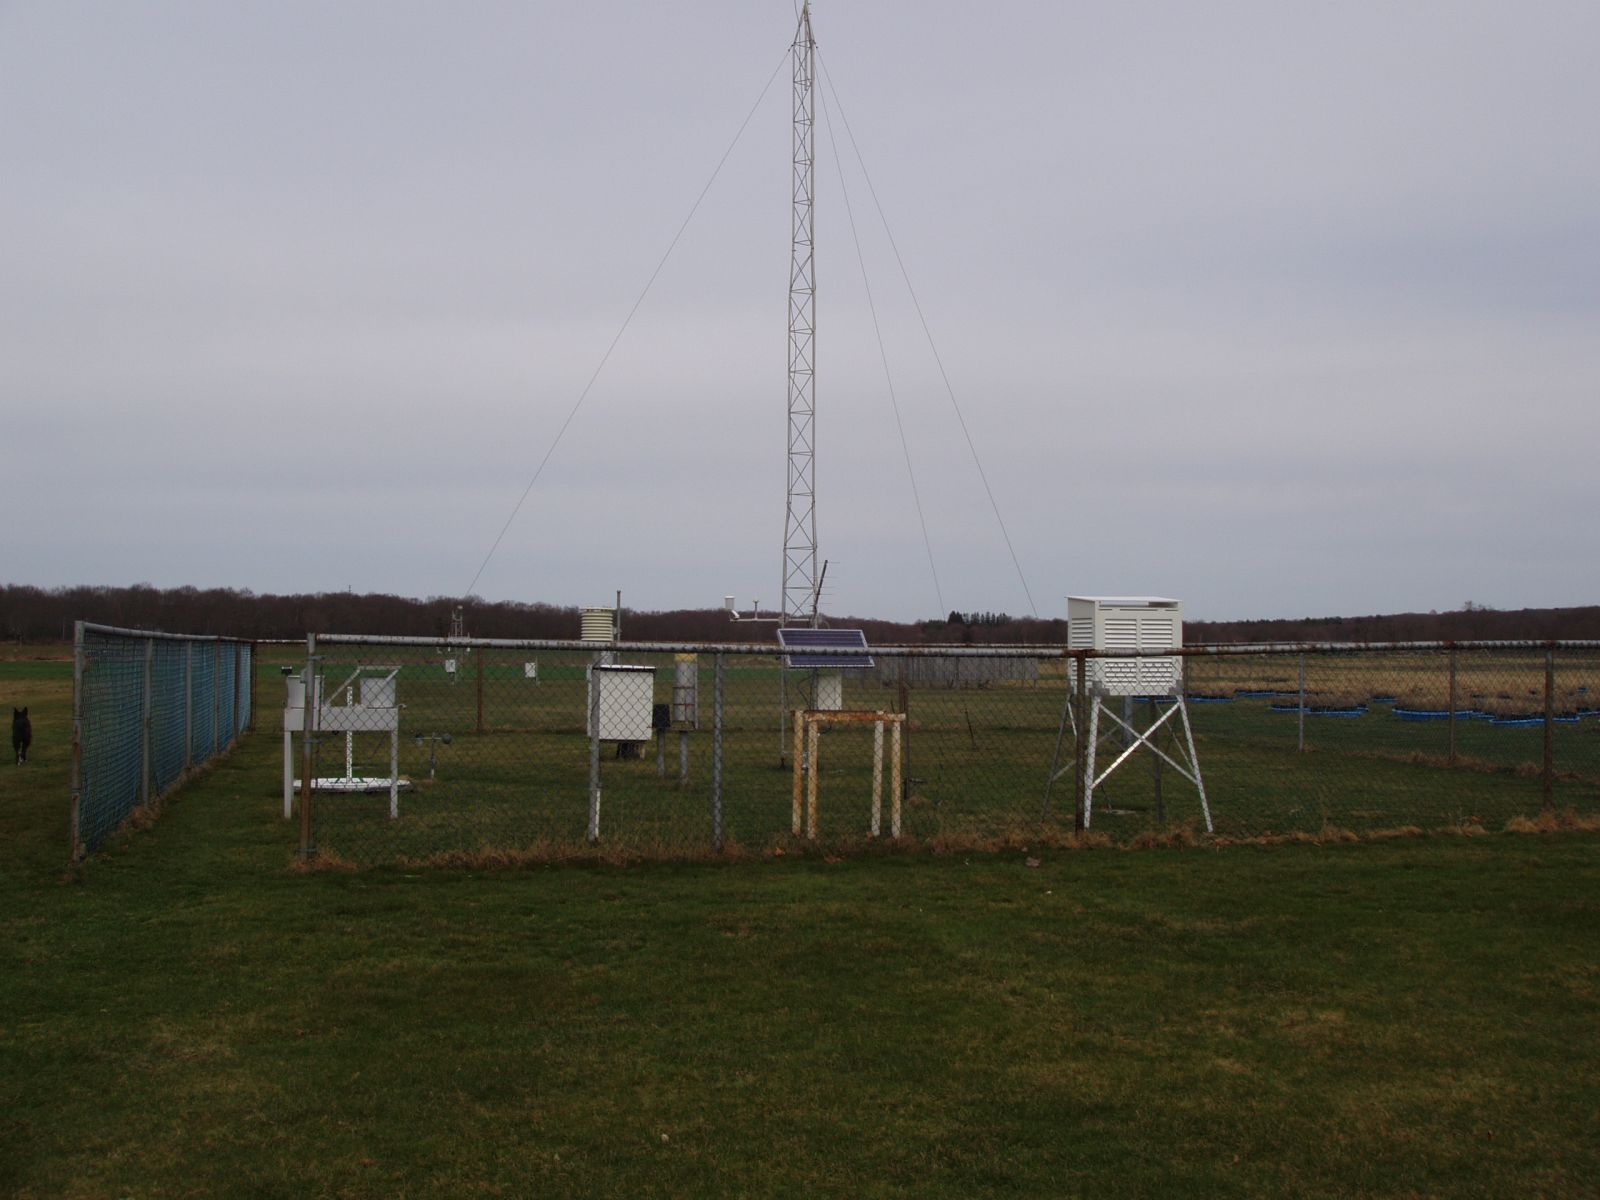
A COOP station is a site where accurate and complete observations are taken or other services rendered by volunteers or contractors, 7 days a week, 365 days a year. 
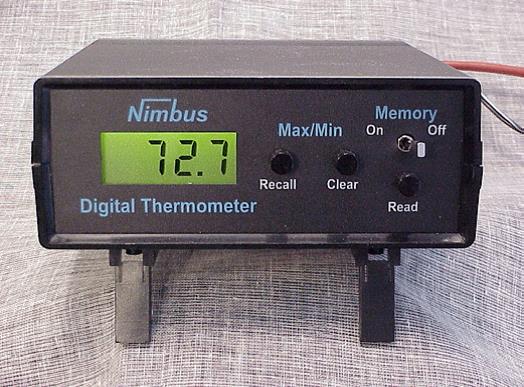
This does not mean that someone has to be monitoring the weather all the time; instruments are provided to monitor temperature and precipitation. Yet someone should be available to record the daily maximum and minimum temperature, the precipitation, and snowfall. This generally is done around 7 am daily. Observations are reported and recorded either through the internet via computer or phone menu system which are then monitored daily by the local NWS office for quality assurance before forwarding to the National Centers of Environmental Information (NCEI) in Asheville, NC.

Automatic observing stations are considered COOP stations if their observed data are used for services which otherwise would be provided by COOP observers. A COOP station may be collocated with other types of observing stations such as standard observations stations, Flight Service Stations, etc. In these cases, that portion of the station observing program supporting the COOP Program's mission is treated and documented independently of the other observational and service programs.

How is the Cooperative Observing Station Sited?ExpandCollapse

Consistency of the measurements is an attribute of the network, and it has been maintained by rare and/or gradual change, and established standards for exposure, of instruments over the life of the network. In order to preserve the integrity of the network, NWS has established standards for equipment, siting, and exposure.

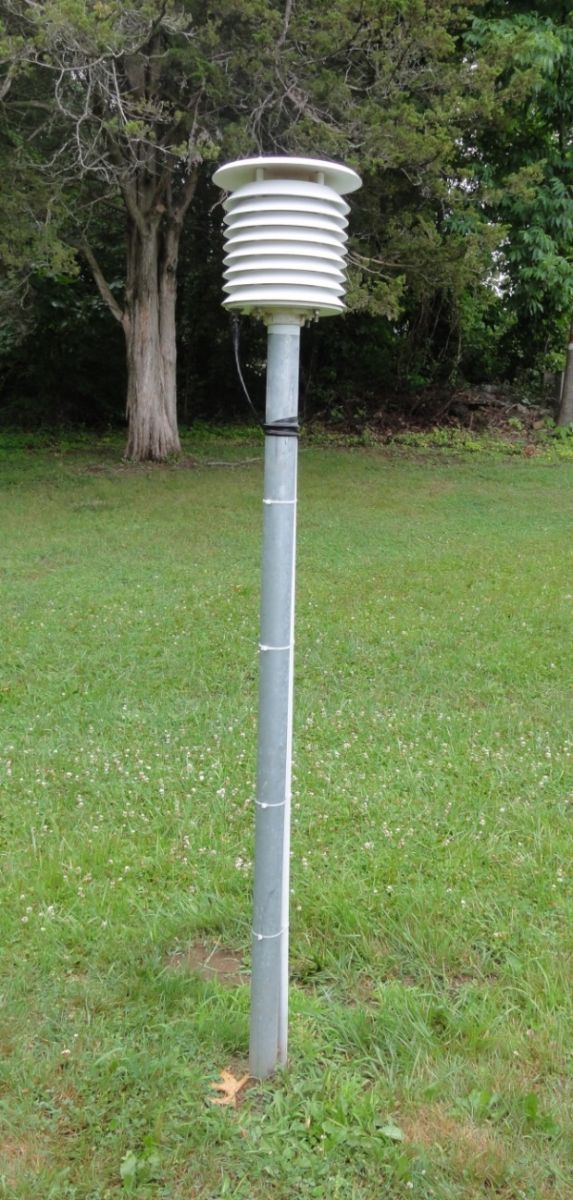
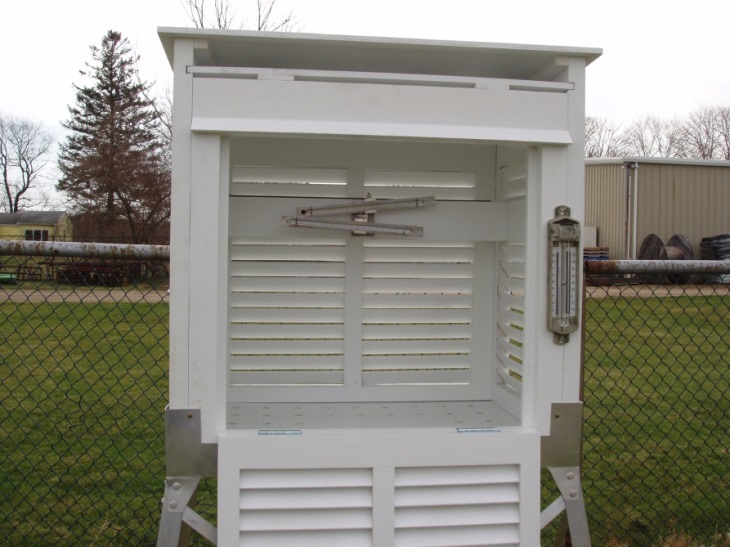
Temperature sensor siting:
  • The sensor should be mounted 5 feet +/- 1 foot above the ground.
  • The ground over which the shelter [radiation] is located should be typical of the surrounding area.
  • A level, open clearing is desirable so the thermometers are freely ventilated by air flow.
  • Sensors are not to be installed on a steep slope or in a sheltered hollow unless it is typical of the area or unless data from that type of site are desired.
  • When possible, the shelter should be no closer than four times the height of any obstruction (tree, fence, building, etc.).
  • The sensor should be at least 100 feet from any paved or concrete surface.
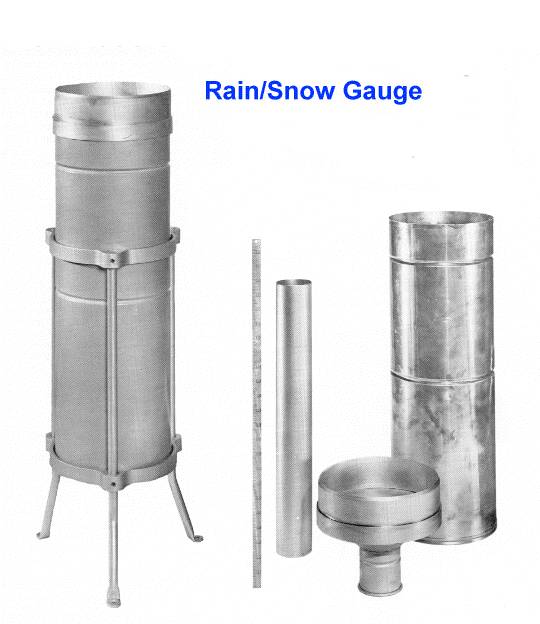
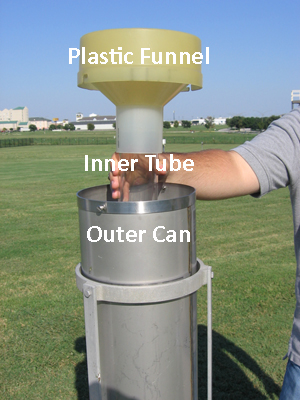
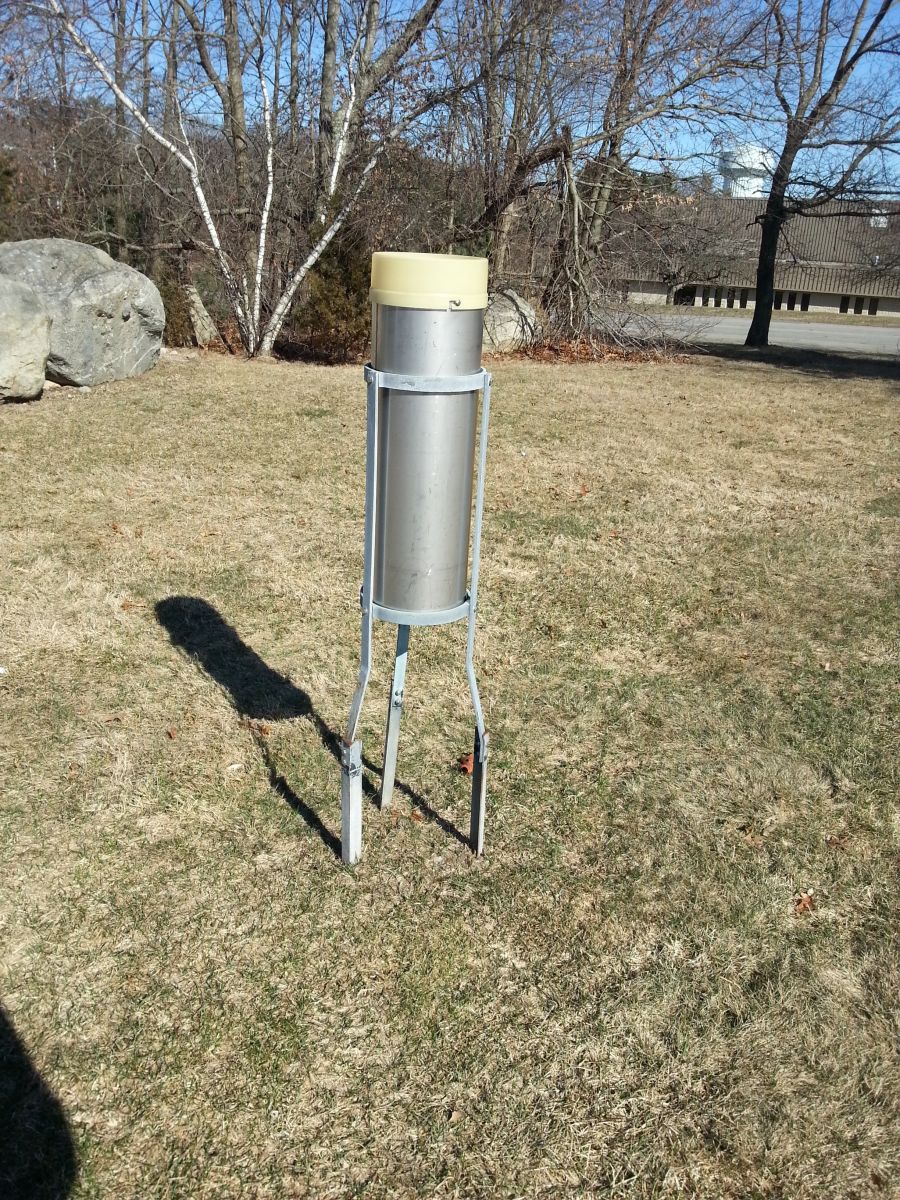
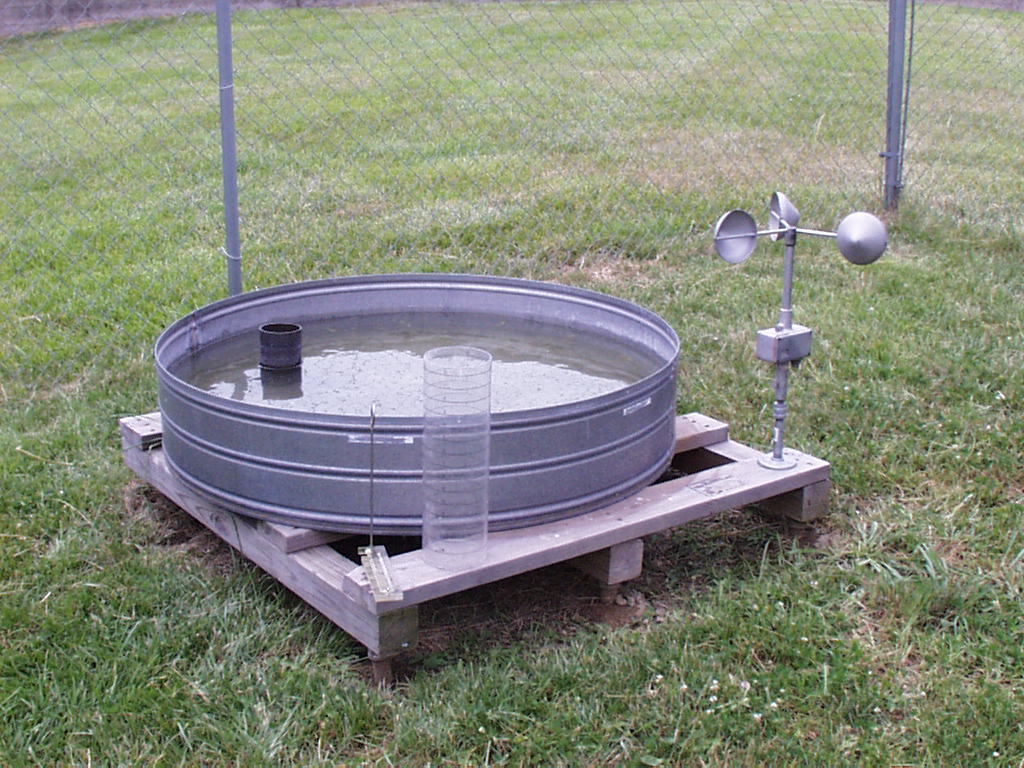
Precipitation gauge siting:
  • The exposure of a rain gauge is very important for obtaining accurate measurements.
  • Gauges should not be located close to isolated obstructions such as trees and buildings, which may deflect precipitation due to erratic turbulence.
  • To avoid wind and resulting turbulence problems, do not locate gauges in wide-open spaces or on elevated sites, such as the tops of buildings.
  • The best site for a gauge is one in which it is protected in all directions, such as in an opening in a grove of trees.
  • The height of the protection should not exceed twice its distance from the gauge.
  • As a general rule, the windier the gauge location is, the greater the precipitation error will be.

How can I become a Cooperative Observer?ExpandCollapse

Though NWS Weather Forecast Offices (WFOs) recruit Cooperative Observers, the distribution of Cooperative Weather Stations is a function of need. Needs are defined by NWS WFOs and data users, while considered within the context of constraints of limited federal resources.

The basic distribution of Cooperative stations in the network are governed by an 1953 Iowa State University study, which determined that a spacing of about one station every 25 miles (one per 625 square miles) was sufficient to adequately define the climate of the United States in areas of homogeneous terrain. Greater densities are allowed in areas with large differences in elevation, urban heat islands, steep land-sea-lake interfaces, etc. Because the network is over 100 years old (established in 1890), many areas already have the necessary stations operating; however, about 200 observers resign each year, about 4 per state. Additionally, changing requirements can expand the need for observers.

Becoming a NWS Cooperative observer volunteer requires the following:
  • Dedication to public service.
  • Attention to detail.
  • Ability to learn and perform daily duties.
  • Willingness to allow NWS to place measuring instruments on your property.
  • Willingness to allow at least one visit per year from a NWS representative.
Additionally, the following capabilities are useful but are not mandatory:
  • Ownership of a personal computer and familiarity with its basic uses.
  • Established internet access.
If you are selected to become an official NWS Cooperative station, NWS will provide you with the equipment, training and supervision you will need to perform your duties. Depending on your station's instrumentation, your site will be visited once or twice every 12 months, more if unscheduled maintenance or training updates are required.

Observers receive no pay.

If you are interested in becoming an NWS Cooperative observer, contact our webmaster.

Is there any training involved in becoming a Cooperative Observer?ExpandCollapse

Observers are not required to take any tests. Training consists of on site, hands on instruction with the designated Cooperative Observer and their backup. This usually is done the same day as the equipment is installed and takes about one hour. If necessary, additional training may be provided upon request. Basic equipment maintenance is discussed and the Cooperative Observer is provided with a name ("point of contact") and a number should additional questions or problems arise. A reference binder is also provided.

What does a Cooperative Observing Station Measure and Report?ExpandCollapse

Observers generally record temperature and precipitation daily and electronically send those reports daily to the NWS and the National Centers of Environmental Information (NCEI). Many cooperative observers provide additional hydrological or meteorological data, such as evaporation and/or soil temperatures. Data is transmitted via telephone, computer or, in special cases, by mail. Equipment used at NWS cooperative stations may be owned by the NWS, the observer, or by a company or other government agency, as long as it meets NWS equipment standards.

Where does the data go?ExpandCollapse

Data is immediately transmitted to the local NWS office where it is used to support the day-to-day operations of the NWS in its forecast and warning decisions. While the data is checked and preliminary published, with the conclusion of each month it is quality-controlled against forms and charts sent in each month by Cooperative Observers. Either flagged for error or accepted as-is through a series of checks and comparisons of the individual station data with surrounding stations to ensure the data is within set tolerances, the data is then archived at the National Centers of Environmental Information (NCEI) in Asheville, NC and formally published as official for public review, as well as certifiable.

This process has been deemed the best practice to keep the data as unbiased as possible. Human error and equipment problems are generally the culprit for erroneous data.

How is the data used?ExpandCollapse

Long term records of COOP observations are the backbone of climate monitoring across the United States. Many COOP sites have periods of record that range from 50 to 100 years, or even longer. These records are used to compute means and trends, and to examine monthly, seasonal and annual variations in our climate.

Over the years, droughts have had tremendous negative impacts on the economy of the U.S. and the quality of life for its residents. At any give time, a significant percentage of the U.S. can be affected by drought. COOP observations are used to compute a number of drought indices, including the Palmer Drought Index. By carefully monitoring drought conditions, we are better able to prepare and properly respond to droughts.

COOP observations from sites with a long period of record, a low percentage of missing data, and few station moves are included in the U.S. Historical Climatology Network (USHCN, Karl et al., 1990). This is a high-quality moderate sized data set of monthly averaged maximum, minimum, and mean temperature and total monthly precipitation developed to assist in the detection of regional climate change. The USHCN is comprised of 1221 high-quality stations from the U.S. Cooperative Observing Network within the 48 contiguous United States.

The USHCN was developed and is maintained at the National Centers of Environmental Information (NCEI) and the Carbon Dioxide Information and Analysis Center (CDIAC) of Oak Ridge National Laboratory through a cooperative agreement between NCEI and the U.S. Department of Energy.

How do I acquire supplies for my Cooperative Observing Station?ExpandCollapse

When you are out of or short on supplies, you may either request supplies by including a note with your form at the end of the month or by emailing box.webmaster@noaa.gov. Either which way, when requesting supplies, be sure to include the following:
  1. Station Location
  2. Station ID
  3. Supply Request (i.e., stamps, B-91 Forms, B-92 Forms, B-83 Forms, B-91/B-92/B-83 Envelopes, Fischer-Porter Envelopes)

My Cooperative Observing Station requires maintenance. Who should I contact?ExpandCollapse

Does your equipment require attention? Here's the place to contact us for any repairs that need to be made to your equipment. For equipment problems, email box.webmaster@noaa.gov with your 1) Station Name, 2) ID and 3) station issues.

To be eligible for the awards listed below, observers' excellence must include accuracy, promptness, legibility, cooperation, consistency and care of equipment. These things must have been done over a long period of time.

Two of the more prestigious awards are the Thomas Jefferson award and the John Campanius Holm award. Both were created in 1959 for the National Weather Service to honor cooperative weather observers, and the first of each was presented in 1960.

Thomas Jefferson ExpandCollapse

This award is to honor cooperative weather observers for unusual and outstanding achievements in the field of meteorological observations. It is the highest award the NWS presents to volunteer observers. The award is named for Thomas Jefferson, third president of the US. Jefferson made an almost unbroken series of weather observations from 1776 to 1816. No more than 5 Jefferson awards are given annually. This certificate is signed by the Secretary of Commerce and the Under Secretary for Oceans and Atmosphere. To be eligible for the Jefferson award, a candidate must have received the Holm award at least five years prior, and must still be performing her or his duties in an outstanding manner.

John Campanius HolmExpandCollapse

This award is to honor cooperative observers for outstanding accomplishments in the field of meteorological observations. It is named for a Lutheran minister, the first person known to have taken systematic weather observations in the American Colonies. Reverend Holm made observations of climate without the use of instruments in 1644 and 1645, near the present site of Wilmington, Delaware. No more than twenty-five Holm awards are given annually. The certificate is signed by the Administrator of the National Oceanic and Atmospheric Administration (NOAA).

Earl StewartExpandCollapse

This award was named for an observer in Cottage Grove, Oregon. Mr. Stewart completed 75 years of continuous observations in 1992. The criterion for this award is that an observer serve the NWS as an observer for a period of 75 years or more.

Ruby StufftExpandCollapse

In 1991, Mrs. Ruby Stufft of Elsmere, Nebraska, completed 70 years as a cooperative observer. This award was named in her honor, and is presented to any observer attaining 70 years of service.

Albert J. MeyerExpandCollapse

The award was named after an observer at Eagle Pass, Texas. In 1870 Mr. Meyer was appointed to establish and direct the "Division of Telegrams and Reports for the Benefit of Commerce," now known as the NWS. Anyone who serves as an observer for 65 years is eligible for this award.

Helmut E. LandsbergExpandCollapse

This award was created in 1986 in honor of Dr. Helmut E. Landsberg, one of the preeminent climatologists of our time. This award is presented to all observer who have completed 60 years of service as cooperative observers.

Edward H. StollExpandCollapse

This award was created and became effective in 1975 in honor of Mr. Edward H. Stoll. Mr. Stoll was the observer at Elwood, Nebraska for over 76 years and was the first to receive the prestigious Stoll award. To receive this award, an observer must have taken observations for 50 years.

Length of Service AwardsExpandCollapse

Cooperative observers may be given length-of-service emblems every five years, starting at ten years of service to 50 years of service. There are also length of service certificates that may be issued every 5 years through 50 years. The 10 and 15 year certificates are bronze, the 20 and 25 year are silver, and the 30 through 50 year are gold. 60-year observers and higher will receive a letter signed by the President of the United States.

Institutional Awards ExpandCollapse

Institutions include schools, power stations, Corps of Engineer dams, local governments, and other entities, where an individual is not identified as the observer. Often, whomever is working at observation time will record the data. Institutions shall receive an award for each 25 years of service. The certificate is signed by the Assistant Administrator for Weather Services and the local official.

Special Service AwardsExpandCollapse

These are presented from a local level, and may be given for any reason that is appropriate. This may include recognition for an individual who has been the primary observer for many years at an institution, and otherwise would not be officially recognized.