|
Following one of the coldest winters in memory, the winter of 2014-15 was just as harsh with prolonged coldness and abundant snow. Snowfall across Western and North Central New York was above normal for most areas, and in some locations well above normal.
The November to March timeframe had temperatures that again finished well below normal. Though this winter’s average temperature was similar to the prior cold winter there were differences. The month of December was a mild month, the only month that finished above normal in this 5-month stretch. The historic February finished as the coldest month in the history of weather observations for Western and North Central New York State.
Snowfall was again plentiful this winter, though both primary climate stations of Buffalo and Rochester finished just shy of the total snowfall from the winter before. The winter season began on a historic note, with two consecutive large lake effect snow events burying locations just south of Buffalo. Combined, the events produced 5 to 7 feet of snow from November 17th through 21st. These first two lake effect snow events were part of 10 total events this winter season.
Much of Western and North Central New York State finished with above normal snowfall this winter, though several locations in the lake effect snow belts of the Boston Hills and Southern Tier, as well as the southern Tug Hill, and eastern Oswego County finished with below normal snowfall.
The constant surges of arctic air produced plentiful ice coverage on rivers and lakes this winter season. Lake Erie froze at the Buffalo Harbor on January 9th with ice remaining over much of the lake through April. Some melting of the ice near the Buffalo harbor yielded an ice out date of April 18th. On Lake Ontario ice formed not only on the traditional eastern half of the lake, but over much of the central portion of the lake as well. The maximum extent of the ice cover occurred in early March, following the historic cold February. Though there was thick ice cover on the rivers, there was minimal ice jam flooding this winter.
A few ice jams with minor river flooding formed after the historic November lake effect snow event, however early season ice cover was thin on most of the area rivers helping to minimize any flooding. A gradual warm-up, lack of significant rainfall and a still unfrozen ground also played key roles in keeping floodingto a minimum. By late in the season ice cover on area rivers was quite thick and concerns for flooding grew as the meltdown began. However, once again a gradual warm-up and lack of a significant rain event allowed for manageable melting of the river ice. East of Lake Ontario the slow spring warm-up also brought manageable snowmelt, with rivers cresting generally a foot or so below flood stage.
Snowfall
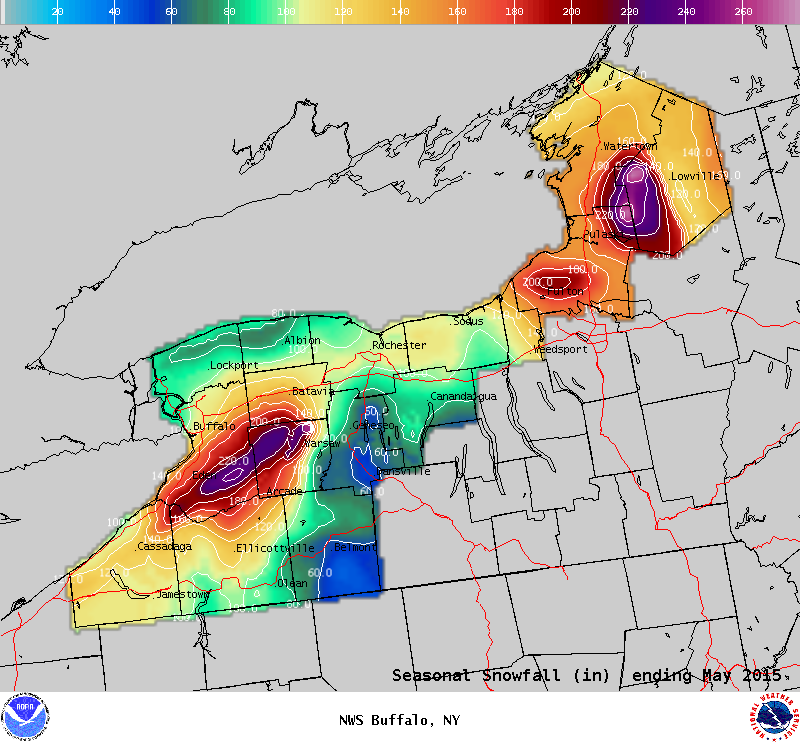
This winter featured another snowy season as lake effect events, and numerous clipper-type lows brought snowfall totals up to above normal. Both the Buffalo and Rochester airports received more than 100 inches this season. The greatest snowfall totals east of Lake Erie generally fell across the hills, with the higherterrain across southern Erie, Wyoming, and the western Southern Tier topping 200 inches. The greatest observed snowfall total occurred in the town of Wyomingin Wyoming County, where 253 inches of snow fell.
East of Lake Ontario is where the greatest observed snowfall totals occurred for our region. The hamlet of Hooker in Lewis County measured 268 inches thisseason. The axis of heaviest lake effect snow this winter east of Lake Ontario was across the climatologically favored area of the central Tug Hill, different thanlast winter where lake snows favored the northern Tug Hill and Watertown area. Even so, Watertown finished the season with 147 inches of snow, still well above average.
Temperatures
Winter Statistics for Buffalo and Rochester
Buffalo
Average Temperature November – March: 26.4F (4.8F below normal)
Snowfall: 112.9” 18.2” above normal (ranked 17th greatest of 131 years)
Days with 1” or more on ground: 92 (ranked 19th (tie) greatest of 121 years)
Rochester
Average Temperature November – March: 27.0F (4.2F below normal)
Snowfall: 101.9” 2.4” above normal (ranked 37th snowiest of 131 years)
Days with 1” or more on ground: 91 (ranked 23rd greatest of 121 years)
Buffalo
|
Type
|
Date
|
New Record (F)
|
Old Date
|
Old Record (F)
|
|
Low Maximum
|
February 15th
|
2
|
February 15th, 1943
|
4
|
|
Low Minimum
|
February 16th
|
-10
|
February 16th, 1883
|
-8
|
|
Low Minimum
|
February 19th
|
-6
|
February 19th, 1944
|
-5
|
|
Low Maximum
|
February 20th
|
1
|
February 20th, 1950
|
6
|
|
Low Minimum
|
February 23rd
|
-7
|
February 23rd, 1889
|
-6
|
|
Low Minimum
|
March 6th
|
-1
|
March 6th, 2007
|
0
|
Rochester
|
Type
|
Date
|
New Record (F)
|
Old Date
|
Old Record (F)
|
|
Low Minimum
|
November 18th
|
26
|
November 18th, 1959
|
26
|
|
Warm Minimum
|
December 24th
|
47
|
December 24th , 1931
|
46
|
|
Low Minimum
|
February 16th
|
-7
|
February 16th, 2004
|
-7
|
|
Low Maximum
|
February 20th
|
6
|
February 20th, 1950
|
6
|
|
Low Minimum
|
February 20th
|
-11
|
February 20th, 1934
|
-4
|
|
Low Minimum
|
February 21st
|
-11
|
February 21st, 1993
|
-1
|
|
Low Minimum
|
February 23rd
|
-7
|
February 23rd, 1889
|
-5
|
|
Low Minimum
|
February 24th
|
-9
|
February 24th, 1889
|
-9
|
Watertown
|
Type
|
Date
|
New Record (F)
|
Old Date
|
Old Record (F)
|
|
Warm Minimum
|
November 11th
|
53
|
November 11th, 1970
|
50
|
|
Warm Maximum
|
November 24th
|
71
|
November 24th, 1979
|
67
|
|
Warm Maximum
|
December 24th
|
59
|
December 24th, 1964
|
55
|
|
Warm Minimum
|
December 24th
|
49
|
December 24th, 1964
|
43
|
|
Warm Minimum
|
December 26th
|
39
|
December 26th, 1973
|
37
|
|
Warm Minimum
|
December 27th
|
40
|
December 27th, 1949
|
38
|
|
Low Minimum
|
January 7th
|
-27
|
January 7th, 1986
|
-20
|
|
Low Minimum
|
February 6th
|
-22
|
February 6th, 1993
|
-18
|
|
Low Minimum
|
February 13th
|
-32
|
February 13th, 1979
|
-28
|
|
Low Minimum
|
February 16th
|
-36
|
February 16th, 1963
|
-24
|
|
Low Maximum
|
February 23rd
|
10
|
February 23rd, 1965
|
12
|
|
Low Maximum
|
March 23rd
|
21
|
March 23rd, 1997
|
21
|
Hemispheric Pattern
For the second straight year, Western and North Central New York experienced a harsh winter as temperatures averaged well below normal. Unlike the previous winter though when the November to March time frame featured colder than normal conditions, the winter of 2014-15 was concentrated on the period following the holidays. To exacerbate the cold, snowfall totals exceeded their 30 year average, particularly in the lake effect snow belts where accumulations in some areas were nearly double their typical amount.
Once again, the proverbial ‘writing on the wall’ for a harsh winter may have been in place during the immediate preceding months of September and October. A weak El Nino was already in place across the Equatorial Pacific with a forecast of similar conditions for the ensuing winter months. Climatologically, Western and North Central New York have typically experienced their coldest winters during weak ENSO events, particularly during weak El Nino’s when our weather is more susceptible to the influences of high latitude blocking. This can occur from persistent ridging over Greenland (-NAO characteristic), or similar blocking along the West Coast of North America. The latter is often defined as a positive PNA pattern and was certainly the most dominant weather player across North America during the previous winter of 2013-14. It was this type of high latitude blocking that would once again define our winter across Western New York.
Our region experienced a preview of the winter to come during the month of November when strong ridging once again became established along the West Coast of North America. The ridge extended across the pole to Western Siberia where an ensuing cross polar flow tapped a large pool of anomalously cold air over Eastern Europe. The result was a cold November across our region with temperatures eerily similar to those from the previous year. The month was highlighted though by a generational lake effect snowstorm that dumped four to seven feet of snow across a large swath of the Buffalo Metropolitan area.
Just when the ominous Buffalo snowstorm and cold November temperatures had everyone bracing for a difficult winter, the West Coast ridge broke down. A temporary increase in the upper level jet crossing the North Pacific helped to knock the ridge down and allow modified Pacific based air to flood the bulk of the lower 48. This enabled Western and North Central New York to get through the busy month of December with above normal temperatures and little snowfall.
The all too familiar West Coast ridge became re-established during the month of January. An unusually strong meridional flow in the vicinity of the Gulf of Alaska enhanced this ridge, which once again extended across Alaska to Western Siberia. This encouraged a deep longwave trough to set up over the eastern half of North America so that very cold air could pour directly south from the Canadian Arctic to the Great Lakes region. Like the previous year, temperatures this January averaged roughly five degrees F below normal. The cold weather supported several notable three to four foot lake snow events east of Lake Ontario, but the west to northwest flow kept snowfall amounts below normal for the Buffalo and Rochester metro areas.
February then proved to be the most brutal month of the season. A weak upper level jet over the Northern Pacific not only helped to keep the West Coast ridge intact, but likely played a role in supporting an exaggerated high latitude block over North America. This pattern was further locked in place by the displacement of the much misunderstood polar vortex which drifted south of James Bay for a period of several weeks. The very highly amplified pattern kept a near constant feed of frigid arctic air in place over our region, which plummeted our mercury to levels that averaged 15 degrees F below normal. This is extraordinary considering that the coldest weather of the year occurs during the second half of January and the first half of February, so to be that much below those ‘normal’ values is quite impressive.
The near unprecedented cold was accompanied by several storms that generated one of the snowiest months of the winter. Snowfall totals for the month of February were at least two feet above normal in most areas. It is also worth noting that while the colder, more southerly storm tracks generated higher snowfall amounts, it also kept our region from experiencing the usual number of high wind events.
While the upper level pattern did become less amplified during the month of March, the West Coast block remained firmly in place. This prolonged the long stretch of below normal temperatures across the lower Great Lakes while producing near normal amounts of late winter snow. The persistent pattern finally broke down in its entirety in late March and early April when a strengthening jet over the Northern Pacific directed several vigorous disturbances into British Columbia.
Looking at the winter of 2014-15 as a whole, the dominant weather pattern was clearly the stubborn West Coast ridge. This feature was nearly identical to the one that ultimately controlled our frigid winter from the winter before, and very similar to the notorious winter of 1976-77. Each of these years featured a weak or neutral ENSO event over the Equatorial Pacific. They also shared a highly amplified positive PNA pattern with a West Coast ridge extending across the North Pole to Siberia… effectively displacing the polar vortex southwards to Northern Ontario. The proximity of the underlying arctic air made it easy for frequent intrusions of frigid air across the Great Lakes Region. In effect, the presence of an established ENSO event would have very likely prevented the latter hemispheric pattern from developing.
Since this past winter became increasingly harsh with the worst weather being concentrated in the second half of the season, there was likely a greater impact psychologically as the long winter seemed to persist well past its normal expiration. The winter may have also been tougher to deal with as many probably did not believe that a second harsh winter in a row would be possible. It was truly reminiscent of the back to back winters of the mid 1970s.
Monthly Highlights
November
The hemispheric pattern this month featured a strong ridge of high pressure over Alaska and the western United States, with a trough of low pressure over the eastern half of the United States. This amplified pattern led to late autumn warmth replaced by outbreaks of arctic air. Through the first two weeks of November we had two brief warm-ups, the 3rd-6th and the 10th-12th. After the first warm-up a cold front slide across the region with rain showers and some of the first widespread snowflakes of the season on the 7th. After the second warm-up a cold front brought the first widespread measurable snowfall to Western and North Central New York on the 13th of the month.
Temperatures dropped to below normal the third weekend of the month, which set the stage for an epic lake effect snow event downwind of Lake Erie. A deep upper level low was situated over the western Great Lakes with cold southwest winds rushing over the warm lake waters (temperatures in the upper 40s) of Lake Erie. A band of very heavy lake effect snow brought upwards of 4 feet to localized areas from the evening of the 17th, through the first part of the 19th. This band remained nearly stationary, while producing snowfall rates up to 5 inches per hour. After a brief lull in the action, another band of very heavy lake effect snow formed off Lake Erie later on the 19th and produced upwards of another 4 feet of snow across some of the same areas by the 21st. This second snow band was similar to the first snow band in that it again remained nearly stationary with very high snowfall rates. One difference was that the second event`s axis of heaviest snowfall was just a few miles south from the axis of heaviest snow with the first event. In total 5 to 7 feet of snow smothered towns just to the south of the Buffalo airport, while just over a foot of snow was measured on the airport grounds. Many towns south of the airport had travel bans that lasted days, with all major roads in and around Buffalo closed for a period of time. There was a very sharp gradient to the snowfall that fell through the week, with areas to the north of the Buffalo airport receiving a foot or less of snowfall. This lake effect event diminished in intensity over the western Genesee Valley, with just a few inches of snow measured in the Rochester area. East of Lake Ontario lake effect conditions were not as favorable for an epic lake effect event, though several feet of lake effect snow did fall east and northeast of the lake.
Unseasonably warm air poured over New York State on Monday the 24th with temperatures rising into the 60s and lower 70s. This warmth quickly melted a good portion of the snow that fell the prior week. The ablation of the snowpack brought minor flooding on local creeks and rivers in western New York, but urban flooding was held in check as a still sizable snowpack remained across the Buffalo Southtowns. In total there were three lake effect snow events this month.
December
A cold front crossed the region early on the 1st of December sending mild temperatures in the lower 50s around midnight down to the lower 30s by afternoon. The first two weeks of the month featured a trough of low pressure over the eastern United States which allowed for a cold Canadian air mass to drop southward across the Great Lakes. However conditions were not favorable for lake effect snow. There was one major synoptic storm system, a closed low that dropped a half to one foot of snow across Western and North Central New York. Behind this synoptic system freezing drizzle fell through the duration of the weekend from the 12th through the 14th. For the remainder of the month a zonal west to east flow dominated with just brief intrusions of colder air. After a relatively quiet third week, a convective line of showers ahead of a cold front crossed the region Christmas Eve, bringing damaging wind gusts across the Niagara Frontier, downing power poles and trees in various locations. High winds continued into Christmas Day with additional isolated damage. The month ended on a cold note with light lake effect snow falling throughout the region. This lake effect snow was the beginning of the sole lake effect snow event of the month, with this event carrying into January.
January
The New Year began with lake effect snow downwind of the eastern Great Lakes on a gusty southwest wind. This wind proved too strong for a healthy band of lake snow to develop, though several inches of snow did coat Western and North Central New York on New Year’s Day. The next three days of January were atypical for the month as a whole, as a southerly flow and above normal temperatures were coupled with a soaking rainfall. Over an inch of rain fell across western New York on the 3rd and 4th, with the greatest rainfall amounts found just to the northeast of Lake Erie. A surge of very cold air reached the eastern Great Lakes on the 5th, and remained across the region for the better part of a week. This cold air mass produced three moderate lake effect snow events east of Lakes Erie and Ontario with each event dropping between one and two feet of snow.
By the middle of the month the arctic air mass retreated and a westerly flow returned across the eastern Great Lakes region. This westerly flow concentrated the arctic cold well to our north, allowing western New York to cycle through temperatures near normal. Within this westerly flow, there were several synoptic clippersthat crossed New York State (12th, 26-27th and 29th-30th) with typical light snowfalls. On the 24th widespread light freezing rain and drizzle glazed western New York with hundreds of cars sliding off the roadways. An area of high pressure brought crystal clear blue skies on Wednesday January 28th. Cold air returned for good at the end of the month with air temperatures again dipping to well below normal.
February
The coldest calendar month on record was established this February 2015 as a constant siege of very cold air masses brought day after day of well below normal temperatures. Nearly every day this month was below normal across Western and North Central New York State, and about a third of the days this month were 20F or more degrees below normal. This February also was one of the snowiest February’s on record for Western and North Central New York.
The month began with a significant snowstorm that dropped a foot to a foot and a half of snow across Western and Central New York. Through the first week temperatures did manage to climb to around the freezing mark twice, on both the 4th and the 7th. Thereafter a strong ridge of high pressure aloft was anchored over the western third of North American, while a deep trough of low pressure was carved over the eastern two thirds of North America. This persistent flow in the jet stream allowed for arctic air to flow southward across Canada and towards the Great Lakes region. This cold air mass would then linger through the end of the month over eastern Canada and the eastern United States. The extremely cold air set several daily low temperature records through the last three weeks of the month. The final two and a half weeks of the month averaged 15F to 20F degrees below normal across Western and North Central New York State. Within the northwest flow this month several clipper systems passed through bringing light snows to our region, along with air temperatures moderating slightly from their frigid values. Behind each clipper low a fresh arctic air mass replenished the cold air across the Great Lakes region sending air temperatures to well below normal values yet again.
The final three lake effect snow events of the year occurred in February. These events were minor east of Lake Erie as the lake was just about completely frozen over, while across the eastern end of Lake Ontario the three lake effect snow events carried an average magnitude of around a foot of snow each. A good portion of Lake Ontario was covered in ice by the end of February, with nearly all of the central and eastern sections of the lake ice covered.
March
Overall March was a tame month with a slow warming, but still a largely below normal temperature trend. There were no
significant storm systems within this moderating air mass this month. This was beneficial as it allowed for manageable
snowmelt following a harsh and snowy winter that left a deep snowpack across the region. Though creeks and rivers rose
within the manageable snowmelt, and there were minor ice jams, there was very little in the way of hydrologic issues
this spring. After a very cold January and February, the 38F degree reading on the 3rd was the first above freezing
temperature for the Buffalo airport since January 29th. This is a span of 32 days which is the 4th longest stretch on
record.
April
April was a typical spring month across Western New York with fluctuations in air temperature to start the month. The final snows of the winter season fell this month. The Saturday before Easter Sunday saw a minor coating of snow across the region, with several inches across the hill tops. A dominating ridge of high pressure brought springs warmth and sunshine across the region for the middle of the month. Later in the month a slow moving cut-off upper level low brought cool temperatures the third week of April with a minor snow accumulation on the 23rd and 24th. South of Buffalo and southeast of Lake Ontario 3 to 5 inches of spring snow accumulated.
|