
A developing storm across the Plains will bring rounds of severe weather for center of the nation the next couple of days. In addition, increasing temperatures and winds with low humidity values will raise wildfire concerns for portions of the Southwest. These temperatures may set new records for southern Texas this week. The northern Great Basin and northern Rockies, cooler conditions arrives. Read More >
Current Conditions | Forecasts/Outlooks | Severe Thunderstorms | Precipitation/Hydrology | Tropical Weather
Fire Weather | Winter Weather | National Hazard/Climate Outlooks | Heat | Tsunamis
IMPORTANT: Be sure to check the date/time of the briefing as some or all of the briefing information may be old. The latest forecast information, including our Forecast Discussion, can be found below and on our forecast page.
|
|
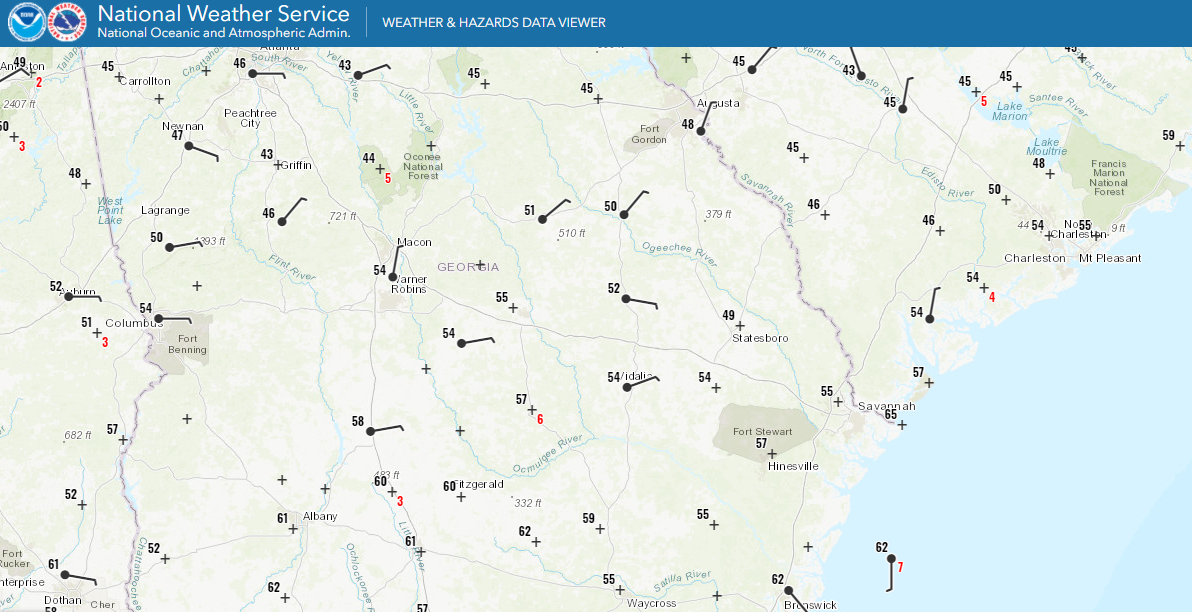
Current ObservationsCurrent weather observations Surface weather maps (issued by the Weather Prediction Center) |
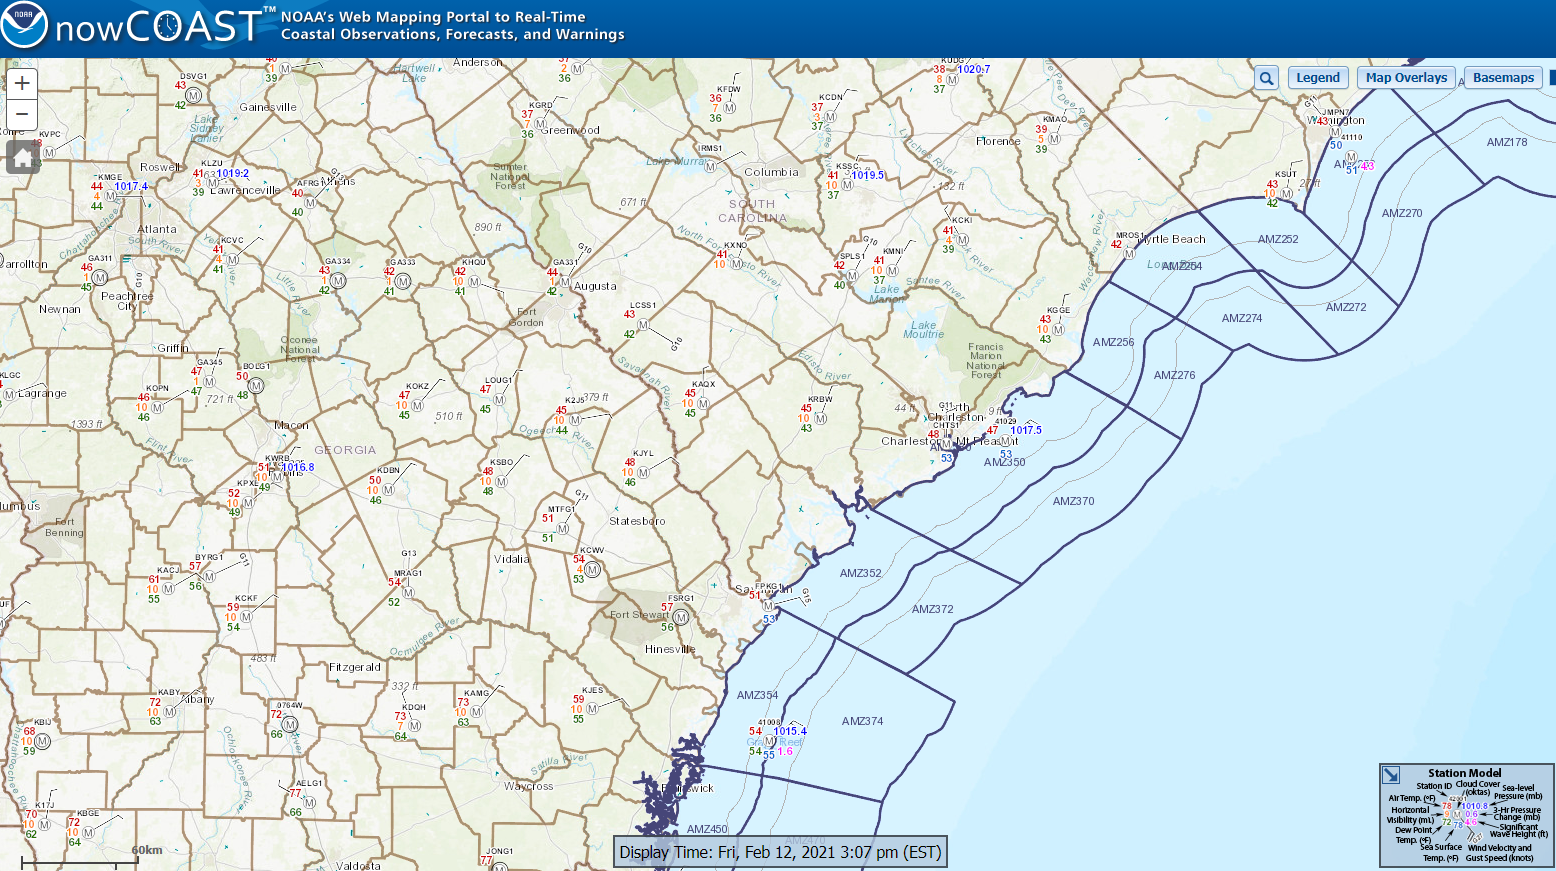 |
Marine/Coastal ObservationsMarine/coastal observations, including water temperatures and tides |
|
|
River/Lake/Tide ObservationsThe Advanced Hydrologic Prediction Service (AHPS) provides observations for river, lake and tide levels |
 |
Radar ImageryDoppler radar imagery across southeast SC/GA Regional | National | Columbia, SC | Wilmington, NC | Robins AFB, GA | Moody AFB, GA | Jacksonville, FL |
 |
Satellite ImageryGOES satellite imagery for the Southeast U.S. |
 |
Local Text Observation ProductsVarious text observation products (issued by NWS Charleston) |
|
|
Graphical Hazardous Weather OutlookExperimental graphics showing the risk of various weather hazards for the SC Lowcountry/GA Coastal Empire over the next 7 days |
 |
River/Lake/Tide ForecastsThe Advanced Hydrologic Prediction Service (AHPS) provides forecasts for river, lake and tide levels |
 |
Local Forecast GraphicsEnhanced forecast graphics, including max/min temperature, max wind/wind gust, max heat index, min wind chill, precipitation amounts, and more |
|
Local Text Forecast ProductsVarious text forecast products (issued by NWS Charleston) |
|
|
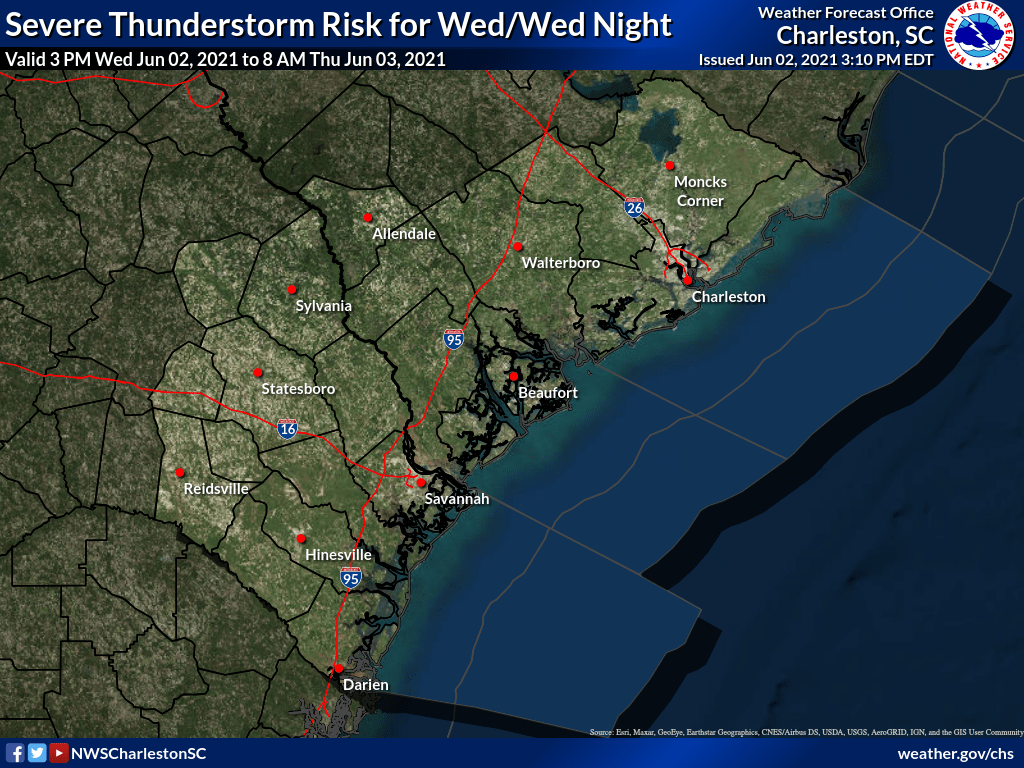
Thunderstorm OutlooksOutlooks indicating the probability for severe thunderstorms within a certain distance of a point (issued by the NWS Storm Prediction Center) |
 |
Mesoscale AnalysisAnalysis of mesoscale weather conditions (from the NWS Storm Prediction Center) |
|
|
Current WatchesCurrent Severe Thunderstorm/ Tornado Watches (issued by the NWS Storm Prediction Center) |
 |
Current Mesoscale DiscussionsCurrent Mesoscale Discussions (issued by the NWS Storm Prediction Center) |
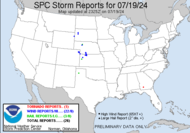 |
Storm ReportsPreliminary reports of tornadoes, large hail and damaging winds |
 |
Report Severe Weather/Damage To Us
|
|
|
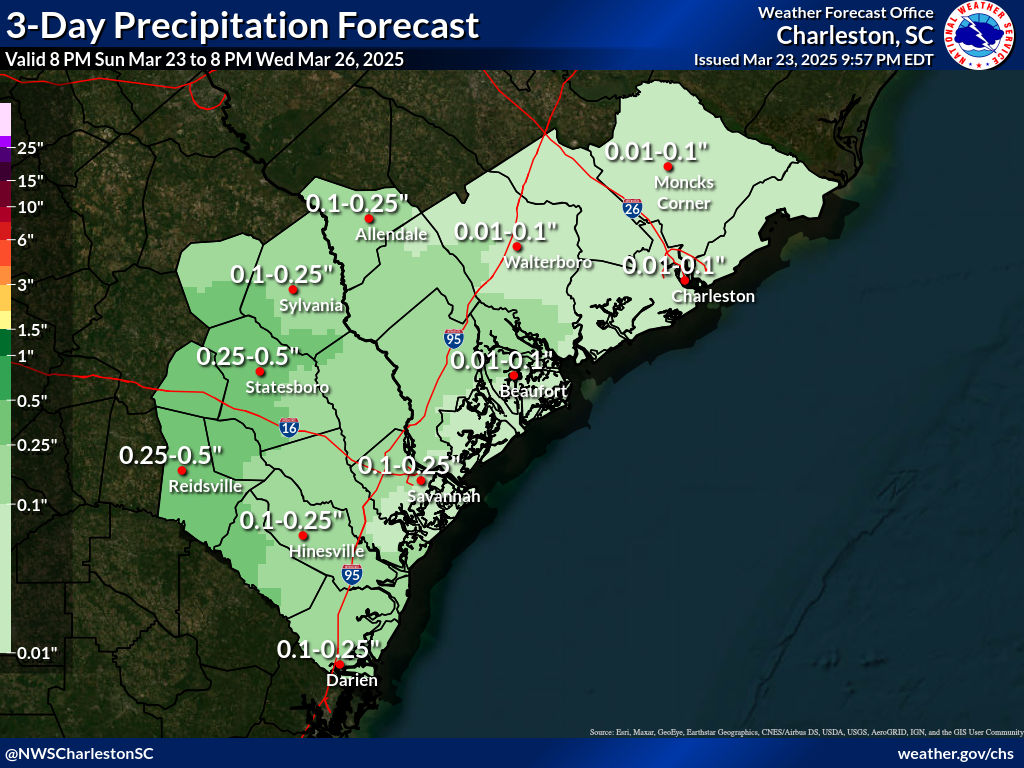
Local Precip. ForecastPrecipitation amount forecast for southeast SC/GA (issued by NWS Charleston) NOTE: Be sure to check the valid time period! |
|
Local Text ProductsHydrologic text products (issued by NWS Charleston) Flood Watch | Flash Flood Warning | Flash Flood Statement | Flood Statement/Advisory |
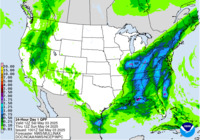 |
National Precip. ForecastsPrecipitation amount forecasts for the U.S. (issued by the NWS Weather Prediction Center) Day 1 | Day 2 | Day 3 | Days 1-2 | Days 1-3 | Days 4-7 | 7-Day Total | Probabilistic forecasts |
|
National Excessive Rainfall OutlooksExcessive rainfall outlooks for Days 1-5 for the U.S. (issued by the NWS Weather Prediction Center) |
|
|
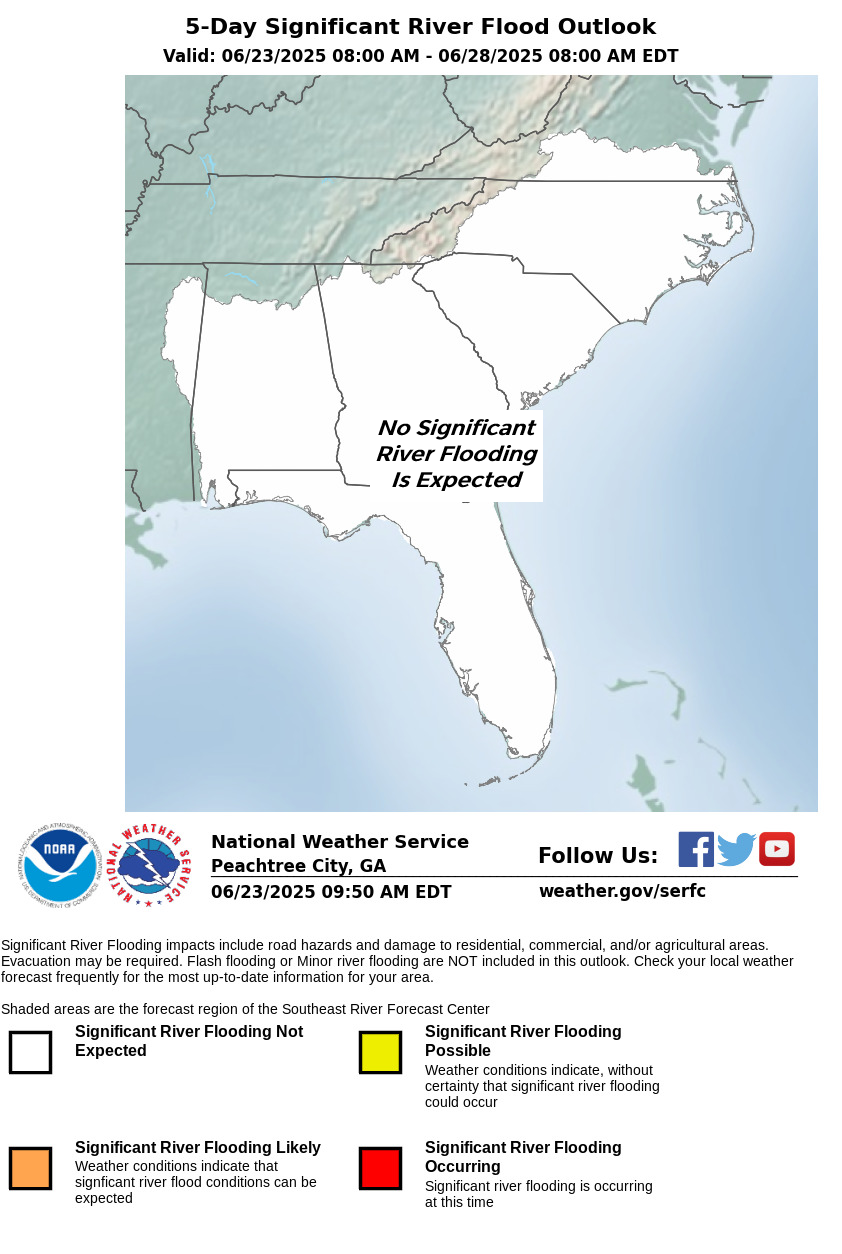
River LevelsRiver level observations/forecasts/ outlooks (from the Southeast U.S. River Forecast Center) SERFC Hydrologic Briefing | Advanced Hydrologic Prediction Service |
|
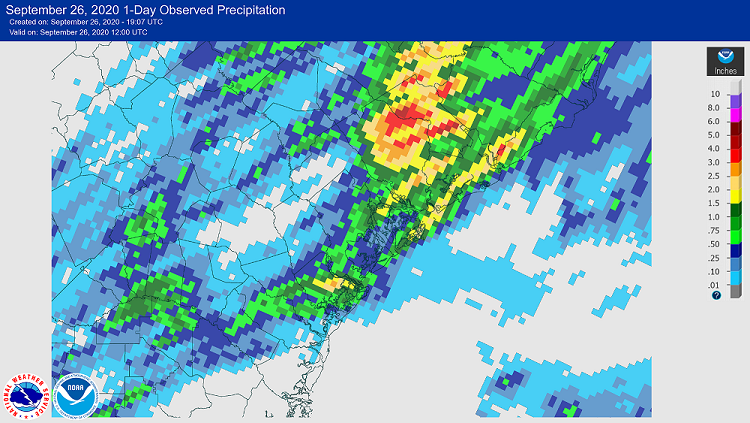
Observed PrecipitationCoCoRaHS Maps |
 |
U.S. Drought MonitorA synthesis of multiple indices and impacts that represents a consensus of federal and academic scientists regarding drought conditions |
 |
Report Flooding To Us
Phone: 888-383-2024 |
|
|
2-Day Tropical OutlookCurrent tropical cyclones across the Atlantic Basin and 2-day tropical cyclone formation chances |
 |
7-Day Tropical OutlookProbability of tropical cyclone formation across the Atlantic Basin within the next 5 days |
|
|
Satellite ImageryGOES imagery of the Atlantic, Caribbean and Gulf of Mexico tropical regions Visible | Infrared | Water Vapor
|
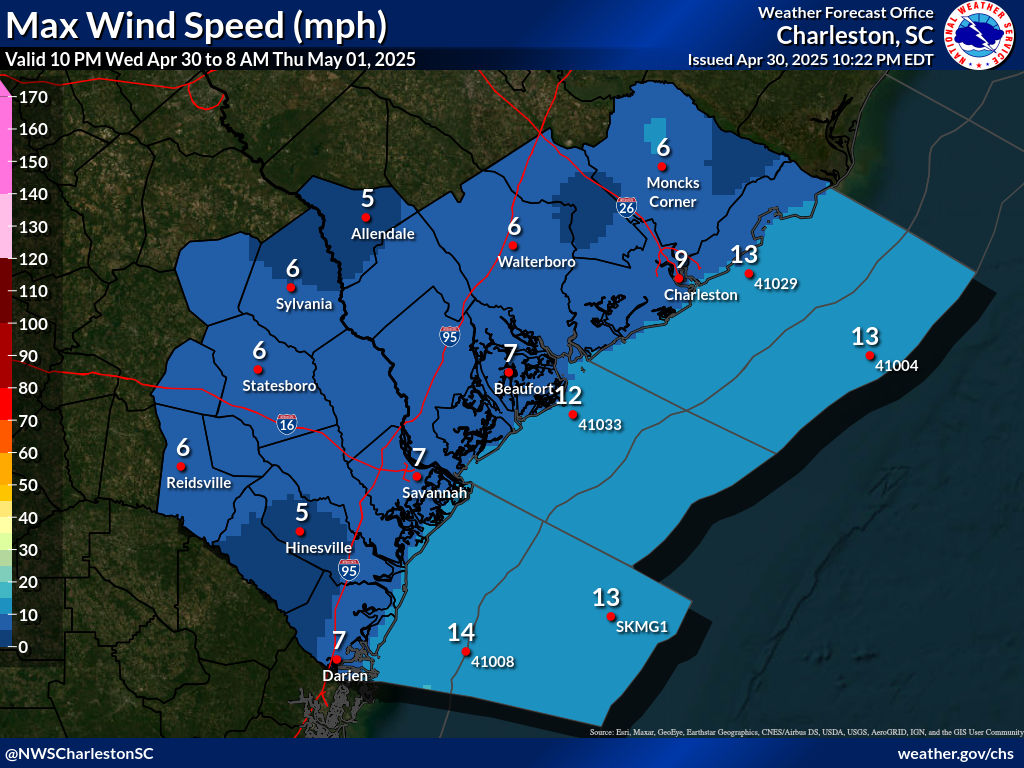 |
Wind Speed ForecastMaximum sustained wind speed forecast graphics for southeast SC/GA |
 |
Storm Surge InundationProbabilistic storm surge inundation forecasts (ocean water above ground level) (usually only available when a Hurricane Watch/Warning is in effect) NOTE: 10% exceedence depths (i.e., 1 in 10 chance of being exceeded) are suggested for planning purposes! |
|
Local Text ProductsTropical text products (issued by NWS Charleston) Hurricane Local Statement (storm overview for the SC Lowcountry/GA Coastal Empire) Local Tropical Watch/Warning Statement (county-level storm threats/impacts) |
|
|
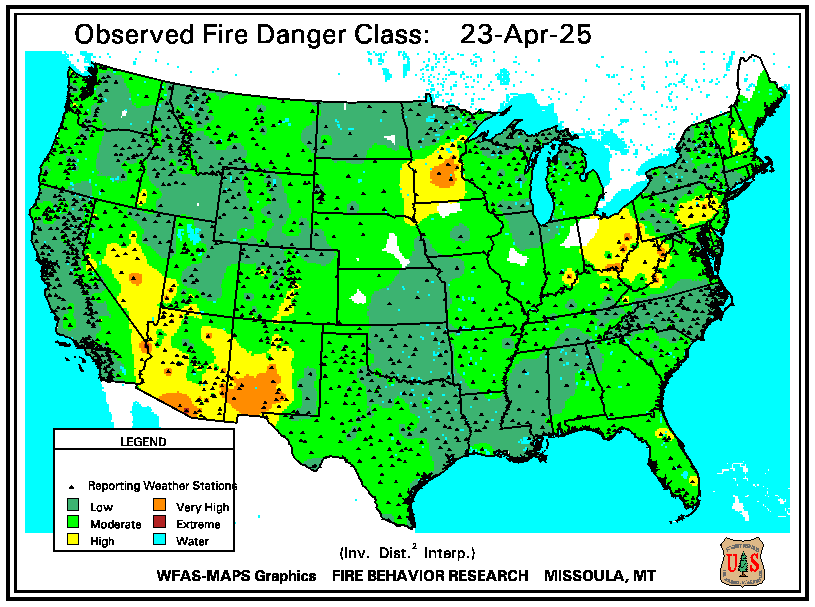
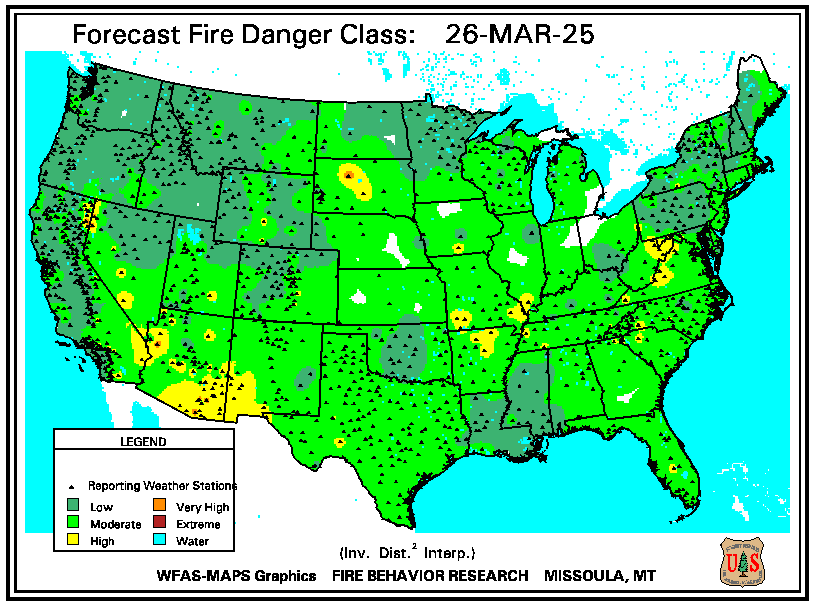
Fire Danger RatingObserved fire danger rating from the National Fire Danger Rating System (NFDRS) |
 |
Graphical Fire Weather ForecastsForecast graphics of various weather/fire weather parameters |
|
|
Local Forecast GraphicsLocal forecast graphics, including winds and relative humidity |
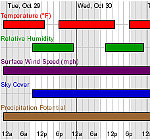 |
Weather Activity PlannerGraphical display of selected weather forecast elements for your location |
 |
National Fire Weather OutlooksFire weather outlooks for the U.S. (issued by the NWS Storm Prediction Center) |
|
|
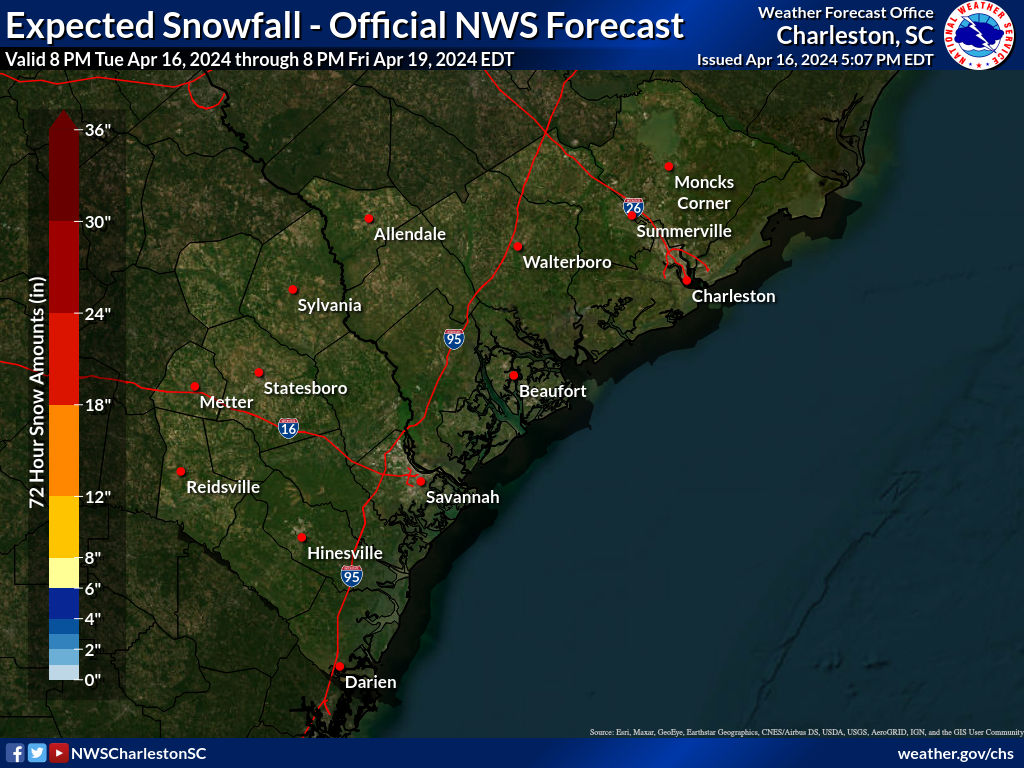
Snow Amount ForecastSnow amount forecast for southeast SC/GA (issued by NWS Charleston) |
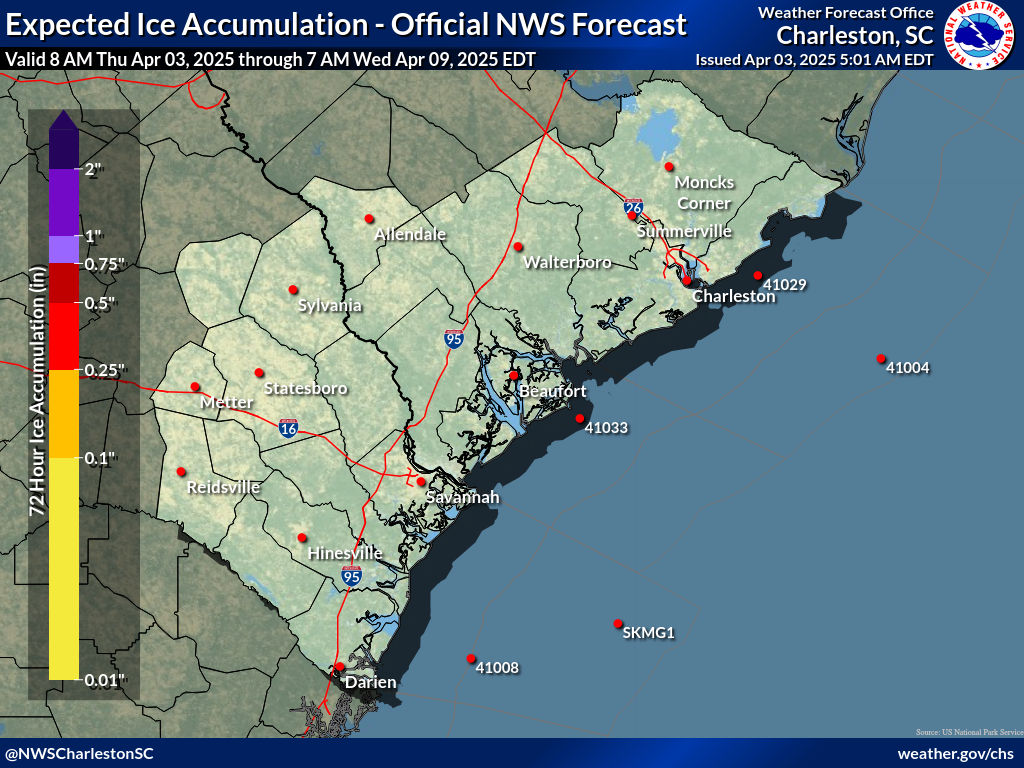 |
Ice Amount ForecastIce accumulation forecast for southeast SC/GA (issued by NWS Charleston) |
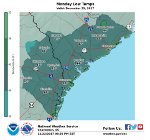 |
Minimum Temperature ForecastLow temperature forecast graphics for southeast SC/GA (issued by NWS Charleston) |
|
Minimum Wind Chill Temp ForecastMinimum wind chill temperature forecast graphics for southeast SC/GA (issued by NWS Charleston) |
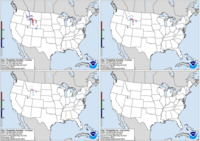 |
National Snow/Ice Probability ForecastsProbability of snow exceeding 4, 8 and 12 inches and freezing rain exceeding 0.25 inches (issued by the NWS Weather Prediction Center) |
 |
National Winter Weather Impact GraphicsExperimental products depicting model-derived winter weather impacts (issued by the NWS Weather Prediction Center)
|
|
Local Text ProductsWinter Weather Message Check date/time of products to ensure they are current! |
 |
Report Snow/Ice Amounts To Us
Phone: 888-383-2024 |
|
|
Days 3-7 Hazards OutlookWeather, water and climate hazard outlook (issued by the NWS Weather Prediction Center) |
 |
Days 8-14 Hazards OutlookWeather, water and climate hazard outlook (issued by the NWS Weather Prediction Center) |
 |
Climate OutlooksTemperature/precipitation outlooks (issued by the NWS Climate Prediction Center) |
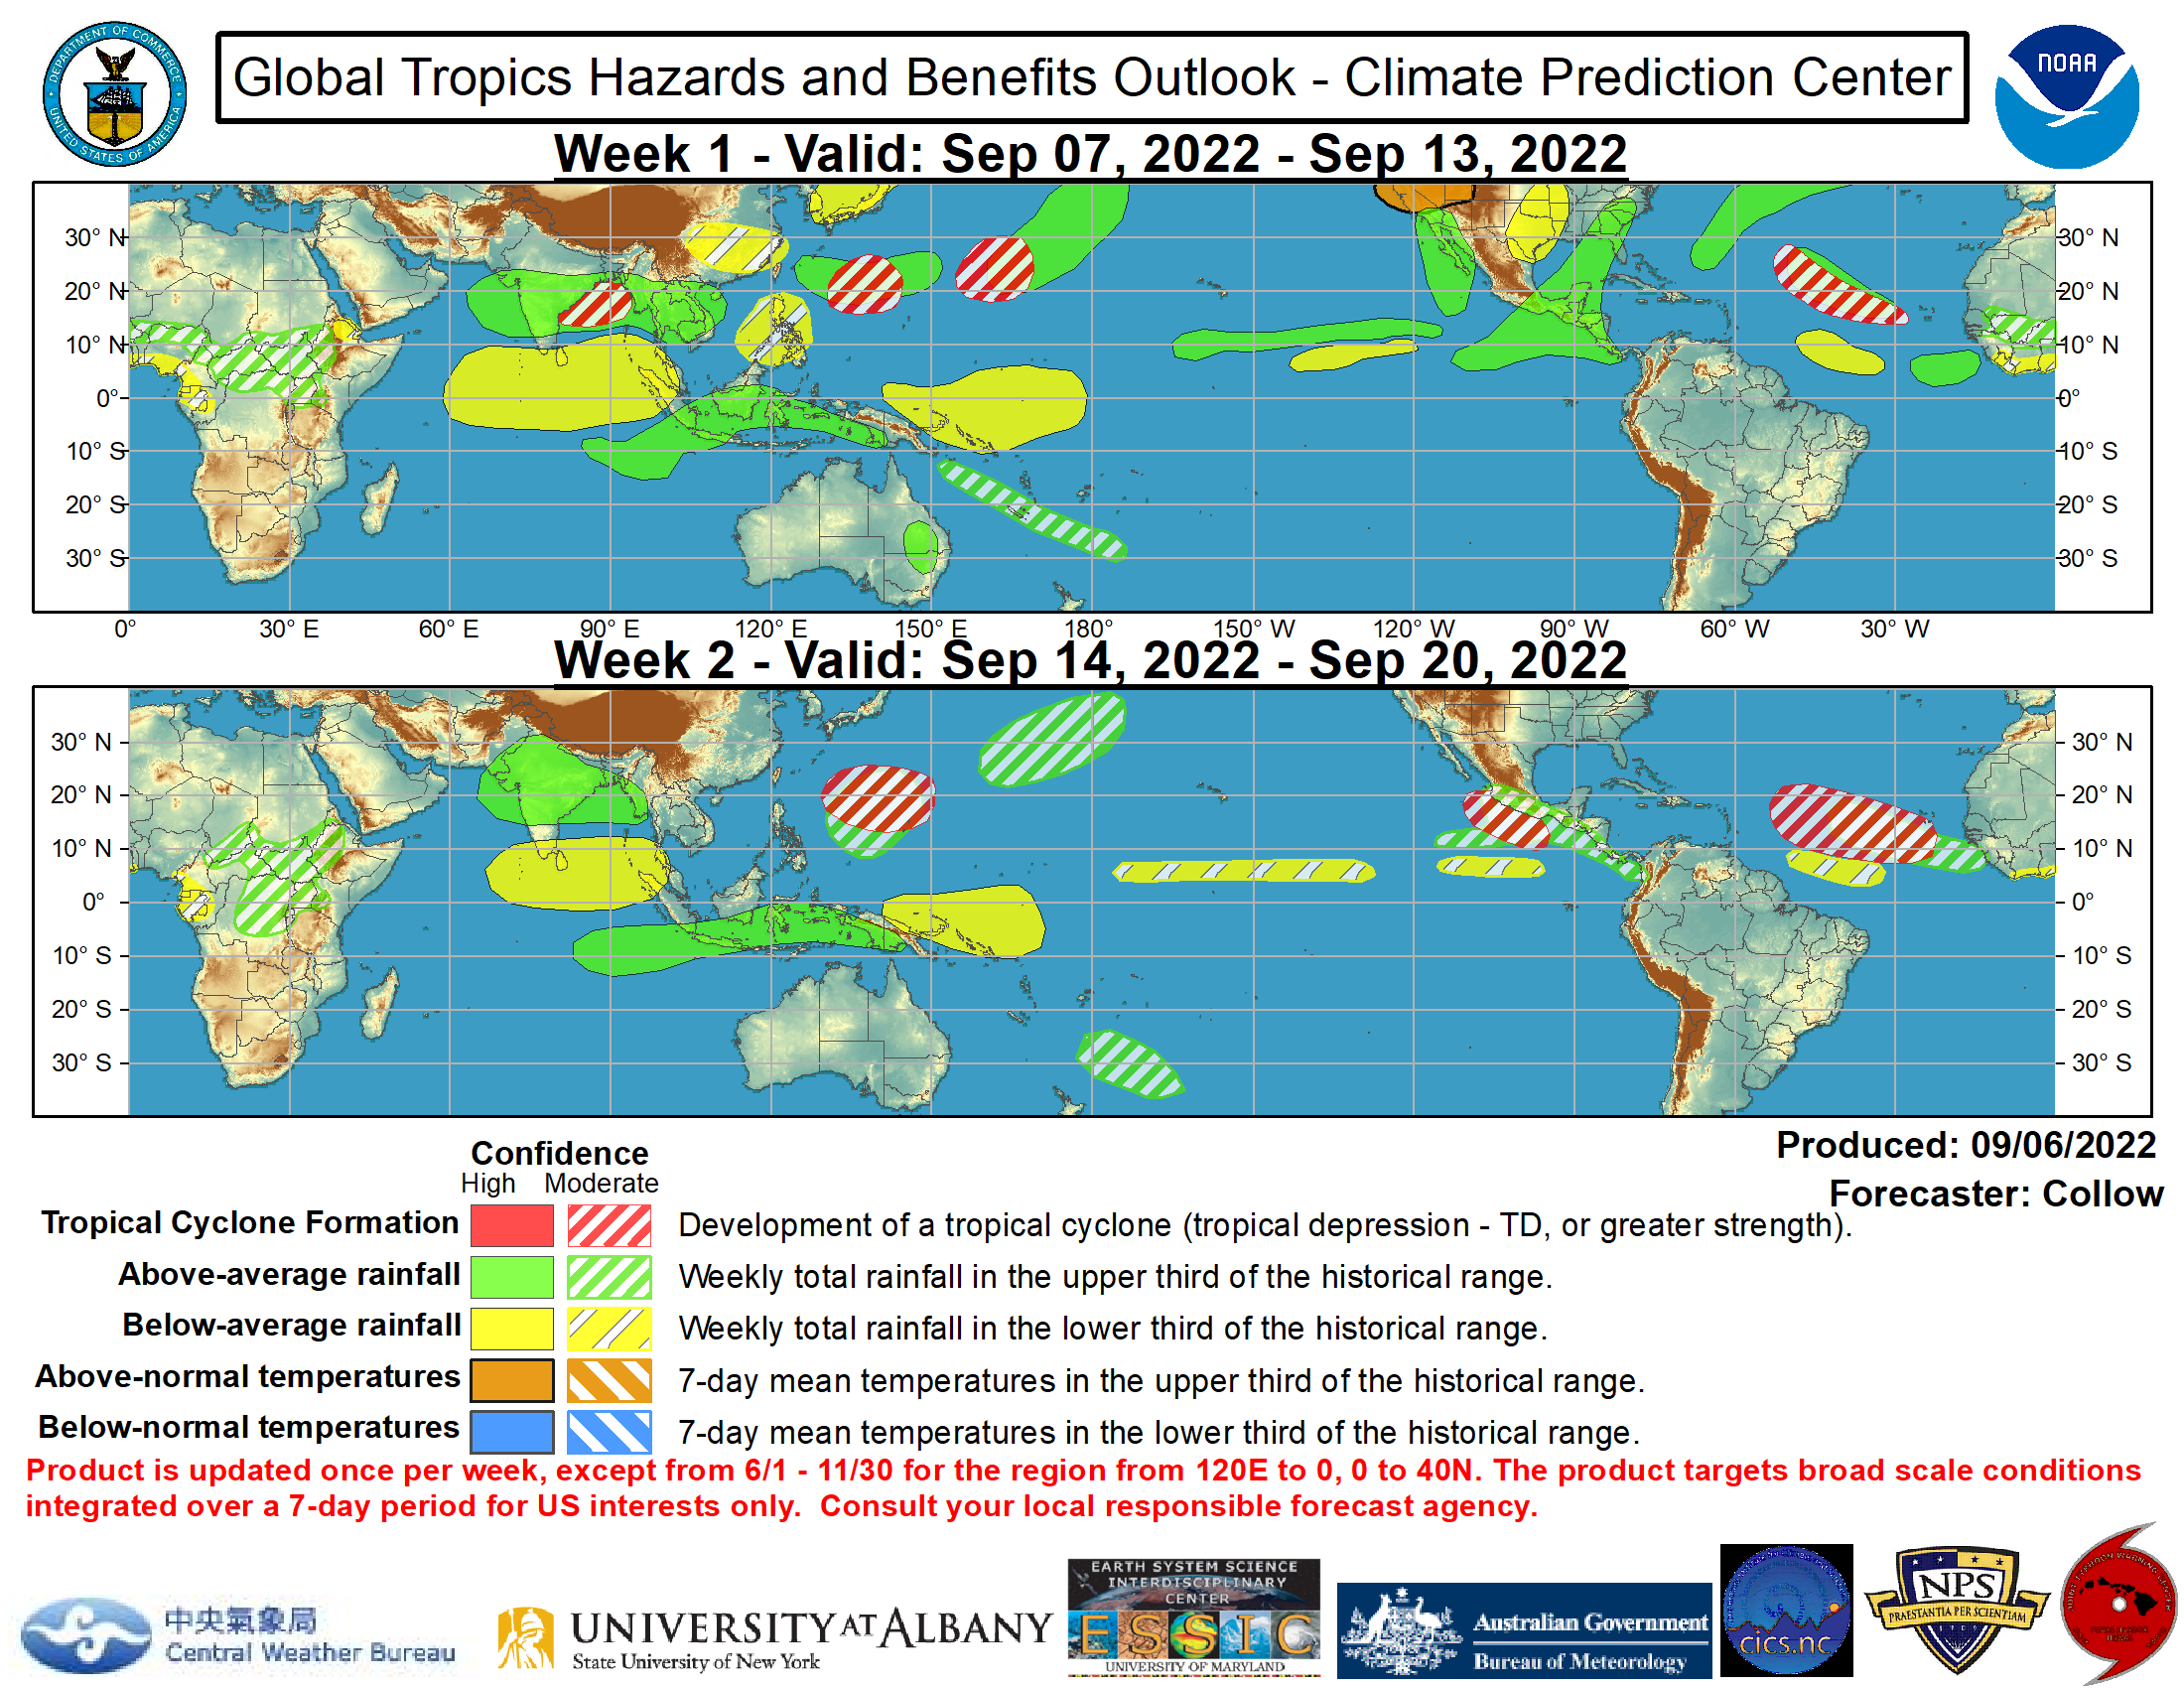 |
Tropical Hazards/Benefits OutlookTropical cyclone/rainfall/ temperature outlook (issued by the NWS Climate Prediction Center) |
|
|
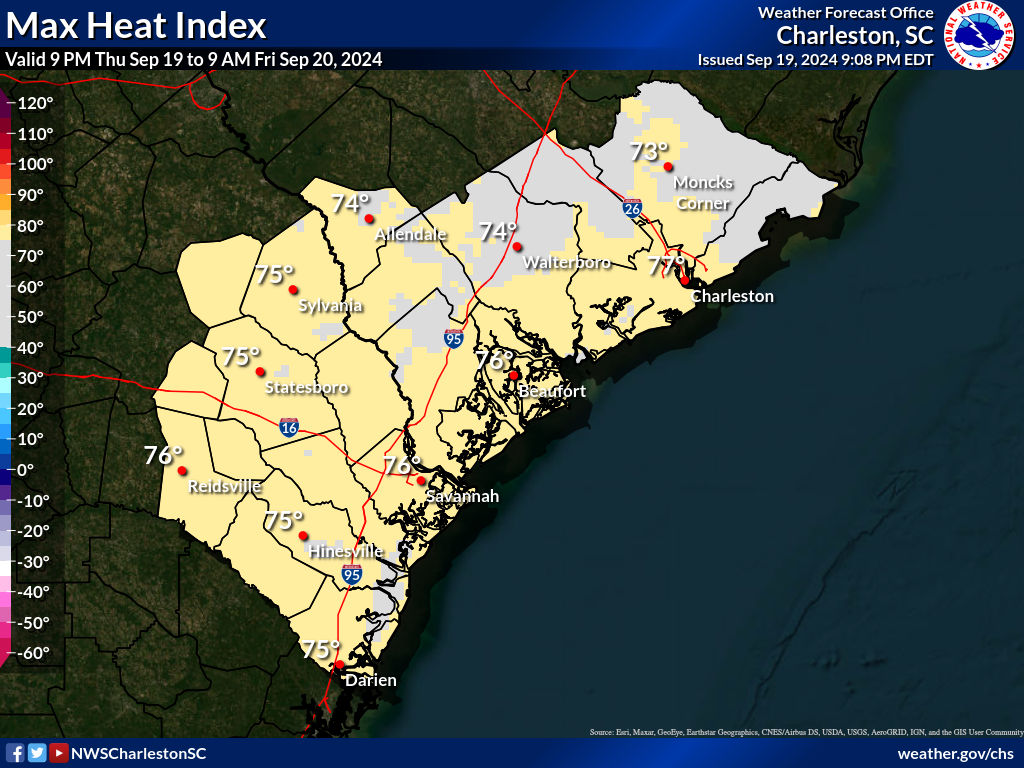
Maximum Heat IndexMaximum Heat Index forecast graphics for southeast SC/GA (issued by NWS Charleston) |
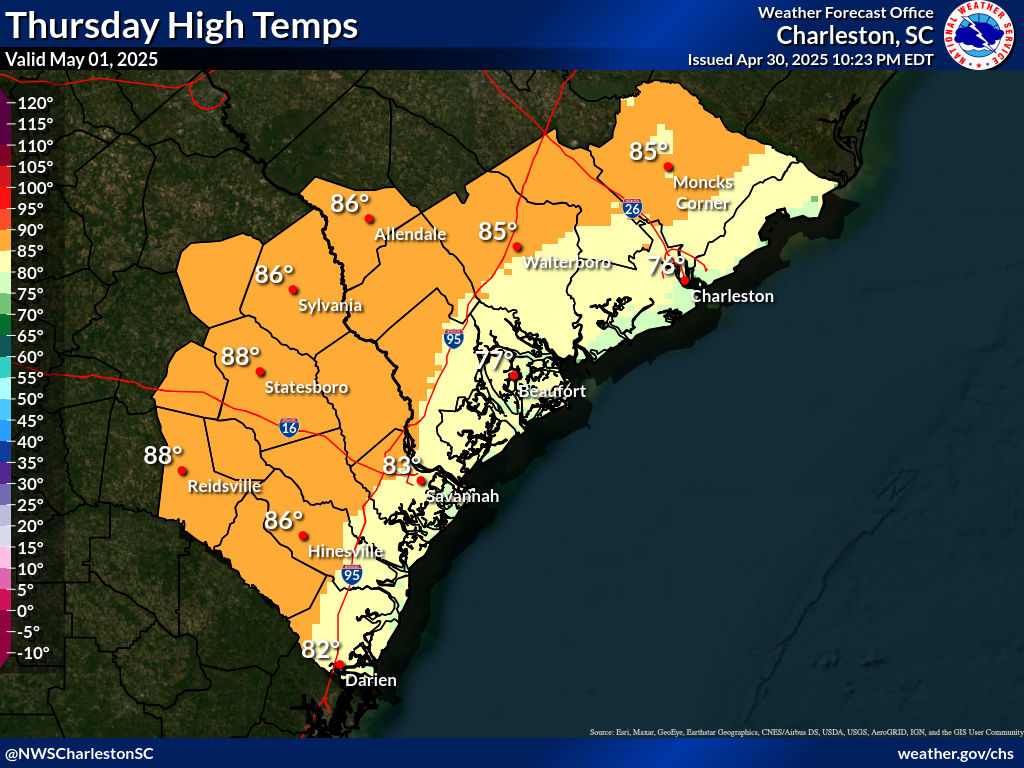 |
Maximum TemperatureMaximum Temperature forecast graphics for southeast SC/GA (issued by NWS Charleston) |
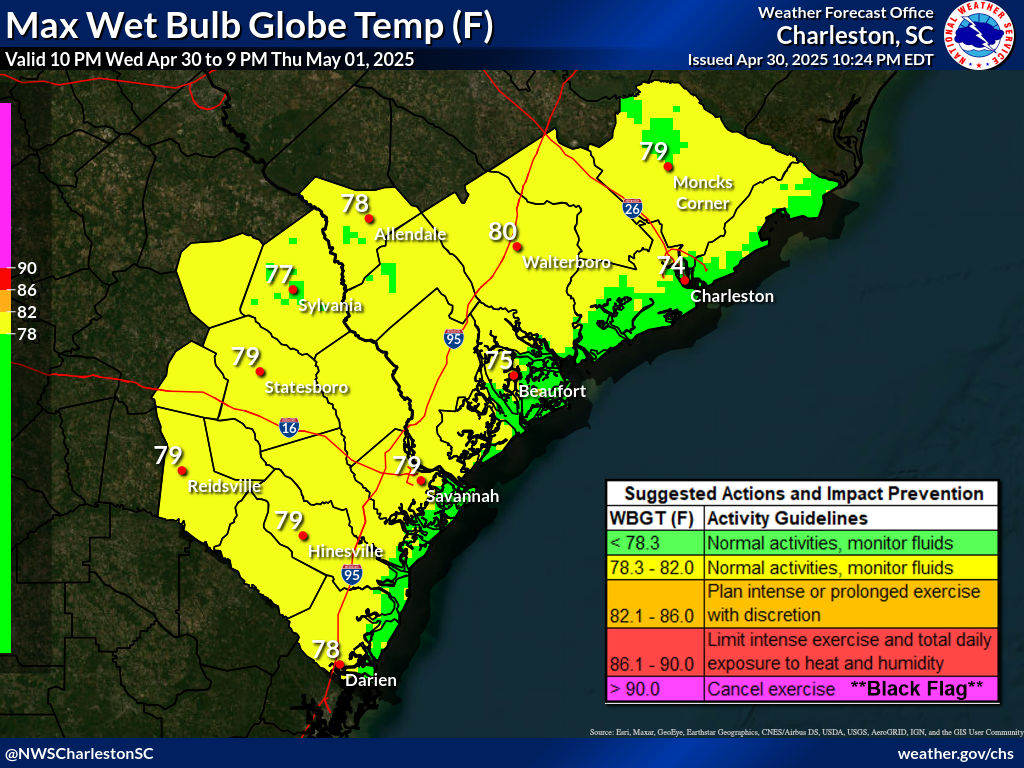 |
Maximum Wet Bulb Globe TemperatureMaximum Wet Bulb Globe Temperature (WBGT) forecast graphics for southeast SC/GA (issued by NWS Charleston)
|
 |
Maximum Heat Index and Probability ForecastMaximum Heat Index and probability forecast for 95F, 100F, 105F, 110F, and 115F (issued by the NWS Weather Prediction Center) |
 |
Tsunami Warning Center
Special Weather Statement (issued by NWS Charleston when there is a threat of a tsunami in SC and/or GA) |


 Coastal Flood
 Follow us on YouTube