
A storm system will shift from eastern Texas into the lower Mississippi Valley today with additional threats of severe thunderstorms and heavy to excessive rainfall which may bring flooding. In the northern U.S., a storm will bring heavy snow and gusty winds over parts of the northern Rockies, northern Plains, and Upper Midwest today into Wednesday. Read More >
| 2018 Annual |
2017-18 Water Year |
2017 Annual |
2016-17 Water Year |
2016 Annual |
2015-16 Water Year |
2015 Annual |
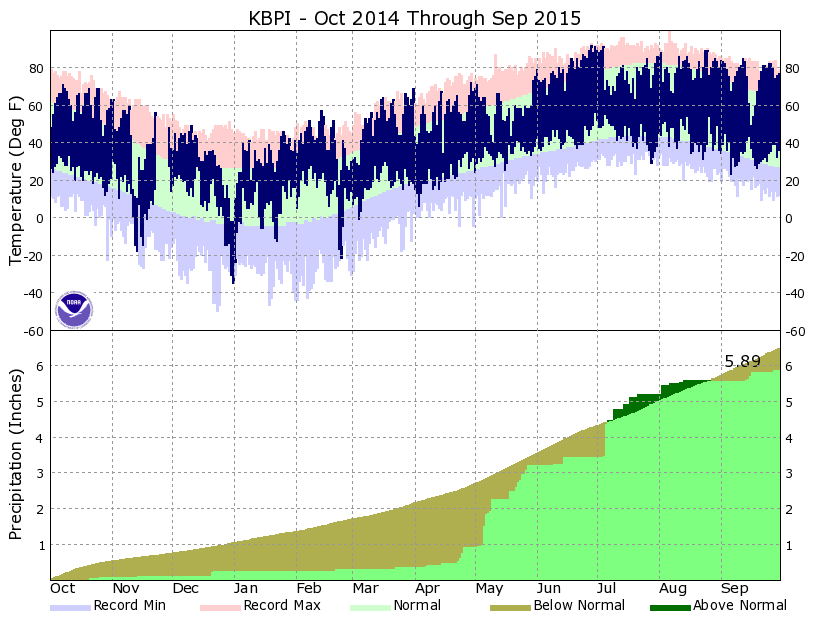
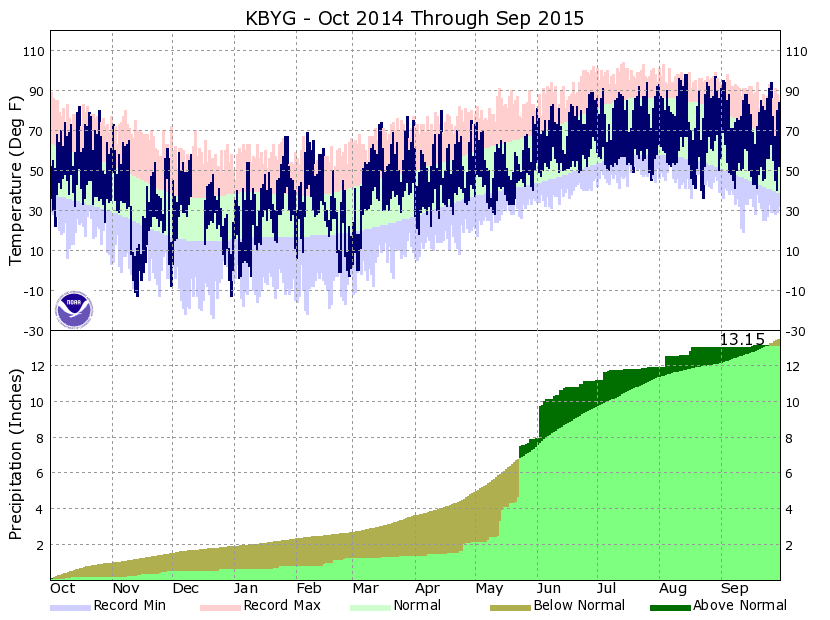
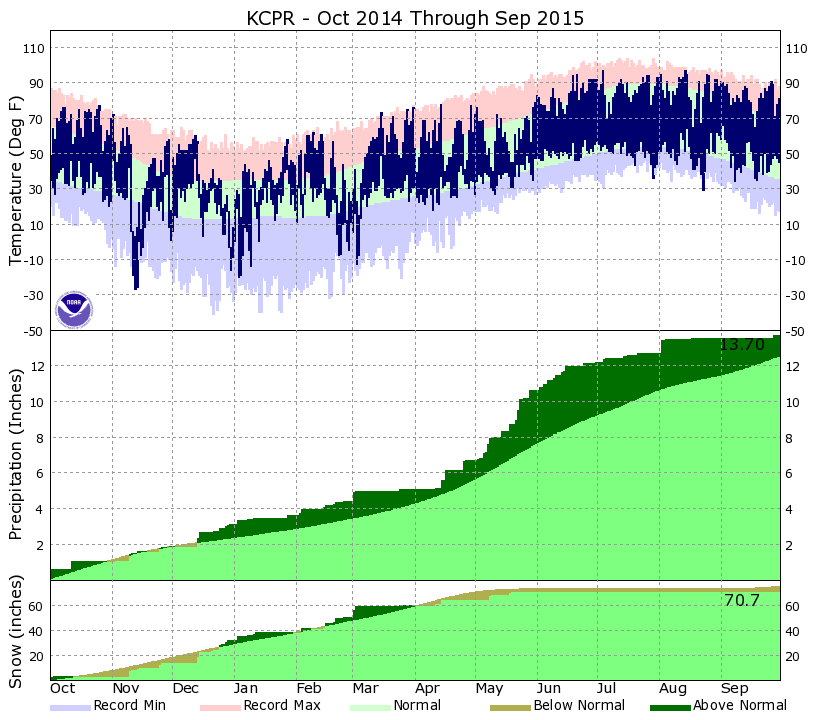
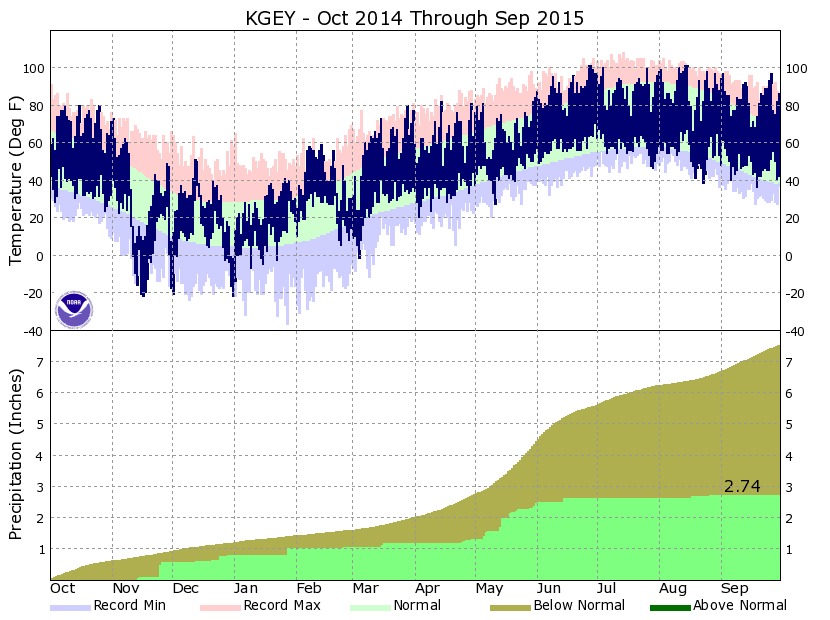
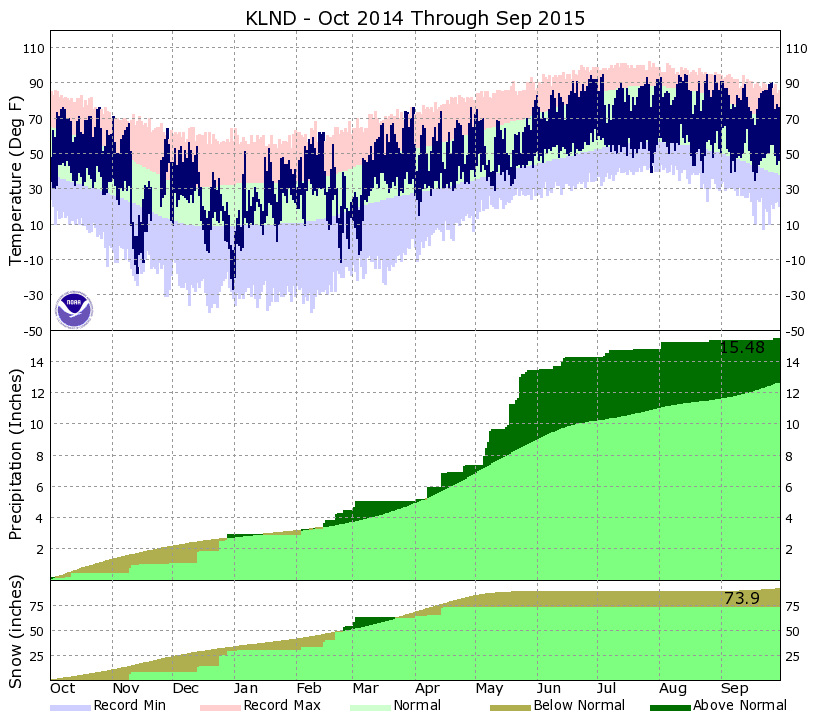
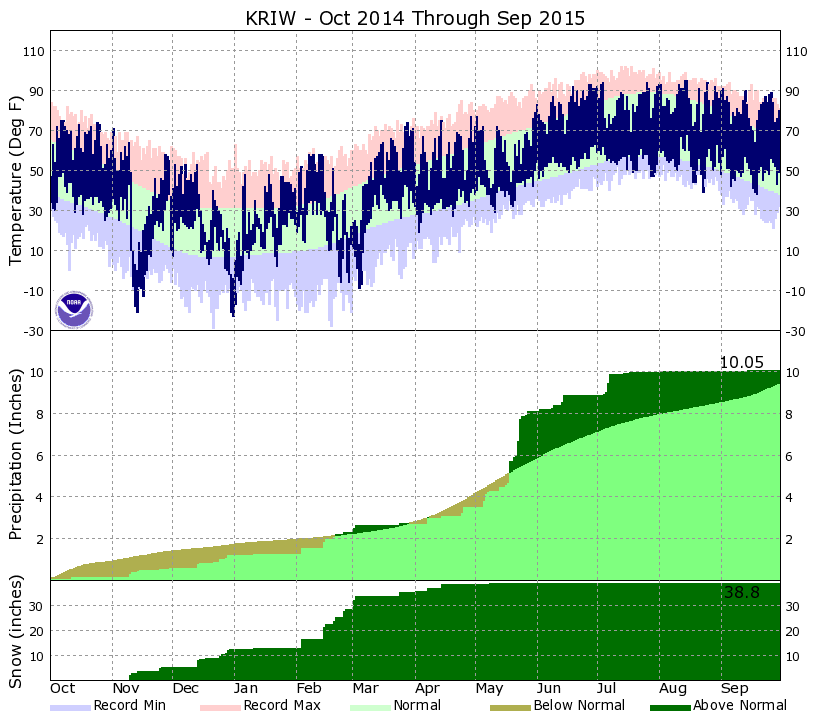
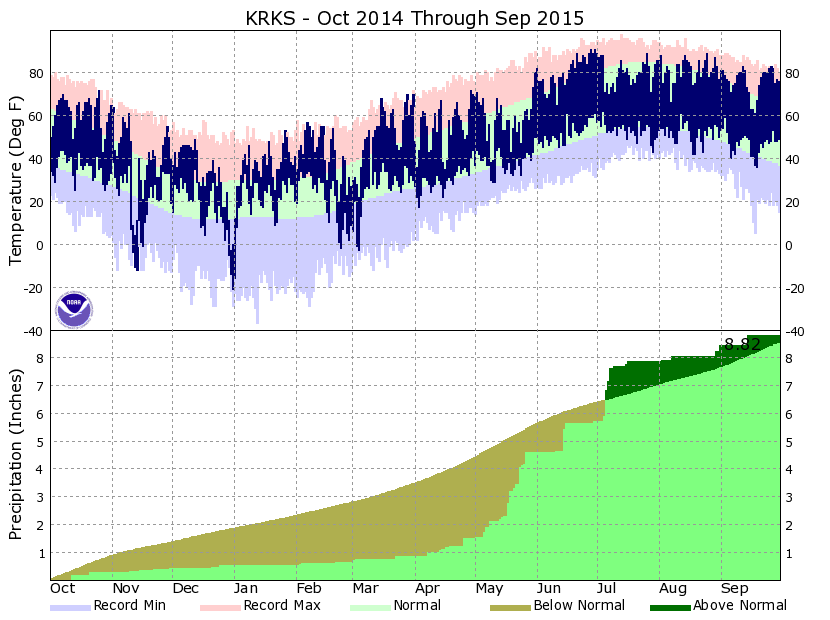
| 2014-15 Water Year |
2014 Annual | 2013-14 Water Year |
2013 Annual | 2012-13 Water Year | 2012 Annual | 2011-12 Water Year | More... |
| Previous Annual and Water Year Climate Summaries |
|
|||||||||||||||||||||||||||||||||||||||||||||||||||||||||||||||||||||||||||||||||||||||||||||||||||||||||||||||||||||||||||||||||||||||||||||||||||||||||||||||||||||||||||||||||||||||||||||||||||||||||||||||||||||||||||||||||||||||||||||||||||||||||||||||||||||||||||||||||||||||||||||||||||||||||||||||||||||||||||||||||||||||||||||||||||||||||||||||||||||||||||||||||||||||||||||||||||||||||||||||||||||||||||||||||||||||||||||||||||||||||||||||||||||||||||||||||||||||||||||||||||||||||||||||||||||||||||||||||||||||||||||||||||||||||||||||||||||||||||||||||||||||||||||||||||||||||||||||||||||||||||||||||||||||||||||||||||||||||||||||||||||||||||||||||||||||||||||||||||||||||||||||||||||||||||||||||||||||||||||||||||||||||||||||||||||||||||||||||||||||||||||||||||||||||||||||||||||||||||||||||||||||||||||||||||||||||||||||||||||||||||||||||||||||||||||||||||||||||||||||||||||||||||||||||||||||||||||||||||||||||||||||||||||||||||||||||||||||||||||||||||||||||||||||||||||||||||||||||||||||

