
Isolated severe thunderstorms and widespread showers may produce flash flooding across the Southern Plains through Thursday. Numerous instances of flash flooding are expected in south-central Texas, including portions of the Hill Country; and an additional area across eastern Oklahoma into the Ozarks on Thursday. Heavy rainfall and mountain snow will return to southern California on Thursday. Read More >

...Highlights of 2021...

| Element | Jan | Feb | Mar | Apr | May | Jun | Jul | Aug | Sep | Oct | Nov | Dec | Year |
| Average High | 34.0 | 42.7 | 48.7 | 58.5 | 64.6 | 85.4 | 90.00 | 88.4 | 82.4 | 68.2 | 45.7 | 45.3 | 62.8 |
| Mean High (1991-2020 Normals) | 35.2 | 37.8 | 48.8 | 56.3 | 66.8 | 79.6 | 89 | 86.7 | 75.6 | 59.7 | 45.9 | 34.7 | 59.7 |
| Average Low | 10.7 | 20.6 | 23.3 | 28.7 | 35.0 | 47.3 | 50.3 | 51.5 | 44.2 | 31.8 | 23.6 | 21.6 | 32.4 |
| Mean Low (1991-2020 Normals) | 15 | 15.4 | 22.7 | 28.2 | 37.1 | 45.4 | 53 | 51.4 | 42.2 | 30.9 | 22 | 14.8 | 31.5 |
| Average Temperature | 22.3 | 31.7 | 36.0 | 43.6 | 49.8 | 66.3 | 70.1 | 70.0 | 63.3 | 50.0 | 34.7 | 33.4 | 47.6 |
| Mean Average Temperature (1991-2020 Normals) | 25.1 | 26.6 | 35.8 | 42.3 | 52 | 62.5 | 71 | 69 | 58.9 | 45.3 | 34 | 24.8 | 45.6 |
| Departure from Normal | -2.8 | 5.1 | 0.2 | 1.3 | -2.2 | 3.8 | -0.9 | 1.0 | 4.4 | 4.7 | 0.7 | 8.6 | 2.0 |
|
Rank: 85 years of record (P.O.R 12/1939-2024) |
32 | 74 | 55 | 52 | 20 | 73 | 28 | 53 | 81 | 70 | 54 | 84 | 80 |
 |
|||||||||||||
| Highest Daily Maximum | 56 | 60 | 63 | 75 | 86 | 98 | 100 | 99 | 94 | 85 | 62 | 57 | 100 |
| Date of Occurrence | 31 | 6 | 18 | 12,13,14 | 29 | 23 | 11,25 | 3,6 | 2 | 2,4 | 11,12 | 21 | 6/11,25 |
| Lowest Daily Minimum | -37 | -16 | 13 | 18 | 19 | 36 | 39 | 34 | 30 | 21 | 3 | 8 | -37 |
| Date of Occurrence | 13 | 16 | 25 | 21 | 2 | 1 | 8 | 30 | 14,22 | 23 | 24 | 31 | 1/13 |
| Number of Days with: | Jan | Feb | Mar | Apr | May | Jun | Jul | Aug | Sep | Oct | Nov | Dec | |
| Maximum >= 90° | 0 | 0 | 0 | 0 | 0 | 7 | 16 | 6 | 0 | 0 | 0 | 0 | 43 |
| Maximum <= 32° | 12 | 5 | 1 | 0 | 0 | 0 | 0 | 0 | 0 | 0 | 1 | 2 | 21 |
| Minimum <= 32° | 28 | 27 | 28 | 19 | 8 | 0 | 0 | 0 | 3 | 18 | 25 | 30 | 186 |
| Minimum <= 0° | 8 | 2 | 0 | 0 | 0 | 0 | 0 | 0 | 0 | 0 | 0 | 0 | 10 |
| Record High Temperatures Set or Tied | 1 | 0 | 0 | 1 | 0 | 0 | 1 | 2 | 1 | 1 | 1 | 3 | 11 |
| Record Low Temperatures Set or Tied | 0 | 0 | 0 | 0 | 1 | 1 | 0 | 2 | 0 | 0 | 0 | 0 | 4 |
Daily Records:
Record High Temperatures:
May: 23 on the 4thJanuary: 53 on the 29th (tie)April: 75 on the 12th (tie)July: 100 on the 25thAugust: 99 on the 3rd. 96 on the 21st.September: 91 on the 29th (also the latest 90 degree day on record)October: 85 on the 4thNovember: 60 on the 23rd (tie)December: 56 on the 20th (tie). 57 on the 21st. 51 on the 29th (tie)Record Low Temperatures:
June: 37 on the 29thAugust: 36 on the 29th. 34 on the 30th (tie)
| Warmest Months of September on Record | |||||||
| Rank | Year | Average Temperature °F | |||||
| 1 | 1998 | 64.7 | |||||
| 2 | 2015 | 64.4 | |||||
| 3 | 1940 | 64.3 | |||||
| 4 | 1963 | 64.1 | |||||
| 5 | 2024 | 63.3 | |||||
| 6 | 1969,1990,1952 | 63.2 | |||||
| 9 | 1948 | 63.1 | |||||
| 10 | 1994 | 62.8 | |||||
| Warmest Months of December on Record | |||||||
| Rank | Year | Average Temperature °F | |||||
| 1 | 1980 | 34.3 | |||||
| 2 | 2024 | 33.4 | |||||
| 3 | 1946 | 33.0 | |||||
| 4 | 2023 | 32.0 | |||||
| 5 | 1957/1994 | 31.8 | |||||
| 6 | 1950 | 31.2 | |||||
| 7 | 1962 | 30.4 | |||||
| 8 | 1959 | 30.3 | |||||
| 9 | 2021 | 30.1 | |||||
| 10 | 1999 | 29.9 | |||||
| Top Ten Warmest Years on Record | |||||||
| Rank | Year | Average Temperature °F | |||||
| 1 | 1994 | 49.1 | |||||
| 2 | 2012 | 48.7 | |||||
| 3 | 1954 | 48.3 | |||||
| 4 | 1981 | 48.1 | |||||
| 5 | 1992 | 48.0 | |||||
| 6 | 2024 | 47.6 | |||||
| 7 | 1940, 1953, 1963 | 47.3 | |||||
| 10 | 2015, 2006, 1999 | 47.1 | |||||
| Top Ten Coldest Years on Record | |||||||
| Rank | Year | Average Temperature °F | |||||
| 1 | 1985 | 42.5 | |||||
| 2 | 1951 | 43.1 | |||||
| 3 | 1978 | 43.2 | |||||
| 4 | 1964 | 43.5 | |||||
| 5 | 2019, 1975 | 43.6 | |||||
| 6 | 2009, 1979, 1968, 1949 | 43.8 | |||||
| 11 | 1971 | 43.9 | |||||
| 80 | 2024 | 47.6 | |||||
 |
 |
| Average Annual Temperature for Period of Record - Click on Graph to Enlarge | |
 |
Learn more about the National Weather Service's efforts to build a Weather-Ready Nation! |

| Element | Jan | Feb | Mar | Apr | May | Jun | Jul | Aug | Sep | Oct | Nov | Dec | Year |
| Total (inches) | 0.36 | 0.67 | 0.57 | 1.22 | 2.44 | 0.80 | 0.53 | 0.39 | 0.24 | 1.51 | 0.39 | 0.16 | 9.28 |
| Mean Precipitation (1991-2020 Normals) |
0.49 | 0.56 | 0.84 | 1.41 | 2.21 | 1.34 | 1.19 | 0.79 | 0.95 | 1.19 | 0.64 | 0.61 | 12.22 |
| Departure from Normal | -0.13 | 0.11 | -0.27 | -0.19 | 0.23 | -0.54 | -0.66 | -0.4 | -0.71 | 0.32 | -0.25 | -0.45 | -2.94 |
| Percent of Normal | 73 | 120 | 68 | 87 | 110 | 60 | 45 | 49 | 25 | 127 | 61 | 26 | 76 |
|
Rank - |
27 | 58 | 29 | 38 | 54 | 32 | 18 | 32 | 14 | 70 | 24 | 8 | 15 |
 |
|||||||||||||
| Greatest 24-HR Total | 0.15 | 0.20 | 0.25 | 0.83 | 0.54 | 0.48 | 0.15 | 0.2 | 0.14 | 0.94 | 0.27 | 0.12 | 0.94 |
| Dates of Occurrence | 11 | 15-16 | 13 | 6 | 15 | 7-8 | 19 | 25-26 | 3-4 | 29-30 | 24 | 29-30 |
10/29-30 |
| Number of Days with: | |||||||||||||
| Precipitation >= 0.01 | 7 | 8 | 7 | 9 | 8 | 7 | 11 | 4 | 4 | 6 | 3 | 4 | 78 |
| Precipitation >= 0.10 | 1 | 3 | 3 | 2 | 7 | 2 | 1 | 2 | 0 | 4 | 2 | 1 | 28 |
| Precipitation >= 1.00 | 0 | 0 | 0 | 0 | 0 | 0 | 0 | 0 | 0 | 1 | 0 | 0 | 0 |
| Days with Thunderstorms | 0 | 0 | 0 | 2 | 2 | 5 | 9 | 7 | 3 | 1 | 1 | 0 | 30 |
| Daily Precipitation Records Set or Tied | 0 | 0 | 0 | 0 | 0 | 0 | 0 | 0 | 0 | 1 | 0 | 0 | 1 |
One Day Precipitation Records:
October: 0.85" on the 29th.
|
Top Ten Driest December's on Record |
|||||||
| Rank | Year | Precipitation (inches) | |||||
| 1 | 1952 | 0.03 | |||||
| 2 | 2023 | 0.06 | |||||
| 3 | 2004 | 0.07 | |||||
| 4 | 1998/1999 | 0.10 | |||||
| 6 | 2001 | 0.13 | |||||
| 7 | 1969/2024 | 0.16 | |||||
| 8 | 2002 | 0.19 | |||||
| 9 | 1974 | 0.22 | |||||
| 10 | 1958/1962 | 0.23 | |||||
| Top Ten Driest Years on Record | |||||||
| Rank | Year | Precipitation (inches) | |||||
| 1 | 2020 | 5.79 | |||||
| 2 | 1988 | 6.56 | |||||
| 3 | 2001 | 6.76 | |||||
| 4 | 2002 | 7.05 | |||||
| 5 | 1960 | 7.34 | |||||
| 6 | 1954 | 7.70 | |||||
| 7 | 2012 | 7.88 | |||||
| 8 | 1963 | 7.90 | |||||
| 9 | 1966 | 8.14 | |||||
| 10 | 1943 | 8.91 | |||||
| 15 | 2024 | 9.28 | |||||
| Top Ten Wettest Years on Record | |||||||
| Rank | Year | Precipitation (inches) | |||||
| 1 | 1982 | 20.48 | |||||
| 2 | 1995 | 18.94 | |||||
| 3 | 1983 | 18.41 | |||||
| 4 | 1978 | 17.64 | |||||
| 5 | 1941 | 16.24 | |||||
| 6 | 1957 | 16.12 | |||||
| 7 | 1986 | 15.92 | |||||
| 8 | 1993 | 15.91 | |||||
| 9 | 2009 | 15.77 | |||||
| 10 | 2016 | 15.57 | |||||
| 71 | 2024 | 9.28 | |||||
 |
 |
| Annual Precipitation for Period of Record - Click on Graph to Enlarge | |
|
Learn more about the National Weather Service's efforts to build a Weather-Ready Nation! |

| Element | Jan | Feb | Mar | Apr | May | Jun | Jul | Aug | Sep | Oct | Nov | Dec | Year |
| Total (inches) | 6.5 | 8.8 | 2.7 | 6.6 | 3.9 | 0 | 0 | 0 | 0 | *11 | *4.9 | 1.5 | 45.9 |
| Mean Snowfall (1991-2020 Normals) | 9 | 10.9 | 10.3 | 10.5 | 2.6 | 0.1 | 0 | 0 | 1.5 | 7 | 8.9 | 11 | 71.8 |
| Departure from Normal | -2.5 | -2.1 | -7.6 | -3.9 | 1.3 | -0.1 | 0.0 | 0.0 | -1.5 | 4 | -4 | -9.5 | -25.9 |
| Percent of Normal | 72 | 81 | 26 | 63 | 150 | 0 | 0 | 0 | 0 | 157 | 55 | 14 | 64 |
| Rank - Least to Most 85 years (P.O.R 12/1939-2024) |
27 | 39 | 4 | 31 | 62 | NA | NA | NA | NA | 68 | 25 | 3 | 6 |
|
|||||||||||||
| Greatest 24-HR Total | 2.1 | 2.9 | 1.2 | 4.8 | 3.9 | 0 | 0 | 0 | 0 | 11 | 3 | 1.5 | 11 |
| Dates of Occurrence | 11 | 16 | 25 | 6 | 3 | NA | NA | NA | NA | 30 | 25 | 30 | 10/30 |
| Number of Days with: | |||||||||||||
| Snowfall >= 1.0 inch | 2 | 4 | 1 | 1 | 1 | 0 | 0 | 0 | 0 | 1 | 2 | 1 | 13 |
| Daily Snowfall Records Set or Tied | 0 | 0 | 0 | 0 | 0 | 0 | 0 | 0 | 0 | 0 | 0 | 0 | 0 |
|
* October and November snowfall estimated due to no official observer. Note: 50 months of September on record with no snowfall. |
|||||||||||||
Snowfall Ranks and Records:
March had 4th least snowfall on record
December had 3rd least snowfall on record
One Day Snowfall Records (inches):
There were no daily snowfall records set in 2024.
| Top Ten Snowiest Years on Record | |||||||
| Rank | Year | Snowfall (inches) | |||||
| 1 | 1982 | 137.6 | |||||
| 2 | 1975 | 124.0 | |||||
| 3 | 1984 | 121.2 | |||||
| 4 | 1973 | 118.3 | |||||
| 5 | 2023 | 116.1 | |||||
| 6 | 1983 | 114.2 | |||||
| 7 | 1978 | 112.7 | |||||
| 8 | 2021 | 108.1 | |||||
| 9 | 2013 | 107.5 | |||||
| 10 | 1955 | 103.3 | |||||
| 80 | 2024 | 45.9 | |||||
  |
  |
|
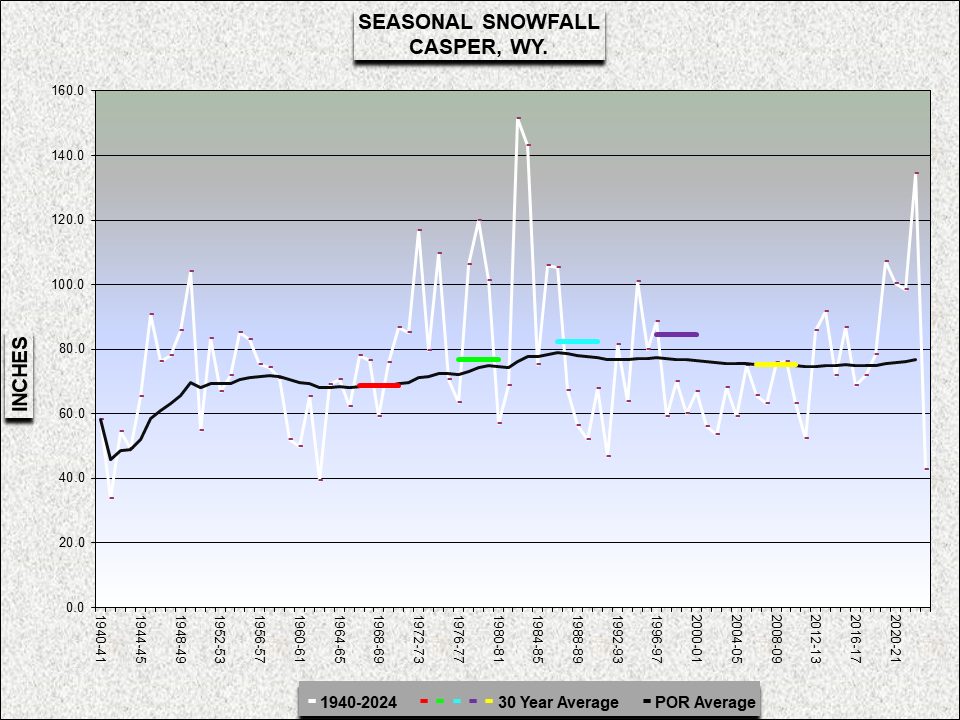
| Annual and Seasonal Snowfall for Period of Record - Click on Graph to Enlarge | ||
|
Learn more about the National Weather Service's efforts to build a Weather-Ready Nation! |

| Element | Jan | Feb | Mar | Apr | May | Jun | Jul | Aug | Sep | Oct | Nov | Dec | Year |
| Average Speed (MPH) | 12.8 | 14.9 | 13.1 | 10.7 | 10.9 | 11.5 | 8.7 | 9.9 | 10.1 | 9.8 |
13
|
14.8
|
11.7 |
| Maximum 3-sec Gust | 53 | 62 | 59 | 47 | 53 | 59 | 57 | 58 | 60 | 46 | 60 |
61
|
62 |
| Direction | 210 | 240 | 210 | 220 | 260/280 | 240 | 20 | 240 | 210 | 210 | 220 |
210
|
240 |
| Date of Occurrence | 9 | 26 | 2 | 5 | 17/29 | 24 | 6 | 25 | 18 | 27 | 13 | 8 | 2/26 |
| Number of Days with: | |||||||||||||
| 2-Min Wind >50 mph | 0 | 0 | 0 | 0 | 0 | 0 | 0 | 0 | 0 | 0 | 0 | 0 | 0 |
| Peak Wind >50 mph | 1 | 4 | 2 | 0 | 4 | 6 | 4 | 3 | 3 | 0 | 3 | 6 | 36 |
| Peak Wind >70 mph | 0 | 0 | 0 | 0 | 0 | 0 | 0 | 0 | 0 | 0 | 0 | 0 | 0 |
|
Learn more about the National Weather Service's efforts to build a Weather-Ready Nation! |

