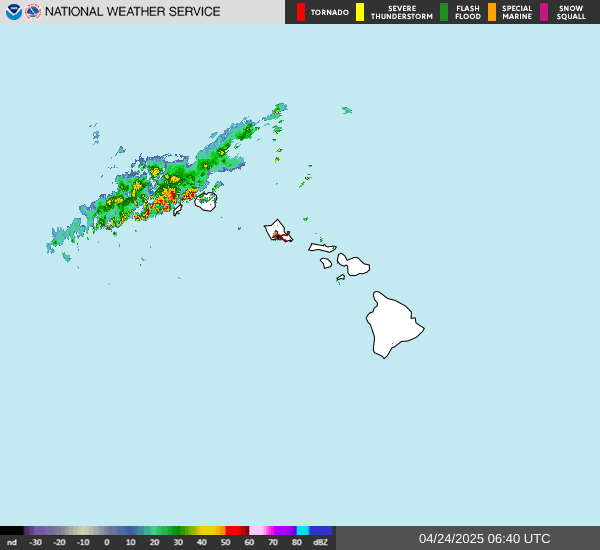
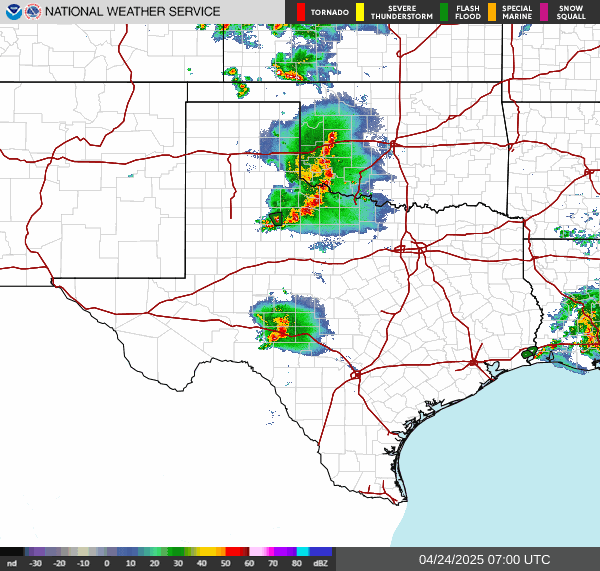
Heat expands across the Desert Southwest, Plains, Mississippi Valley and Midwest into Monday. Fire weather concerns continue for portions of the Intermountain West. Active monsoonal moisture fuels thunderstorms over the Southwest with possible flash flooding. Tropical cyclone Fausto in the Pacific, should weaken as it approaches Hawaii; Dangerous surf, swells and rip currents are expected. Read More >
Click on an element below to expand that portion of the web page
Currently there is no Airport Weather Warning in effect for the Albuquerque International Sunport
| Infrared | Visible | GeoColor |
|---|---|---|
 |
 |
 |
|
Infrared - This image is taken in the infrared band of light and show relative warmth of objects. Colder objects are brighter and warmer objects are darker. Lower layers of clouds, generally warmer and lower in altitude, are colored gray. Colder and generally higher clouds tops are highlighted in colors. Infrared imagery is useful for determining cloud features both at day and night. |
Visible - This image is taken in visible light, or how the human eye would see from the satellite. Sunrise and sunset can be tracked in this image. However, once the sun sets, visible imagery is no longer useful. |
GeoColor - is a multispectral product composed of True Color (using a simulated green component) during daytime, and an Infrared product that uses bands 7 and 13 at night. During the day, the imagery looks approximately as it would when viewed with human eyes from space. At night, the blue colors represent liquid water clouds such as fog and low stratus, while gray to white indicate higher ice clouds, and the city lights can also be seen. |
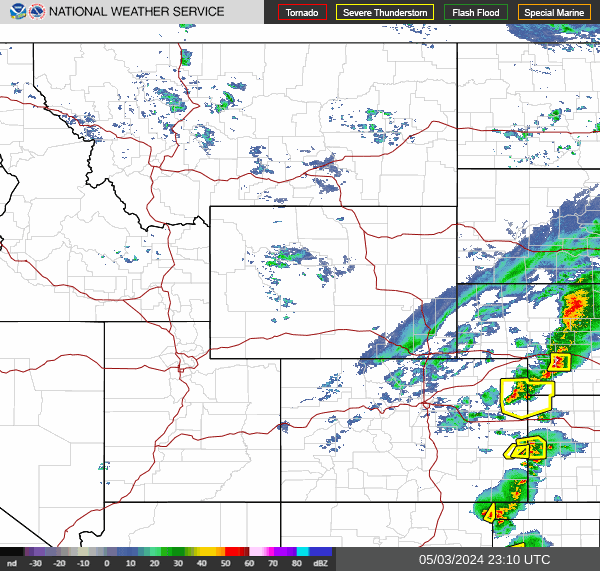
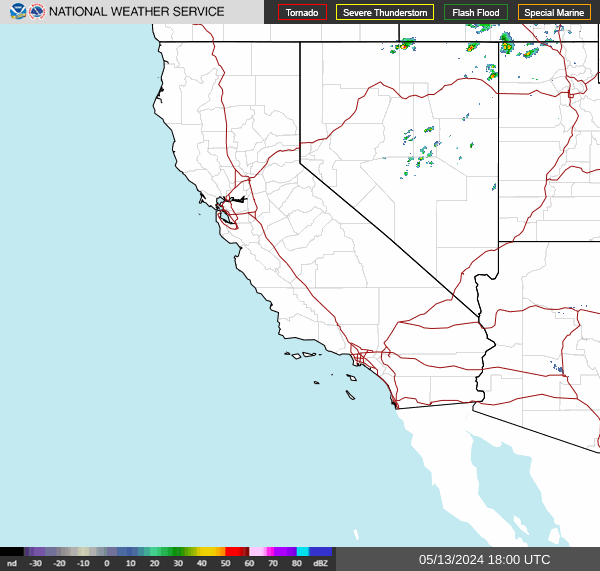
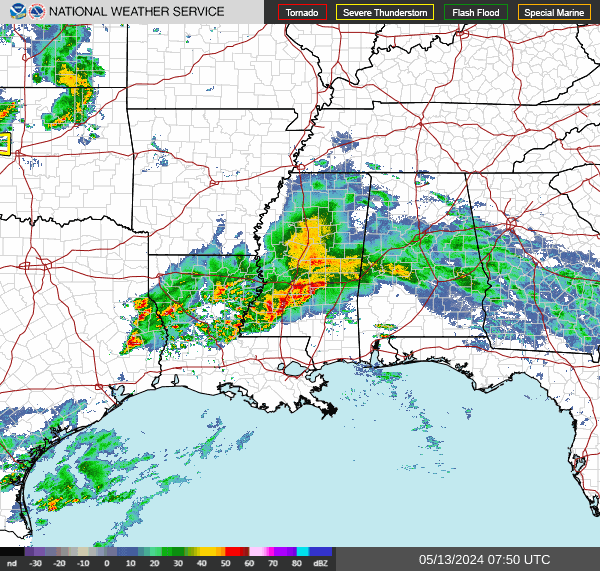
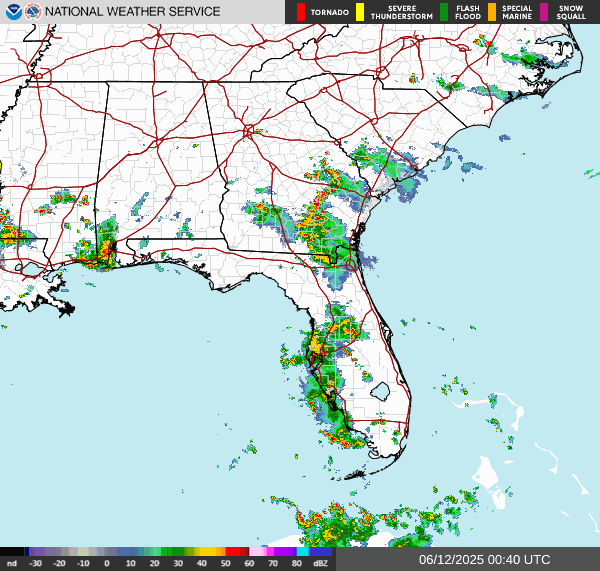
| Regional Radar Mosaic Sectors Loops (click image) |
 |
 |
 |
 |
 |
 |
 |
 |
 |
 |
 |
 |
| Farmington (KFMN) | Gallup (KGUP) | Santa Fe (KSAF) | Las Vegas (KLVS) | Tucumcari (KTCC) | Cannon AFB (KCVS) | Roswell (KROW) |
Latest Upper Air Sounding from Albuquerque (Weather Balloon Data issued twice daily) |
Forecast Soundings for Albuquerque (Model Projections) |
Albuquerque (KABX) Radar Velocity Azimuth Display Wind Profile (Observed) |
Albuquerque Vertical Wind Profile (Forecast from Rapid Refresh Model)Lowest 2000 ft Above Ground Level Vertical Wind Profile (for lowest 2000 ft) |
Albuquerque Vertical Wind Profiler at Double Eagle Airport (Real-time observations)Note: The Wind Profiler is moved to Balloon Fiesta Park during Balloon Fiesta Double Eagle (Albuquerque) Vertical Wind Profiler |
|
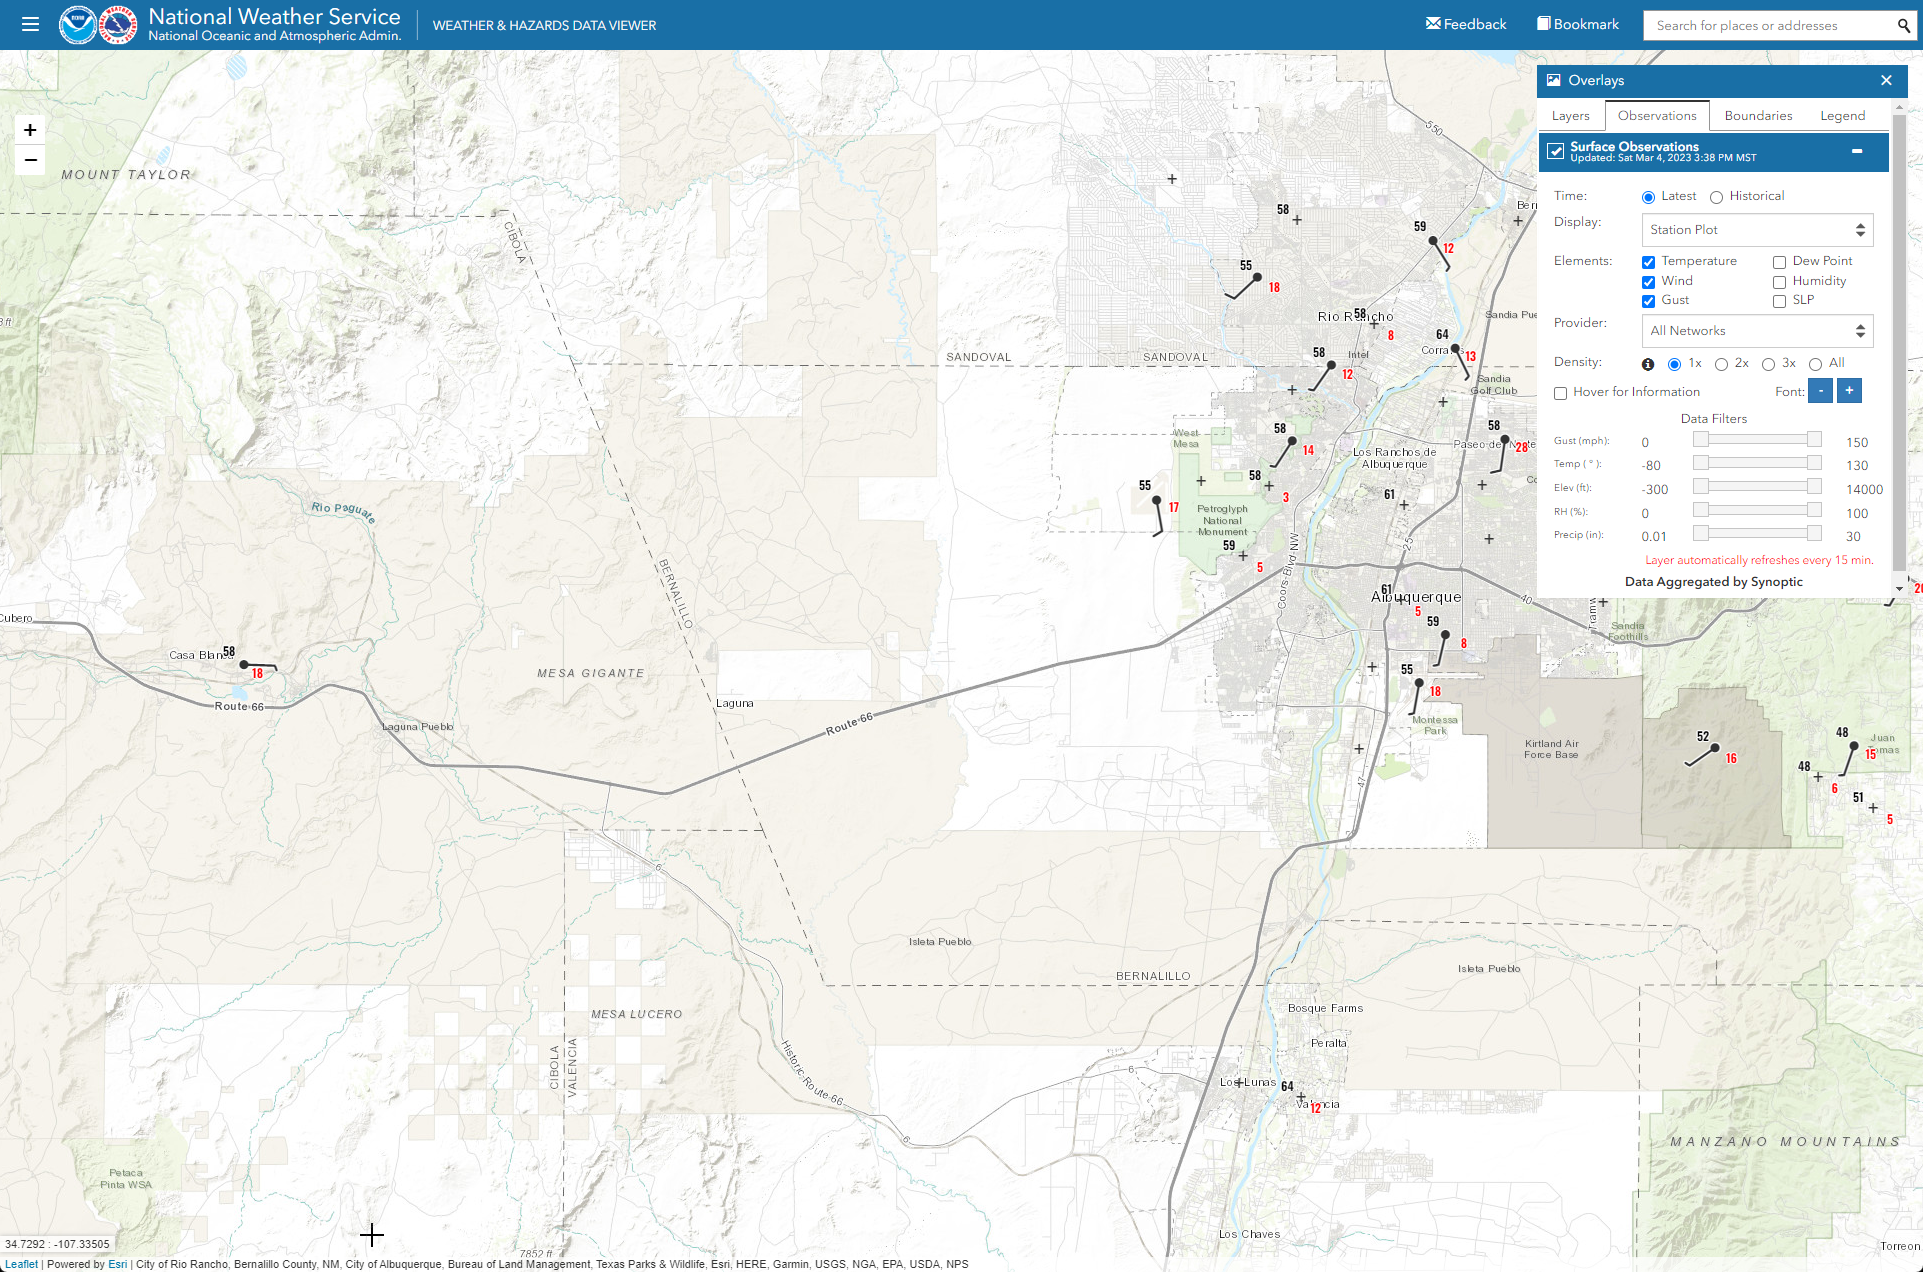 Map of Surface Observations (Including Winds) Once the map is loaded, click on an observation site for more details. |
|
Soaring Forecast for Moriarty NM
National Weather Service Albuquerque NM
0723 MDT Sunday July 26 2026

This forecast is for Sunday, July 26, 2026:

If the trigger temperature of 82.8 F/28.2 C is reached...then
   Thermal Soaring Index....................... Excellent
   Maximum rate of lift........................ 1274 ft/min (6.5 m/s)
   Maximum height of thermals.................. 18328 ft MSL (12005 ft AGL)

Forecast maximum temperature................... 95.0 F/35.5 C
Time of trigger temperature.................... 1000 MDT
Time of overdevelopment........................ None
Middle/high clouds during soaring window....... None
Surface winds during soaring window............ 20 mph or less
Height of the -3 thermal index................. 15905 ft MSL (9582 ft AGL)
Thermal soaring outlook for Monday 07/27....... Excellent


Remarks...

Sunrise/Sunset.................... 06:09:23 / 20:11:44 MDT
Total possible sunshine........... 14 hr 2 min 22 sec (842 min 22 sec)
Altitude of sun at 13:10:34 MDT... 74.15 degrees

Upper air data from numerical model forecast valid on 07/26/2026 at 0600 MDT

Freezing level.................. 17440 ft MSL (11117 ft AGL)
Convective condensation level... 14918 ft MSL (8595 ft AGL)
Lifted condensation level....... 16584 ft MSL (10261 ft AGL)
Lifted index.................... -2.9
K index......................... +31.6

Height  Temperature  Wind  Wind Spd  Lapse Rate  ConvectionT  Thermal  Lift Rate
ft MSL  deg C deg F   Dir   kt  m/s  C/km F/kft  deg C deg F   Index    fpm  m/s
--------------------------------------------------------------------------------
 50000  -67.5 -89.5   085   24   12   3.3   1.8   71.8 161.3    22.0      M    M
 45000  -59.7 -75.5   080   26   13   7.6   4.2   61.4 142.5    16.9      M    M
 40000  -47.6 -53.7   090   16    8   8.1   4.4   56.8 134.3    14.9      M    M
 38000  -42.8 -45.0   090   13    7   8.1   4.4   55.4 131.7    14.3      M    M
 36000  -37.9 -36.2   095   10    5   8.4   4.6   54.3 129.7    13.8      M    M
 34000  -32.9 -27.2   130   10    5   8.4   4.6   53.0 127.4    13.2      M    M
 32000  -27.9 -18.2   155   13    7   7.8   4.3   52.1 125.8    12.9      M    M
 30000  -22.8  -9.0   155   11    6   7.7   4.2   50.2 122.3    11.7      M    M
 29000  -20.5  -4.9   155   10    5   7.8   4.3   49.5 121.1    11.3      M    M
 28000  -18.3  -0.9   155   10    5   7.0   3.8   48.5 119.4    10.6      M    M
 27000  -16.2   2.8   155    9    5   7.0   3.8   47.4 117.4     9.9      M    M
 26000  -14.2   6.4   155    9    5   7.0   3.8   46.5 115.6     9.2      M    M
 25000  -12.2  10.0   155    8    4   5.6   3.1   45.4 113.7     8.4      M    M
 24000  -10.5  13.1   155    7    4   5.8   3.2   43.8 110.9     7.1      M    M
 23000   -8.9  16.0   160    6    3   5.9   3.2   42.5 108.4     5.9      M    M
 22000   -7.3  18.9   160    5    2   4.7   2.6   41.1 105.9     4.7      M    M
 21000   -6.0  21.2   155    4    2   5.0   2.7   39.3 102.7     3.1      M    M
 20000   -4.6  23.7   145    3    2   5.2   2.8   37.7  99.8     1.6      M    M
 19500   -4.0  24.8   135    3    1   6.4   3.5   36.9  98.5     0.9      M    M
 19000   -2.8  27.0   160    3    1   7.8   4.3   36.6  97.8     0.5      M    M
 18500   -1.7  28.9   180    4    2   8.2   4.5   36.3  97.3     0.2      M    M
 18000   -0.8  30.6   185    4    2   4.2   2.3   35.7  96.3    -0.3   1058  5.4
 17500   -0.2  31.6   180    5    3   4.2   2.3   34.7  94.5    -1.2   1026  5.2
 17000    0.9  33.6   170    6    3   8.0   4.4   33.6  92.5    -2.3    971  4.9
 16500    2.0  35.6   160    6    3   8.0   4.4   33.3  91.9    -2.7    923  4.7
 16000    3.1  37.6   150    6    3   7.9   4.3   33.0  91.4    -3.0    874  4.4
 15500    4.2  39.6   145    5    3   7.7   4.2   32.7  90.8    -3.4    826  4.2
 15000    5.3  41.5   140    5    2   7.8   4.3   32.3  90.2    -3.7    778  4.0
 14500    6.5  43.7   130    4    2   8.6   4.7   32.1  89.8    -4.0    727  3.7
 14000    7.8  46.0   115    3    2   8.5   4.7   31.9  89.4    -4.2    675  3.4
 13500    9.1  48.4   100    3    2   8.9   4.9   31.7  89.1    -4.4    622  3.2
 13000   10.4  50.7   085    3    2   8.9   4.9   31.6  88.9    -4.6    568  2.9
 12500   11.7  53.1   075    3    2   8.1   4.4   31.4  88.6    -4.8    515  2.6
 12000   12.8  55.0   055    2    1   8.0   4.4   31.1  88.0    -5.1    465  2.4
 11500   13.9  57.0   025    2    1   7.2   4.0   30.8  87.5    -5.5    418  2.1
 11000   15.0  59.0   330    2    1   7.4   4.1   30.4  86.8    -5.9    372  1.9
 10500   16.0  60.8   310    4    2   7.0   3.9   30.1  86.1    -6.4    326  1.7
 10250   16.5  61.7   310    4    2   8.1   4.4   29.9  85.8    -6.6    303  1.5
 10000   17.2  63.0   305    5    2   9.3   5.1   29.8  85.7    -6.6    276  1.4
  9750   17.9  64.2   305    5    3   9.0   4.9   29.8  85.6    -6.7    248  1.3
  9500   18.5  65.3   305    5    3   8.7   4.8   29.7  85.5    -6.8    221  1.1
  9250   19.1  66.4   305    6    3   8.2   4.5   29.6  85.3    -6.9    196  1.0
  9000   19.7  67.5   300    7    4   6.9   3.8   29.4  85.0    -7.1    171  0.9
  8750   20.1  68.2   300    8    4   6.0   3.3   29.2  84.5    -7.4    150  0.8
  8500   20.6  69.1   300    9    4   5.7   3.1   28.9  84.0    -7.7    130  0.7
  8250   20.9  69.6   295   10    5   5.2   2.9   28.5  83.4    -8.1    111  0.6
  8000   21.3  70.3   295   11    5   5.5   3.0   28.2  82.8    -8.5     93  0.5
  7750   21.7  71.1   290   11    6   5.0   2.8   27.9  82.2    -8.8     74  0.4
  7500   21.9  71.4   290   12    6   2.9   1.6   27.5  81.4    -9.3     59  0.3
  7250   22.1  71.8   290   12    6   1.9   1.0   26.9  80.4   -10.0     49  0.2
  7000   22.2  72.0   290   11    6   2.0   1.1   26.3  79.3   -10.6     38  0.2
  6750   22.3  72.1   290   11    6   1.6   0.9   25.7  78.3   -11.3     28  0.1
  6500   22.3  72.1   290    9    5   2.0   1.1   25.1  77.2   -11.9     18  0.1
  6250      M     M     M    M    M     M     M      M     M       M      M    M

 * * * * * * Numerical weather prediction model forecast data valid * * * * * *

           07/26/2026 at 0900 MDT          |       07/26/2026 at 1200 MDT
                                           |
CAPE...  +352.6    LI...       -2.2        | CAPE...  +604.2    LI...       -1.9
CINH...   -64.2    K Index... +31.0        | CINH...    -0.4    K Index... +32.9
                                           |
Height Temperature  Wnd WndSpd  Lapse Rate | Temperature  Wnd WndSpd  Lapse Rate
ft MSL deg C deg F  Dir kt m/s  C/km F/kft | deg C deg F  Dir kt m/s  C/km F/kft
--------------------------------------------------------------------------------
 50000 -67.5 -89.5  085  25 13   3.1   1.7 | -67.8 -90.0  095  26 14   3.5   1.9
 45000 -59.3 -74.7  085  26 14   7.7   4.2 | -59.1 -74.4  095  28 14   7.8   4.3
 40000 -47.5 -53.5  085  17  9   8.3   4.6 | -47.4 -53.3  080  20 10   8.0   4.4
 38000 -42.5 -44.5  090  16  8   8.3   4.6 | -42.6 -44.7  090  17  9   8.0   4.4
 36000 -37.6 -35.7  100  14  7   7.9   4.3 | -37.8 -36.0  095  14  7   8.2   4.5
 34000 -32.9 -27.2  115  11  6   7.9   4.4 | -32.9 -27.2  105  11  6   8.2   4.5
 32000 -28.1 -18.6  140  10  5   8.0   4.4 | -28.0 -18.4  120   9  4   7.5   4.1
 30000 -22.7  -8.9  135  11  6   8.0   4.4 | -23.0  -9.4  140  12  6   7.5   4.1
 29000 -20.3  -4.5  135  12  6   8.1   4.4 | -20.7  -5.3  145  13  7   7.5   4.1
 28000 -18.2  -0.8  140  11  6   6.8   3.7 | -18.4  -1.1  150  14  7   7.7   4.2
 27000 -16.2   2.8  140  10  5   6.8   3.7 | -16.1   3.0  155  14  7   7.7   4.2
 26000 -14.2   6.4  145   9  5   6.8   3.7 | -13.8   7.2  155  14  7   7.7   4.2
 25000 -12.2  10.0  150   8  4   6.1   3.3 | -11.7  10.9  160  13  7   5.7   3.1
 24000 -10.4  13.3  145   8  4   6.2   3.4 |  -9.9  14.2  160  11  6   6.0   3.3
 23000  -8.6  16.5  135   7  4   6.2   3.4 |  -8.2  17.2  155   8  4   6.2   3.4
 22000  -6.9  19.6  125   7  3   5.0   2.7 |  -6.5  20.3  150   6  3   5.3   2.9
 21000  -5.5  22.1  120   4  2   5.2   2.9 |  -4.9  23.2  135   5  3   5.5   3.0
 20000  -4.1  24.6  100   2  1   5.4   2.9 |  -3.4  25.9  105   4  2   5.5   3.0
 19500  -3.3  26.1  075   2  1   6.0   3.3 |  -2.6  27.3  095   5  2   5.4   3.0
 19000  -2.4  27.7  055   2  1   6.6   3.6 |  -1.9  28.6  075   4  2   5.4   2.9
 18500  -1.5  29.3  035   2  1   6.8   3.7 |  -1.2  29.8  060   4  2   5.6   3.1
 18000  -0.6  30.9  010   1  1   5.5   3.0 |  -0.6  30.9  045   4  2   4.5   2.5
 17500   0.1  32.2  305   1  1   5.6   3.1 |  -0.0  32.0  035   4  2   4.7   2.6
 17000   1.3  34.3  265   2  1   6.2   3.4 |   1.0  33.8  010   3  1   6.7   3.7
 16500   2.2  36.0  250   2  1   6.2   3.4 |   1.9  35.4  340   2  1   6.7   3.7
 16000   3.0  37.4  225   2  1   7.3   4.0 |   2.8  37.0  290   1  1   7.3   4.0
 15500   4.2  39.6  185   1  1   8.3   4.5 |   3.9  39.0  270   2  1   7.9   4.3
 15000   5.4  41.7  135   2  1   8.4   4.6 |   5.0  41.0  255   2  1   8.1   4.5
 14500   6.7  44.1  115   2  1   8.8   4.8 |   6.3  43.3  255   3  1   9.3   5.1
 14000   8.0  46.4  105   3  1   8.9   4.9 |   7.7  45.9  255   3  2   9.3   5.1
 13500   9.2  48.6  100   3  2   8.1   4.5 |   9.0  48.2  255   3  2   9.2   5.0
 13000  10.4  50.7  100   3  1   8.2   4.5 |  10.4  50.7  260   4  2   9.2   5.0
 12500  11.5  52.7  095   2  1   7.5   4.1 |  11.8  53.2  260   4  2   9.4   5.2
 12000  12.6  54.7  330   1  1   7.4   4.1 |  13.2  55.8  260   4  2   9.5   5.2
 11500  13.6  56.5  310   3  2   7.7   4.2 |  14.5  58.1  260   4  2   9.3   5.1
 11000  14.9  58.8  295   4  2   8.5   4.6 |  16.0  60.8  260   5  2   9.7   5.3
 10500  16.1  61.0  290   6  3   6.7   3.7 |  17.4  63.3  260   5  3   8.7   4.8
 10250  16.5  61.7  290   6  3   6.7   3.7 |  18.0  64.4  260   5  3   9.3   5.1
 10000  17.1  62.8  285   6  3   8.3   4.5 |  18.8  65.8  260   5  3  10.5   5.8
  9750  17.7  63.9  285   7  3   7.9   4.3 |  19.5  67.1  260   6  3  10.2   5.6
  9500  18.2  64.8  280   7  4   6.7   3.7 |  20.3  68.5  260   6  3  10.7   5.9
  9250  18.6  65.5  280   7  4   5.8   3.2 |  21.1  70.0  260   6  3  10.7   5.9
  9000  19.0  66.2  280   7  4   5.1   2.8 |  21.9  71.4  260   6  3   9.8   5.4
  8750  19.3  66.7  280   7  3   4.6   2.5 |  22.6  72.7  260   6  3   9.4   5.1
  8500  19.7  67.5  280   7  3   6.1   3.3 |  23.3  73.9  260   6  3   9.8   5.4
  8250  20.1  68.2  280   6  3   6.7   3.6 |  24.0  75.2  260   7  3   9.9   5.4
  8000  20.6  69.1  280   6  3   7.0   3.8 |  24.8  76.6  255   7  3  10.0   5.5
  7750  21.1  70.0  280   6  3   8.5   4.7 |  25.5  77.9  255   7  4  10.3   5.6
  7500  21.8  71.2  280   6  3   9.6   5.3 |  26.3  79.3  255   7  4  10.3   5.6
  7250  22.5  72.5  280   5  3  10.0   5.5 |  27.0  80.6  255   7  4  10.6   5.8
  7000  23.3  73.9  280   5  3   9.4   5.1 |  27.8  82.0  255   7  4   9.5   5.2
  6750  24.0  75.2  280   5  3  11.8   6.5 |  28.6  83.5  255   7  4  14.2   7.8
  6500  25.1  77.2  280   5  2  18.0   9.9 |  30.1  86.2  255   7  4  26.4  14.5
  6250     M     M    M   M  M     M     M |     M     M    M   M  M     M     M

           07/26/2026 at 1500 MDT          |       07/26/2026 at 1800 MDT
                                           |
CAPE...  +413.1    LI...       -2.4        | CAPE...  +214.4    LI...       -1.6
CINH...    -4.9    K Index... +34.2        | CINH...   -29.4    K Index... +32.9
                                           |
Height Temperature  Wnd WndSpd  Lapse Rate | Temperature  Wnd WndSpd  Lapse Rate
ft MSL deg C deg F  Dir kt m/s  C/km F/kft | deg C deg F  Dir kt m/s  C/km F/kft
--------------------------------------------------------------------------------
 50000 -67.8 -90.0  095  26 13   4.0   2.2 | -68.0 -90.4  090  27 14   4.5   2.4
 45000 -58.9 -74.0  090  26 13   7.5   4.1 | -59.1 -74.4  080  23 12   7.6   4.2
 40000 -47.4 -53.3  075  19 10   8.1   4.4 | -46.8 -52.2  055  18  9   8.3   4.6
 38000 -42.6 -44.7  085  17  9   8.1   4.4 | -41.8 -43.2  065  16  8   8.3   4.6
 36000 -37.7 -35.9  090  15  8   8.0   4.4 | -36.9 -34.4  075  15  8   7.7   4.2
 34000 -33.0 -27.4  095  13  7   8.0   4.4 | -32.3 -26.1  075  14  7   7.7   4.2
 32000 -28.2 -18.8  105  11  6   7.5   4.1 | -27.7 -17.9  080  13  7   7.9   4.3
 30000 -23.1  -9.6  135  12  6   7.5   4.1 | -22.9  -9.2  120  12  6   7.9   4.3
 29000 -20.9  -5.6  150  14  7   7.5   4.1 | -20.5  -4.9  140  13  7   7.9   4.3
 28000 -18.6  -1.5  155  14  7   7.6   4.1 | -18.3  -0.9  150  15  8   7.2   4.0
 27000 -16.3   2.7  165  13  7   7.6   4.1 | -16.1   3.0  160  15  8   7.2   4.0
 26000 -14.1   6.6  175  13  7   7.6   4.1 | -13.9   7.0  170  17  9   7.2   4.0
 25000 -11.9  10.6  180  13  6   6.6   3.6 | -11.9  10.6  175  17  9   4.9   2.7
 24000  -9.9  14.2  175  10  5   6.7   3.7 | -10.5  13.1  175  14  7   5.0   2.7
 23000  -8.0  17.6  165   8  4   6.8   3.8 |  -9.1  15.6  170  11  6   5.3   2.9
 22000  -6.2  20.8  155   6  3   4.0   2.2 |  -7.1  19.2  165   7  4   7.0   3.8
 21000  -5.0  23.0  130   6  3   4.5   2.5 |  -5.2  22.6  140   4  2   7.1   3.9
 20000  -3.8  25.2  110   7  4   4.8   2.7 |  -3.2  26.2  075   4  2   7.4   4.1
 19500  -3.2  26.2  105   8  4   5.5   3.0 |  -2.3  27.9  055   4  2   5.7   3.1
 19000  -2.5  27.5  105   7  4   6.0   3.3 |  -1.5  29.3  060   4  2   5.6   3.0
 18500  -1.7  28.9  105   7  4   6.0   3.3 |  -0.8  30.6  060   4  2   5.6   3.1
 18000  -0.8  30.6  105   6  3   8.0   4.4 |   0.1  32.2  055   4  2   6.1   3.3
 17500   0.9  33.6  125   4  2   8.1   4.4 |   1.0  33.8  045   3  2   6.0   3.3
 17000   1.9  35.4  140   3  1   6.9   3.8 |   1.9  35.4  035   2  1   7.1   3.9
 16500   2.9  37.2  175   2  1   7.0   3.8 |   2.9  37.2  010   2  1   7.4   4.0
 16000   3.9  39.0  230   2  1   7.2   4.0 |   4.0  39.2  340   2  1   7.6   4.1
 15500   5.0  41.0  245   3  1   7.4   4.1 |   5.2  41.4  305   2  1   8.0   4.4
 15000   6.0  42.8  250   4  2   7.5   4.1 |   6.3  43.3  290   3  2   8.0   4.4
 14500   7.3  45.1  250   5  2   8.9   4.9 |   7.5  45.5  280   4  2   8.3   4.6
 14000   8.6  47.5  250   5  3   8.8   4.8 |   8.8  47.8  270   5  2   8.3   4.5
 13500   9.9  49.8  250   5  3   9.1   5.0 |  10.0  50.0  270   6  3   8.9   4.9
 13000  11.2  52.2  250   6  3   9.0   5.0 |  11.4  52.5  265   6  3   9.0   4.9
 12500  12.6  54.7  250   6  3   9.5   5.2 |  12.7  54.9  265   7  4   9.2   5.0
 12000  14.0  57.2  250   6  3   9.6   5.3 |  14.1  57.4  260   8  4   9.3   5.1
 11500  15.5  59.9  255   7  3   9.7   5.3 |  15.5  59.9  260   8  4   9.3   5.1
 11000  16.9  62.4  255   7  3   9.7   5.3 |  16.8  62.2  255   8  4   9.2   5.1
 10500  18.3  64.9  255   7  3   9.3   5.1 |  18.2  64.8  245   9  5   9.2   5.1
 10250  19.0  66.2  255   7  3   9.4   5.2 |  18.9  66.0  245   9  5   9.6   5.3
 10000  19.8  67.6  255   7  4  10.0   5.5 |  19.6  67.3  240   9  5  10.0   5.5
  9750  20.5  68.9  255   7  4   9.7   5.3 |  20.4  68.7  240   9  5   9.8   5.4
  9500  21.2  70.2  255   7  4  10.2   5.6 |  21.1  70.0  235   9  5  10.2   5.6
  9250  22.0  71.6  255   7  4  10.3   5.6 |  21.9  71.4  235   9  5  10.5   5.8
  9000  22.7  72.9  255   7  4   9.5   5.2 |  22.6  72.7  230   9  5   9.5   5.2
  8750  23.4  74.1  255   7  4   9.1   5.0 |  23.3  73.9  225   9  5   8.8   4.8
  8500  24.1  75.4  255   7  4   9.7   5.3 |  24.0  75.2  225   9  5   9.6   5.3
  8250  24.9  76.8  255   7  4  10.3   5.7 |  24.8  76.6  220   9  5  10.7   5.9
  8000  25.6  78.1  255   8  4   9.8   5.4 |  25.5  77.9  215   9  5   9.9   5.4
  7750  26.3  79.3  255   8  4   9.3   5.1 |  26.2  79.2  210   9  5   9.1   5.0
  7500  27.0  80.6  255   8  4   9.6   5.3 |  26.9  80.4  205   9  5   8.3   4.6
  7250  27.8  82.0  260   8  4   9.9   5.4 |  27.5  81.5  200   8  4   7.6   4.2
  7000  28.5  83.3  260   8  4   9.7   5.3 |  28.1  82.6  195   8  4   8.0   4.4
  6750  29.2  84.6  260   8  4  10.3   5.7 |  28.6  83.5  185   7  4   7.1   3.9
  6500  30.0  86.0  260   7  4  12.2   6.7 |  29.0  84.2  175   7  3   2.7   1.5
  6250     M     M    M   M  M     M     M |     M     M    M   M  M     M     M
________________________________________________________________________________

This product is issued once per day, at approximately 730 AM local
time. It is not continuously monitored nor updated after its initial
issuance.

The information contained herein is based on numerical weather prediction
model data for the Moriarty Municipal Airport site in Moriarty, New Mexico at

                   North Latitude:  34.9781667 deg
                   West Longitude: 106.0000278 deg
                   Elevation: 6204.2 feet (1891.0 meters)

and may not be representative of other areas along and east of the Sandia
and Manzano Mountains. Note that some elevations in numerical weather
prediction models differ from actual station elevations, which can lead to
data which appear to be below ground.  Erroneous data such as these should
not be used.

The content and format of this report as well as the issuance times are subject
to change without prior notice.  Comments are welcome and should be directed
to one of the addresses or phone numbers shown at the bottom of this page.

DEFINITIONS:

CAPE (Convective Available Potential Energy) - An integrated measure of the
     energy available for convective development, also known as the positive
     area on a thermodynamic diagram.  Units are Joules per kilogram.  Larger
     values are indicative of greater instability and the possibility of
     stronger convective activity, including thunderstorms.  Values around or
     greater than 1000 suggest the possibility of severe weather should
     convective activity develop.

CINH (Convective Inhibition) - An integrated measure of the amount of energy
     needed to initiate convective activity, also known as the negative area on
     a thermodynamic diagram.  Units are Joules per kilogram.  The more negative
     this number, the more energy is required to initiate convection.  This
     inhibitive energy can be overcome through surface heating, cooling aloft,
     lifting mechanisms (orographic, frontal, gravity waves, etc.)

Convective Condensation Level - The height to which an air parcel possessing the
     average saturation mixing ratio in the lowest 4000 feet of the airmass,
     if heated sufficiently from below, will rise dry adiabatically until it
     just becomes saturated.  It estimates the base of cumulus clouds that are
     produced by surface heating only.

Convection Temperature (ConvectionT) - The surface temperature required to make
     the airmass dry adiabatic up to the given level.  It can be considered a
     "trigger temperature" for that level.

Freezing Level - The height where the temperature is zero degrees Celsius.

Height of Stable Layer - The height (between 12,000 and 18,000 feet above
     mean sea level) where the smallest lapse rate exists.  The location and
     existence of this feature is important in the generation of mountain
     waves.

K Index - A measure of stability which combines the temperature difference
     between approximately 5,000 and 18,000 feet above the surface, the amount
     of moisture at approximately 5,000 feet above the surface, and a measure
     of the dryness at approximately 10,000 feet above the surface.  Larger
     positive numbers indicate more instability and a greater likelihood of
     thunderstorm development.  One interpretation of K index values regarding
     soaring in the western United States is given in WMO Technical Note 158
     and is reproduced in the following table:

          below -10    no or weak thermals
           -10 to 5    dry thermals or 1/8 cumulus with moderate thermals
            5 to 15    good soaring conditions
           15 to 20    good soaring conditions with occasional showers
           20 to 30    excellent soaring conditions, but increasing
                       probability of showers and thunderstorms
           above 30    more than 60 percent probability of thunderstorms

Lapse Rate - The change with height of the temperature. Negative values indicate
     inversions.

Lifted Condensation Level - The height to which an air parcel possessing the
     average dew point in the lowest 4000 feet of the airmass and the forecast
     maximum temperature must be lifted dry adiabatically to attain saturation.

Lifted Index (LI) - The difference between the environmental temperature at a
     level approximately 18,000 feet above the surface and the temperature of
     an air parcel lifted dry adiabatically from the surface to its lifted
     condensation level and then pseudoadiabatically thereafter to this same
     level.  The parcel's initial temperature is the forecast maximum
     temperature and its dew point is the average dew point in the lowest 4000
     feet of the airmass.  Negative values are indicative of instability with
     positive values showing stable conditions.

Lift Rate - An experimental estimate of the strength of thermals.  It is
     computed the same way as the maximum rate of lift but uses the actual
     level rather than the maximum height of thermals in the calculation.
     Also, none of the empirical adjustments based on cloudiness and K-index
     are applied to these calculations.

Maximum Height of Thermals - The height where the dry adiabat through the
     forecast maximum temperature intersects the environmental temperature.

Maximum Rate of Lift - An estimate of the maximum strength of thermals.  It
     is computed from an empirical formula which combines the expected maximum
     height of thermals with the difference in the environmental temperatures
     between the maximum height of thermals and the temperature 4,000 feet
     above the ground.  After this computation, further empirical adjustments
     are made based on the value of the K-index and the amount and opacity of
     middle and high level cloudiness expected between the time of trigger
     temperature and the time of overdevelopment.

Middle/High Clouds - The amount and opacity of middle (altostratus, altocumulus)
     or high (cirrus, cirrostratus, cirrocumulus) clouds.  Broken means that
     between 60% and 90% of the sky is covered by the cloud, with overcast
     conditions occurring when more than 90% of the sky is covered by the cloud.
     Thin implies that the clouds are predominantly transparent, meaning that
     some sunlight is reaching the ground, in contrast to opaque which suggests
     that little sunlight is reaching the ground.

Potential Height of Wave - The minimum of the following two heights:
     1. Level above the height of stable layer (or 14,000 feet if none exists)
        where the wind direction changes by 30 degrees or more
     2. Level above the height of stable layer (or 14,000 feet if none exists)
        where the wind speed no longer increases with height

PVA/NVA - Positive vorticity advection (PVA)/negative vorticity advection (NVA)
     on the 500 millibar isobaric surface (approximately 18,000 feet above mean
     sea level).  Weak PVA has been shown to assist in mountain wave soaring.

Soaring Window - The time between the time the trigger temperature is reached
                 and the time of overdevelopment.

Thermal Index - The difference between the environmental temperature and the
     temperature at a particular level determined by following the dry adiabat
     through the forecast maximum temperature up to that level.  Negative values
     are indicative of thermal lift.

Thermal Soaring Index - An adjective rating (for sailplanes) based on the
     computed maximum rate of lift, and the wind speed and middle and high
     cloud cover expected during the soaring window (the time of the trigger
     temperature and the time of overdevelopment) according to the following:

                 Maximum rate of lift        Adjective Rating
                      >= 800 fpm                 Excellent
                 >= 400 and < 800 fpm              Good
                 >= 200 and < 400 fpm              Fair
                       < 200 fpm                   Poor

Time of Overdevelopment - The time one or more of the following phenomena,
     which essentially shut off thermal lift, is expected to occur:
     1. formation of broken to overcast convective cloud cover
     2. formation of scattered to numerous downbursts
     3. initiation of widespread precipitation

Time of Trigger Temperature - The time the surface temperature is expected to
     reach the trigger temperature.

Trigger Temperature - The surface temperature required to make the first 4000
     feet of the atmosphere dry adiabatic.

Wave Soaring Index - An empirical, adjective rating (for sailplanes) which
     attempts to combine a variety of phenomena important in mountain wave
     soaring into a single index number.  Objective points are assigned to
     these phenomena: wind speed and direction at 14,000 ft MSL, the static
     stability in the 12,000-18,000 ft MSL layer, the wind speed gradient above
     the stable layer, jet stream location and frontal and upper trough
     movements.

042613
Soaring Forecast for Albuquerque NM
National Weather Service Albuquerque NM
0722 MDT Sunday July 26 2026
This forecast is for Sunday, July 26, 2026:
If the trigger temperature of 86.3 F/30.2 C is reached...then
Thermal Soaring Index....................... Excellent
Maximum rate of lift........................ 1308 ft/min (6.6 m/s)
Maximum height of thermals.................. 17921 ft MSL (12260 ft AGL)
Forecast maximum temperature................... 97.0 F/36.6 C
Time of trigger temperature.................... 1045 MDT
Time of overdevelopment........................ None
Middle/high clouds during soaring window....... None
Surface winds during soaring window............ 20 mph or less
Height of the -3 thermal index................. 14552 ft MSL (8890 ft AGL)
Thermal soaring outlook for Monday 07/27....... Excellent
Remarks...
Sunrise/Sunset.................... 06:11:44 / 20:14:22 MDT
Total possible sunshine........... 14 hr 2 min 37 sec (842 min 37 sec)
Altitude of sun at 13:13:03 MDT... 74.00 degrees
Upper air data from numerical model forecast valid on 07/26/2026 at 0600 MDT
Freezing level.................. 17540 ft MSL (11879 ft AGL)
Convective condensation level... 14803 ft MSL (9142 ft AGL)
Lifted condensation level....... 16099 ft MSL (10437 ft AGL)
Lifted index.................... -3.5
K index......................... +30.8
Height Temperature Wind Wind Spd Lapse Rate ConvectionT Thermal Lift Rate
ft MSL deg C deg F Dir kt m/s C/km F/kft deg C deg F Index fpm m/s
--------------------------------------------------------------------------------
50000 -67.7 -89.9 080 20 10 3.5 1.9 73.7 164.7 22.3 M M
45000 -59.6 -75.3 085 23 12 7.7 4.2 63.6 146.5 17.5 M M
40000 -47.3 -53.1 090 14 7 8.1 4.5 59.3 138.8 15.8 M M
38000 -42.4 -44.3 085 12 6 8.1 4.5 57.9 136.3 15.2 M M
36000 -37.5 -35.5 090 10 5 8.4 4.6 56.9 134.3 14.8 M M
34000 -32.4 -26.3 125 10 5 8.4 4.6 55.6 132.1 14.3 M M
32000 -27.4 -17.3 150 12 6 7.2 4.0 54.7 130.4 13.9 M M
30000 -23.1 -9.6 155 13 7 7.3 4.0 52.6 126.6 12.6 M M
29000 -20.9 -5.6 155 13 7 7.3 4.0 51.7 125.1 12.0 M M
28000 -18.9 -2.0 160 13 6 6.5 3.6 50.6 123.2 11.3 M M
27000 -16.9 1.6 160 11 6 6.5 3.6 49.3 120.8 10.4 M M
26000 -15.0 5.0 160 10 5 6.6 3.6 48.2 118.7 9.5 M M
25000 -12.7 9.1 165 8 4 5.8 3.2 46.7 116.0 8.3 M M
24000 -11.0 12.2 175 7 4 5.9 3.2 45.2 113.3 7.1 M M
23000 -9.3 15.3 190 7 4 6.0 3.3 43.8 110.9 6.0 M M
22000 -7.6 18.3 200 7 4 5.9 3.3 42.5 108.5 4.8 M M
21000 -5.9 21.4 195 8 4 6.0 3.3 41.1 106.0 3.6 M M
20000 -4.2 24.4 190 9 5 6.0 3.3 39.8 103.7 2.4 M M
19500 -3.4 25.9 190 9 5 5.8 3.2 39.2 102.6 1.9 M M
19000 -2.5 27.5 190 10 5 5.8 3.2 38.5 101.3 1.2 M M
18500 -1.7 28.9 190 11 6 5.8 3.2 37.8 100.1 0.6 M M
18000 -0.8 30.6 185 11 6 6.4 3.5 37.2 99.0 0.1 M M
17500 0.1 32.2 185 11 6 6.3 3.5 36.6 98.0 -0.5 1070 5.4
17000 1.0 33.8 185 10 5 7.1 3.9 36.1 97.0 -1.0 1028 5.2
16500 2.1 35.8 180 9 5 7.4 4.1 35.7 96.3 -1.4 981 5.0
16000 3.2 37.8 180 8 4 7.4 4.1 35.3 95.6 -1.8 934 4.7
15500 4.2 39.6 175 7 4 7.3 4.0 34.9 94.8 -2.2 888 4.5
15000 5.3 41.5 165 6 3 7.2 3.9 34.5 94.1 -2.7 842 4.3
14500 6.4 43.5 155 5 3 8.4 4.6 34.2 93.5 -3.0 793 4.0
14000 7.6 45.7 145 4 2 8.3 4.6 33.9 93.1 -3.3 743 3.8
13500 8.8 47.8 130 3 2 8.4 4.6 33.7 92.7 -3.5 692 3.5
13000 10.0 50.0 120 3 1 8.4 4.6 33.5 92.3 -3.8 640 3.3
12500 11.2 52.2 105 2 1 8.3 4.6 33.3 91.9 -4.0 588 3.0
12000 12.5 54.5 100 1 1 8.2 4.5 33.0 91.5 -4.3 537 2.7
11500 13.7 56.7 000 0 0 8.2 4.5 32.8 91.1 -4.6 486 2.5
11000 14.9 58.8 290 1 0 8.1 4.4 32.6 90.6 -4.8 435 2.2
10500 16.1 61.0 275 2 1 8.7 4.8 32.4 90.3 -5.1 383 1.9
10250 16.7 62.1 270 2 1 8.0 4.4 32.3 90.1 -5.2 357 1.8
10000 17.3 63.1 270 2 1 7.7 4.2 32.1 89.8 -5.4 333 1.7
9750 17.9 64.2 270 3 1 8.3 4.5 32.0 89.5 -5.6 308 1.6
9500 18.4 65.1 270 3 2 6.4 3.5 31.8 89.3 -5.7 284 1.4
9250 18.8 65.8 280 3 2 5.8 3.2 31.5 88.6 -6.1 266 1.4
9000 19.3 66.7 280 3 2 7.0 3.8 31.2 88.2 -6.4 244 1.2
8750 19.8 67.6 285 4 2 7.4 4.1 31.0 87.8 -6.6 222 1.1
8500 20.3 68.5 285 4 2 4.5 2.5 30.8 87.5 -6.9 200 1.0
8250 20.5 68.9 295 3 2 3.3 1.8 30.3 86.5 -7.4 186 0.9
8000 21.2 70.2 310 3 2 5.2 2.8 29.6 85.2 -8.2 150 0.8
7750 21.5 70.7 315 3 2 4.8 2.6 29.2 84.6 -8.6 132 0.7
7500 21.8 71.2 320 3 2 4.1 2.2 28.8 83.8 -9.1 116 0.6
7250 22.1 71.8 330 3 1 3.8 2.1 28.4 83.1 -9.5 101 0.5
7000 22.3 72.1 340 2 1 4.0 2.2 27.9 82.2 -10.1 87 0.4
6750 22.6 72.7 350 2 1 5.2 2.9 27.5 81.5 -10.5 70 0.4
6500 23.0 73.4 005 2 1 5.8 3.2 27.2 81.0 -10.9 51 0.3
6250 23.4 74.1 020 1 1 5.4 3.0 26.9 80.4 -11.2 32 0.2
6000 23.7 74.7 035 2 1 3.7 2.1 26.5 79.7 -11.7 15 0.1
5750 23.7 74.7 060 2 1 -3.9 -2.2 25.8 78.5 -12.4 7 0.0
5500 M M M M M M M M M M M M
* * * * * * Numerical weather prediction model forecast data valid * * * * * *
07/26/2026 at 0900 MDT | 07/26/2026 at 1200 MDT
|
CAPE... +198.0 LI... -1.5 | CAPE... +459.9 LI... -2.0
CINH... -99.0 K Index... +30.1 | CINH... -27.4 K Index... +29.2
|
Height Temperature Wnd WndSpd Lapse Rate | Temperature Wnd WndSpd Lapse Rate
ft MSL deg C deg F Dir kt m/s C/km F/kft | deg C deg F Dir kt m/s C/km F/kft
--------------------------------------------------------------------------------
50000 -67.8 -90.0 090 23 12 3.4 1.9 | -68.0 -90.4 100 25 13 4.1 2.2
45000 -59.8 -75.6 095 25 13 7.7 4.2 | -59.5 -75.1 100 26 13 7.7 4.2
40000 -47.4 -53.3 100 16 8 8.2 4.5 | -47.2 -53.0 095 17 9 8.1 4.5
38000 -42.4 -44.3 105 13 7 8.2 4.5 | -42.3 -44.1 100 15 8 8.1 4.5
36000 -37.5 -35.5 110 11 5 8.1 4.5 | -37.5 -35.5 110 13 7 8.0 4.4
34000 -32.6 -26.7 135 10 5 8.1 4.5 | -32.7 -26.9 125 11 6 8.0 4.4
32000 -27.8 -18.0 155 11 6 8.0 4.4 | -27.9 -18.2 140 10 5 7.8 4.3
30000 -23.0 -9.4 145 10 5 8.0 4.4 | -23.2 -9.8 140 12 6 7.9 4.3
29000 -20.6 -5.1 135 10 5 8.0 4.4 | -20.8 -5.4 145 13 7 7.8 4.3
28000 -18.5 -1.3 135 10 5 6.3 3.4 | -18.5 -1.3 145 13 7 7.2 4.0
27000 -16.6 2.1 140 10 5 6.2 3.4 | -16.4 2.5 145 12 6 7.2 4.0
26000 -14.3 6.3 140 9 5 6.3 3.4 | -13.7 7.3 150 11 5 7.2 4.0
25000 -12.4 9.7 145 8 4 6.5 3.6 | -11.7 10.9 150 9 5 5.9 3.2
24000 -10.5 13.1 150 7 4 6.6 3.6 | -10.0 14.0 145 8 4 6.0 3.3
23000 -8.6 16.5 160 6 3 6.7 3.7 | -8.3 17.1 140 6 3 6.1 3.3
22000 -6.8 19.8 170 5 3 5.4 2.9 | -6.7 19.9 130 5 3 5.3 2.9
21000 -5.3 22.5 190 3 2 5.5 3.0 | -5.2 22.6 115 4 2 5.4 2.9
20000 -3.7 25.3 240 2 1 5.6 3.0 | -3.7 25.3 095 3 2 5.5 3.0
19500 -3.0 26.6 255 2 1 4.4 2.4 | -2.9 26.8 085 3 2 4.9 2.7
19000 -2.4 27.7 225 2 1 4.2 2.3 | -2.3 27.9 090 3 1 4.9 2.7
18500 -1.9 28.6 200 3 1 4.3 2.4 | -1.6 29.1 100 2 1 5.0 2.7
18000 -1.1 30.0 190 3 2 6.5 3.6 | -0.8 30.6 125 1 1 6.1 3.4
17500 -0.2 31.6 185 4 2 6.4 3.5 | 0.1 32.2 160 2 1 6.0 3.3
17000 0.7 33.3 185 4 2 7.1 3.9 | 1.0 33.8 180 2 1 7.2 4.0
16500 1.8 35.2 180 4 2 7.4 4.1 | 2.1 35.8 180 3 1 7.6 4.2
16000 2.9 37.2 180 3 2 7.5 4.1 | 3.2 37.8 180 3 2 7.8 4.3
15500 4.0 39.2 175 3 1 7.9 4.3 | 4.4 39.9 175 3 2 8.4 4.6
15000 5.1 41.2 165 3 1 7.8 4.3 | 5.6 42.1 165 3 1 8.4 4.6
14500 6.2 43.2 155 2 1 8.2 4.5 | 6.8 44.2 160 3 1 8.6 4.7
14000 7.4 45.3 155 2 1 8.1 4.5 | 8.1 46.6 145 2 1 8.6 4.7
13500 8.6 47.5 155 2 1 8.4 4.6 | 9.3 48.7 135 2 1 8.2 4.5
13000 9.8 49.6 170 2 1 8.4 4.6 | 10.5 50.9 145 2 1 8.1 4.4
12500 11.1 52.0 190 2 1 8.3 4.5 | 11.6 52.9 160 1 1 7.7 4.2
12000 12.3 54.1 205 3 1 8.2 4.5 | 12.7 54.9 200 2 1 7.5 4.1
11500 13.5 56.3 215 3 2 8.0 4.4 | 13.8 56.8 225 2 1 7.1 3.9
11000 14.6 58.3 225 3 2 7.7 4.2 | 14.7 58.5 235 3 2 6.5 3.6
10500 15.8 60.4 230 4 2 8.1 4.5 | 15.7 60.3 235 4 2 7.7 4.2
10250 16.3 61.3 235 4 2 7.3 4.0 | 16.2 61.2 235 5 2 8.0 4.4
10000 16.8 62.2 235 4 2 7.1 3.9 | 16.8 62.2 235 5 3 8.0 4.4
9750 17.4 63.3 240 4 2 7.8 4.3 | 17.4 63.3 235 5 3 7.9 4.4
9500 17.9 64.2 245 4 2 5.1 2.8 | 17.9 64.2 235 5 3 8.1 4.5
9250 18.1 64.6 250 3 2 4.2 2.3 | 18.5 65.3 235 5 3 9.2 5.0
9000 18.5 65.3 260 3 2 6.0 3.3 | 19.2 66.6 235 5 3 9.5 5.2
8750 18.9 66.0 265 3 1 6.0 3.3 | 20.7 69.3 235 6 3 8.0 4.4
8500 19.6 67.3 285 3 1 4.3 2.3 | 21.2 70.2 235 5 3 8.6 4.7
8250 19.9 67.8 290 2 1 6.1 3.3 | 22.0 71.6 235 6 3 11.0 6.0
8000 20.3 68.5 295 2 1 5.8 3.2 | 22.8 73.0 235 6 3 10.5 5.8
7750 20.7 69.3 295 2 1 5.5 3.0 | 23.5 74.3 235 6 3 9.3 5.1
7500 21.1 70.0 290 2 1 6.2 3.4 | 24.2 75.6 235 6 3 9.0 4.9
7250 21.6 70.9 290 2 1 8.8 4.8 | 24.9 76.8 235 6 3 11.0 6.1
7000 22.3 72.1 285 2 1 9.7 5.3 | 25.8 78.4 235 6 3 11.3 6.2
6750 23.0 73.4 280 2 1 9.3 5.1 | 26.6 79.9 235 6 3 10.4 5.7
6500 23.7 74.7 275 2 1 9.4 5.2 | 27.3 81.1 235 6 3 10.4 5.7
6250 24.4 75.9 270 2 1 9.5 5.2 | 28.1 82.6 235 6 3 9.9 5.4
6000 25.2 77.4 270 2 1 12.4 6.8 | 28.9 84.0 235 6 3 14.9 8.2
5750 26.6 79.9 260 2 1 28.5 15.6 | 31.1 88.0 235 6 3 53.6 29.4
5500 M M M M M M M | M M M M M M M
07/26/2026 at 1500 MDT | 07/26/2026 at 1800 MDT
|
CAPE... +433.6 LI... -1.8 | CAPE... +265.3 LI... -1.3
CINH... -6.0 K Index... +29.2 | CINH... -8.4 K Index... +31.5
|
Height Temperature Wnd WndSpd Lapse Rate | Temperature Wnd WndSpd Lapse Rate
ft MSL deg C deg F Dir kt m/s C/km F/kft | deg C deg F Dir kt m/s C/km F/kft
--------------------------------------------------------------------------------
50000 -68.1 -90.6 100 26 13 4.3 2.3 | -67.7 -89.9 090 25 13 4.2 2.3
45000 -59.5 -75.1 100 25 13 7.5 4.1 | -59.0 -74.2 085 23 12 7.7 4.2
40000 -47.3 -53.1 085 17 9 8.3 4.6 | -46.7 -52.1 070 18 9 7.9 4.3
38000 -42.3 -44.1 090 15 8 8.3 4.6 | -42.0 -43.6 080 17 9 7.9 4.3
36000 -37.4 -35.3 095 13 7 8.0 4.4 | -37.3 -35.1 090 16 8 7.8 4.3
34000 -32.6 -26.7 100 11 6 8.0 4.4 | -32.6 -26.7 090 13 7 7.8 4.3
32000 -27.8 -18.0 105 9 4 7.6 4.2 | -28.0 -18.4 090 10 5 7.6 4.2
30000 -23.2 -9.8 135 11 6 7.7 4.2 | -23.3 -9.9 140 11 6 7.7 4.2
29000 -20.9 -5.6 145 13 7 7.7 4.2 | -21.0 -5.8 155 13 7 7.7 4.2
28000 -18.6 -1.5 150 14 7 7.2 3.9 | -18.7 -1.7 165 15 8 7.8 4.3
27000 -16.5 2.3 155 13 7 7.2 3.9 | -16.3 2.7 165 14 7 7.8 4.3
26000 -14.3 6.3 165 12 6 7.2 3.9 | -14.0 6.8 170 14 7 7.8 4.3
25000 -11.8 10.8 165 11 6 6.3 3.5 | -11.3 11.7 175 13 7 6.2 3.4
24000 -9.9 14.2 155 8 4 6.5 3.6 | -9.4 15.1 175 11 6 6.3 3.5
23000 -8.1 17.4 140 6 3 6.7 3.7 | -7.6 18.3 175 9 5 6.5 3.6
22000 -6.4 20.5 120 5 3 5.2 2.8 | -5.9 21.4 175 7 4 5.0 2.7
21000 -4.9 23.2 110 4 2 5.3 2.9 | -4.5 23.9 175 6 3 5.2 2.9
20000 -3.4 25.9 090 3 2 5.4 2.9 | -3.1 26.4 170 5 3 5.4 2.9
19500 -2.6 27.3 080 3 2 6.0 3.3 | -2.4 27.7 175 5 3 5.5 3.0
19000 -1.7 28.9 075 4 2 6.1 3.4 | -1.6 29.1 185 5 3 5.5 3.0
18500 -0.9 30.4 070 4 2 6.2 3.4 | -0.8 30.6 190 6 3 5.6 3.1
18000 0.1 32.2 070 4 2 6.8 3.8 | 0.0 32.0 195 6 3 6.5 3.6
17500 1.1 34.0 075 4 2 6.8 3.7 | 0.9 33.6 205 6 3 6.5 3.5
17000 2.1 35.8 075 4 2 7.3 4.0 | 1.9 35.4 210 7 3 7.3 4.0
16500 3.2 37.8 080 4 2 7.5 4.1 | 2.9 37.2 215 7 4 7.7 4.2
16000 4.2 39.6 085 3 2 7.3 4.0 | 4.0 39.2 220 7 4 7.9 4.4
15500 5.2 41.4 105 2 1 6.8 3.7 | 5.2 41.4 225 7 4 8.8 4.8
15000 6.2 43.2 155 2 1 6.7 3.7 | 6.5 43.7 225 7 4 8.7 4.8
14500 7.2 45.0 190 3 1 8.2 4.5 | 7.8 46.0 230 7 4 9.4 5.2
14000 8.3 46.9 210 4 2 8.1 4.5 | 9.2 48.6 230 7 4 9.4 5.2
13500 9.5 49.1 215 5 3 8.8 4.8 | 10.6 51.1 230 8 4 9.6 5.2
13000 10.8 51.4 215 6 3 9.0 4.9 | 12.0 53.6 235 8 4 9.6 5.3
12500 12.1 53.8 220 6 3 9.3 5.1 | 13.4 56.1 235 7 4 9.6 5.3
12000 13.5 56.3 220 7 3 9.5 5.2 | 14.8 58.6 235 7 4 9.5 5.2
11500 14.9 58.8 220 7 4 9.3 5.1 | 16.3 61.3 235 7 4 9.3 5.1
11000 16.3 61.3 220 7 4 8.8 4.8 | 17.6 63.7 235 7 4 8.7 4.8
10500 17.7 63.9 225 7 4 10.6 5.8 | 19.0 66.2 235 7 3 10.5 5.8
10250 18.5 65.3 225 8 4 9.5 5.2 | 19.8 67.6 235 7 3 9.7 5.3
10000 19.2 66.6 225 8 4 9.5 5.2 | 20.5 68.9 235 6 3 9.6 5.3
9750 19.9 67.8 225 8 4 9.1 5.0 | 21.2 70.2 235 6 3 9.4 5.2
9500 20.6 69.1 225 8 4 10.5 5.7 | 21.9 71.4 235 6 3 10.2 5.6
9250 21.4 70.5 225 8 4 10.7 5.9 | 22.7 72.9 235 6 3 10.1 5.5
9000 22.1 71.8 225 8 4 9.4 5.1 | 23.4 74.1 235 6 3 9.0 4.9
8750 22.9 73.2 225 9 4 10.2 5.6 | 24.1 75.4 235 6 3 9.9 5.4
8500 23.6 74.5 225 9 4 8.2 4.5 | 24.8 76.6 240 6 3 7.6 4.2
8250 24.9 76.8 225 9 5 11.1 6.1 | 26.1 79.0 240 5 3 10.8 5.9
8000 25.7 78.3 225 9 5 10.8 5.9 | 26.8 80.2 240 5 2 10.5 5.8
7750 26.5 79.7 225 9 5 9.5 5.2 | 27.6 81.7 245 5 2 9.2 5.1
7500 27.2 81.0 225 9 5 9.1 5.0 | 28.2 82.8 245 4 2 8.2 4.5
7250 27.9 82.2 225 9 5 11.0 6.0 | 28.9 84.0 250 4 2 9.7 5.3
7000 28.8 83.8 225 9 5 11.3 6.2 | 29.6 85.3 255 4 2 10.1 5.5
6750 29.6 85.3 225 9 5 10.3 5.7 | 30.4 86.7 260 4 2 9.8 5.4
6500 30.3 86.5 225 9 5 10.1 5.6 | 31.1 88.0 260 3 2 9.9 5.4
6250 31.1 88.0 225 9 5 9.6 5.3 | 31.8 89.2 260 3 2 9.5 5.2
6000 31.9 89.4 225 9 5 16.0 8.8 | 32.6 90.7 265 3 2 12.3 6.8
5750 34.5 94.1 225 9 4 66.0 36.2 | 34.1 93.4 265 3 1 34.4 18.9
5500 M M M M M M M | M M M M M M M
________________________________________________________________________________
This product is issued once per day, at approximately 730 AM.
It is not continuously monitored nor updated after its initial
issuance.
The information contained herein is based on rawinsonde observation and/or
numerical weather prediction model data taken at the Albuquerque International
Sunport site in Albuquerque, New Mexico at
North Latitude: 35.03806 deg
West Longitude: 106.62194 deg
Elevation: 5298.6 feet (1615 meters)
and may not be representative of other areas, especially along and east of
the Sandia and Manzano Mountains. Note that some elevations in numerical weather
prediction models differ from actual station elevations, which can lead to
data which appear to be below ground. Erroneous data such as these should
not be used.
The content and format of this report as well as the issuance times are subject
to change without prior notice. Comments are welcome and should be directed
to one of the addresses or phone numbers shown at the bottom of this page.
DEFINITIONS:
CAPE (Convective Available Potential Energy) - An integrated measure of the
energy available for convective development, also known as the positive
area on a thermodynamic diagram. Units are Joules per kilogram. Larger
values are indicative of greater instability and the possibility of
stronger convective activity, including thunderstorms. Values around or
greater than 1000 suggest the possibility of severe weather should
convective activity develop.
CINH (Convective Inhibition) - An integrated measure of the amount of energy
needed to initiate convective activity, also known as the negative area on
a thermodynamic diagram. Units are Joules per kilogram. The more negative
this number, the more energy is required to initiate convection. This
inhibitive energy can be overcome through surface heating, cooling aloft,
lifting mechanisms (orographic, frontal, gravity waves, etc.)
Convective Condensation Level - The height to which an air parcel possessing the
average saturation mixing ratio in the lowest 4000 feet of the airmass,
if heated sufficiently from below, will rise dry adiabatically until it
just becomes saturated. It estimates the base of cumulus clouds that are
produced by surface heating only.
Convection Temperature (ConvectionT) - The surface temperature required to make
the airmass dry adiabatic up to the given level. It can be considered a
"trigger temperature" for that level.
Freezing Level - The height where the temperature is zero degrees Celsius.
Height of Stable Layer - The height (between 12,000 and 18,000 feet above
mean sea level) where the smallest lapse rate exists. The location and
existence of this feature is important in the generation of mountain
waves.
K Index - A measure of stability which combines the temperature difference
between approximately 5,000 and 18,000 feet above the surface, the amount
of moisture at approximately 5,000 feet above the surface, and a measure
of the dryness at approximately 10,000 feet above the surface. Larger
positive numbers indicate more instability and a greater likelihood of
thunderstorm development. One interpretation of K index values regarding
soaring in the western United States is given in WMO Technical Note 158
and is reproduced in the following table:
below -10 no or weak thermals
-10 to 5 dry thermals or 1/8 cumulus with moderate thermals
5 to 15 good soaring conditions
15 to 20 good soaring conditions with occasional showers
20 to 30 excellent soaring conditions, but increasing
probability of showers and thunderstorms
above 30 more than 60 percent probability of thunderstorms
Lapse Rate - The change with height of the temperature. Negative values indicate
inversions.
Lifted Condensation Level - The height to which an air parcel possessing the
average dew point in the lowest 4000 feet of the airmass and the forecast
maximum temperature must be lifted dry adiabatically to attain saturation.
Lifted Index (LI) - The difference between the environmental temperature at a
level approximately 18,000 feet above the surface and the temperature of
an air parcel lifted dry adiabatically from the surface to its lifted
condensation level and then pseudoadiabatically thereafter to this same
level. The parcel's initial temperature is the forecast maximum
temperature and its dew point is the average dew point in the lowest 4000
feet of the airmass. Negative values are indicative of instability with
positive values showing stable conditions.
Lift Rate - An experimental estimate of the strength of thermals. It is
computed the same way as the maximum rate of lift but uses the actual
level rather than the maximum height of thermals in the calculation.
Also, none of the empirical adjustments based on cloudiness and K-index
are applied to these calculations.
Maximum Height of Thermals - The height where the dry adiabat through the
forecast maximum temperature intersects the environmental temperature.
Maximum Rate of Lift - An estimate of the maximum strength of thermals. It
is computed from an empirical formula which combines the expected maximum
height of thermals with the difference in the environmental temperatures
between the maximum height of thermals and the temperature 4,000 feet
above the ground. After this computation, further empirical adjustments
are made based on the value of the K-index and the amount and opacity of
middle and high level cloudiness expected between the time of trigger
temperature and the time of overdevelopment.
Middle/High Clouds - The amount and opacity of middle (altostratus, altocumulus)
or high (cirrus, cirrostratus, cirrocumulus) clouds. Broken means that
between 60% and 90% of the sky is covered by the cloud, with overcast
conditions occurring when more than 90% of the sky is covered by the cloud.
Thin implies that the clouds are predominantly transparent, meaning that
some sunlight is reaching the ground, in contrast to opaque which suggests
that little sunlight is reaching the ground.
Potential Height of Wave - The minimum of the following two heights:
1. Level above the height of stable layer (or 14,000 feet if none exists)
where the wind direction changes by 30 degrees or more
2. Level above the height of stable layer (or 14,000 feet if none exists)
where the wind speed no longer increases with height
PVA/NVA - Positive vorticity advection (PVA)/negative vorticity advection (NVA)
on the 500 millibar isobaric surface (approximately 18,000 feet above mean
sea level). Weak PVA has been shown to assist in mountain wave soaring.
Soaring Window - The time between the time the trigger temperature is reached
and the time of overdevelopment.
Thermal Index - The difference between the environmental temperature and the
temperature at a particular level determined by following the dry adiabat
through the forecast maximum temperature up to that level. Negative values
are indicative of thermal lift.
Thermal Soaring Index - An adjective rating (for sailplanes) based on the
computed maximum rate of lift, and the wind speed and middle and high
cloud cover expected during the soaring window (the time of the trigger
temperature and the time of overdevelopment) according to the following:
Maximum rate of lift Adjective Rating
>= 800 fpm Excellent
>= 400 and < 800 fpm Good
>= 200 and < 400 fpm Fair
< 200 fpm Poor
Time of Overdevelopment - The time one or more of the following phenomena,
which essentially shut off thermal lift, is expected to occur:
1. formation of broken to overcast convective cloud cover
2. formation of scattered to numerous downbursts
3. initiation of widespread precipitation
Time of Trigger Temperature - The time the surface temperature is expected to
reach the trigger temperature.
Trigger Temperature - The surface temperature required to make the first 4000
feet of the atmosphere dry adiabatic.
Wave Soaring Index - An empirical, adjective rating (for sailplanes) which
attempts to combine a variety of phenomena important in mountain wave
soaring into a single index number. Objective points are assigned to
these phenomena: wind speed and direction at 14,000 ft MSL, the static
stability in the 12,000-18,000 ft MSL layer, the wind speed gradient above
the stable layer, jet stream location and frontal and upper trough
movements.
042613
Soaring Forecast for Santa Fe NM
National Weather Service Albuquerque NM
0723 MDT Sunday July 26 2026

This forecast is for Sunday, July 26, 2026:

If the trigger temperature of 82.6 F/28.1 C is reached...then
   Thermal Soaring Index....................... Excellent
   Maximum rate of lift........................ 1308 ft/min (6.6 m/s)
   Maximum height of thermals.................. 18601 ft MSL (12156 ft AGL)

Forecast maximum temperature................... 94.0 F/34.9 C
Time of trigger temperature.................... 1000 MDT
Time of overdevelopment........................ None
Middle/high clouds during soaring window....... None
Surface winds during soaring window............ 20 mph or less
Height of the -3 thermal index................. 15273 ft MSL (8828 ft AGL)
Thermal soaring outlook for Monday 07/27....... Excellent


Remarks...

Sunrise/Sunset.................... 06:08:21 / 20:13:32 MDT
Total possible sunshine........... 14 hr 5 min 11 sec (845 min 11 sec)
Altitude of sun at 13:10:57 MDT... 73.51 degrees

Upper air data from numerical model forecast valid on 07/26/2026 at 0600 MDT

Freezing level.................. 17387 ft MSL (10942 ft AGL)
Convective condensation level... 15218 ft MSL (8773 ft AGL)
Lifted condensation level....... 16588 ft MSL (10143 ft AGL)
Lifted index.................... -2.9
K index......................... +29.3

Height  Temperature  Wind  Wind Spd  Lapse Rate  ConvectionT  Thermal  Lift Rate
ft MSL  deg C deg F   Dir   kt  m/s  C/km F/kft  deg C deg F   Index    fpm  m/s
--------------------------------------------------------------------------------
 50000  -67.6 -89.7   080   18    9   3.5   1.9   71.1 159.9    21.9      M    M
 45000  -59.5 -75.1   080   19   10   7.8   4.3   61.1 142.0    17.1      M    M
 40000  -47.2 -53.0   100   10    5   8.1   4.4   56.9 134.5    15.4      M    M
 38000  -42.3 -44.1   095   10    5   8.1   4.4   55.5 131.9    14.8      M    M
 36000  -37.5 -35.5   100    9    5   8.3   4.5   54.3 129.8    14.3      M    M
 34000  -32.5 -26.5   130    9    5   8.3   4.5   53.0 127.4    13.7      M    M
 32000  -27.6 -17.7   150   10    5   7.5   4.1   52.0 125.5    13.2      M    M
 30000  -23.1  -9.6   165    9    5   7.6   4.2   50.1 122.2    12.0      M    M
 29000  -20.8  -5.4   175    9    5   7.6   4.2   49.4 120.9    11.6      M    M
 28000  -18.7  -1.7   175    9    5   6.7   3.7   48.4 119.2    10.9      M    M
 27000  -16.7   1.9   175    9    5   6.7   3.7   47.2 116.9    10.0      M    M
 26000  -14.3   6.3   170    9    5   6.7   3.7   45.8 114.5     9.0      M    M
 25000  -12.3   9.9   165    9    5   6.2   3.4   44.7 112.5     8.2      M    M
 24000  -10.5  13.1   160    8    4   6.3   3.4   43.4 110.1     7.1      M    M
 23000   -8.7  16.3   150    8    4   6.3   3.4   42.1 107.9     6.1      M    M
 22000   -7.1  19.2   145    7    3   4.5   2.5   40.8 105.4     4.9      M    M
 21000   -5.8  21.6   150    6    3   4.7   2.6   38.9 102.0     3.2      M    M
 20000   -4.5  23.9   155    5    2   4.7   2.6   37.2  98.9     1.7      M    M
 19500   -3.8  25.2   155    4    2   5.9   3.2   36.4  97.6     1.0      M    M
 19000   -2.9  26.8   145    4    2   6.3   3.5   35.8  96.5     0.4      M    M
 18500   -1.9  28.6   125    4    2   6.4   3.5   35.3  95.5    -0.1   1100  5.6
 18000   -1.1  30.0   115    5    2   5.6   3.1   34.6  94.3    -0.7   1059  5.4
 17500   -0.2  31.6   110    6    3   5.7   3.1   33.9  93.1    -1.3   1019  5.2
 17000    0.6  33.1   105    7    4   7.1   3.9   33.3  91.9    -1.9    979  5.0
 16500    1.7  35.1   105    7    4   7.9   4.4   33.0  91.4    -2.3    931  4.7
 16000    2.9  37.2   100    7    4   8.1   4.5   32.7  90.9    -2.7    883  4.5
 15500    4.1  39.4   095    7    4   9.0   4.9   32.5  90.5    -2.9    831  4.2
 15000    5.4  41.7   085    7    3   9.0   4.9   32.4  90.3    -3.1    777  3.9
 14500    6.7  44.1   075    6    3   8.6   4.7   32.2  90.0    -3.3    724  3.7
 14000    7.9  46.2   060    6    3   8.6   4.7   32.1  89.7    -3.5    671  3.4
 13500    9.2  48.6   045    6    3   8.0   4.4   31.9  89.4    -3.7    619  3.1
 13000   10.3  50.5   025    5    3   7.7   4.2   31.5  88.7    -4.1    571  2.9
 12500   11.4  52.5   005    5    3   7.7   4.2   31.2  88.2    -4.4    523  2.7
 12000   12.5  54.5   345    5    3   7.8   4.3   30.9  87.6    -4.8    474  2.4
 11500   13.7  56.7   330    6    3   7.2   4.0   30.6  87.0    -5.1    426  2.2
 11000   14.7  58.5   320    6    3   7.9   4.3   30.2  86.3    -5.6    379  1.9
 10500   16.4  61.5   310    6    3   6.8   3.7   29.7  85.4    -6.1    308  1.6
 10250   16.8  62.2   310    6    3   6.5   3.5   29.4  85.0    -6.4    286  1.5
 10000   17.3  63.1   310    6    3   6.7   3.7   29.2  84.5    -6.7    265  1.3
  9750   17.8  64.0   310    6    3   6.1   3.3   28.9  84.1    -6.9    243  1.2
  9500   18.1  64.6   305    6    3   4.8   2.6   28.6  83.5    -7.3    225  1.1
  9250   18.4  65.1   300    6    3   4.7   2.6   28.2  82.8    -7.8    208  1.1
  9000   18.8  65.8   300    6    3   5.0   2.7   27.8  82.1    -8.2    191  1.0
  8750   19.1  66.4   300    6    3   4.9   2.7   27.5  81.5    -8.6    173  0.9
  8500   19.5  67.1   295    6    3   4.7   2.6   27.1  80.8    -9.0    156  0.8
  8250   19.8  67.6   295    7    4   5.1   2.8   26.7  80.1    -9.4    139  0.7
  8000   20.2  68.4   290    7    4   5.8   3.2   26.4  79.5    -9.8    120  0.6
  7750   20.6  69.1   290    7    4   5.7   3.1   26.1  79.0   -10.1    100  0.5
  7500   21.0  69.8   295    6    3   5.1   2.8   25.8  78.4   -10.5     81  0.4
  7250   21.3  70.3   295    6    3   5.6   3.1   25.4  77.8   -10.9     62  0.3
  7000   21.7  71.1   295    6    3   4.3   2.4   25.1  77.2   -11.2     43  0.2
  6750   21.8  71.2   300    5    2  -4.0  -2.2   24.5  76.0   -11.9     34  0.2
  6500   20.9  69.6   325    3    2 -23.2 -12.7   22.8  73.0   -13.6     55  0.3

 * * * * * * Numerical weather prediction model forecast data valid * * * * * *

           07/26/2026 at 0900 MDT          |       07/26/2026 at 1200 MDT
                                           |
CAPE...   +83.6    LI...       -1.8        | CAPE...  +527.5    LI...       -2.2
CINH...  -106.1    K Index... +28.5        | CINH...   -13.4    K Index... +28.6
                                           |
Height Temperature  Wnd WndSpd  Lapse Rate | Temperature  Wnd WndSpd  Lapse Rate
ft MSL deg C deg F  Dir kt m/s  C/km F/kft | deg C deg F  Dir kt m/s  C/km F/kft
--------------------------------------------------------------------------------
 50000 -67.6 -89.7  095  20 10   3.5   1.9 | -67.8 -90.0  105  22 11   4.3   2.4
 45000 -59.6 -75.3  100  20 11   7.7   4.2 | -58.8 -73.8  100  20 10   7.3   4.0
 40000 -47.3 -53.1  100  11  6   8.3   4.5 | -47.4 -53.3  085  11  6   8.3   4.5
 38000 -42.4 -44.3  105  12  6   8.3   4.5 | -42.4 -44.3  105  12  6   8.3   4.5
 36000 -37.4 -35.3  115  12  6   8.0   4.4 | -37.5 -35.5  115  12  6   7.9   4.4
 34000 -32.6 -26.7  150   8  4   8.0   4.4 | -32.7 -26.9  140   8  4   7.9   4.4
 32000 -27.8 -18.0  185   9  5   7.7   4.2 | -28.0 -18.4  180   7  4   7.8   4.3
 30000 -23.2  -9.8  170   8  4   7.8   4.3 | -23.3  -9.9  165  10  5   7.8   4.3
 29000 -20.9  -5.6  165   8  4   7.8   4.3 | -20.9  -5.6  160  11  6   7.8   4.3
 28000 -18.7  -1.7  160   8  4   7.1   3.9 | -18.1  -0.6  160  11  6   7.3   4.0
 27000 -16.1   3.0  155   8  4   7.1   3.9 | -15.9   3.4  155  11  6   7.3   4.0
 26000 -14.0   6.8  155   8  4   7.1   3.9 | -13.7   7.3  155  10  5   7.3   4.0
 25000 -12.0  10.4  150   9  4   5.5   3.0 | -11.7  10.9  155  10  5   5.9   3.2
 24000 -10.4  13.3  150   9  4   5.6   3.1 | -10.0  14.0  155  10  5   6.0   3.3
 23000  -8.8  16.2  145   9  4   5.7   3.1 |  -8.2  17.2  150   9  5   6.0   3.3
 22000  -7.2  19.0  145   8  4   4.9   2.7 |  -6.6  20.1  145   8  4   5.2   2.8
 21000  -5.9  21.4  150   5  3   5.1   2.8 |  -5.1  22.8  135   6  3   5.4   2.9
 20000  -4.5  23.9  170   3  1   5.1   2.8 |  -3.6  25.5  120   5  3   5.5   3.0
 19500  -3.7  25.3  190   2  1   6.9   3.8 |  -2.9  26.8  105   4  2   5.7   3.1
 19000  -2.6  27.3  195   2  1   7.4   4.1 |  -2.1  28.2  080   4  2   5.7   3.2
 18500  -1.6  29.1  205   2  1   7.4   4.1 |  -1.3  29.7  060   4  2   5.8   3.2
 18000  -0.6  30.9  205   2  1   5.5   3.0 |  -0.5  31.1  050   5  3   6.0   3.3
 17500   0.2  32.4  200   1  1   5.7   3.1 |   0.4  32.7  045   5  3   6.0   3.3
 17000   1.1  34.0  190   1  1   6.4   3.5 |   1.3  34.3  040   6  3   6.9   3.8
 16500   2.1  35.8  155   2  1   6.8   3.7 |   2.4  36.3  045   5  3   7.4   4.1
 16000   3.0  37.4  135   2  1   7.2   4.0 |   3.4  38.1  045   5  3   7.7   4.2
 15500   4.2  39.6  125   3  2   9.0   4.9 |   4.6  40.3  050   5  3   8.7   4.8
 15000   5.5  41.9  115   4  2   8.9   4.9 |   5.9  42.6  055   4  2   8.6   4.7
 14500   6.8  44.2  105   5  2   9.3   5.1 |   7.1  44.8  060   4  2   9.1   5.0
 14000   8.2  46.8  095   5  2   9.3   5.1 |   8.5  47.3  065   4  2   9.1   5.0
 13500   9.6  49.3  085   5  3   8.8   4.8 |   9.8  49.6  065   3  2   8.6   4.7
 13000  10.8  51.4  065   5  3   8.6   4.7 |  11.0  51.8  060   2  1   8.5   4.6
 12500  12.1  53.8  050   5  3   8.2   4.5 |  12.3  54.1  050   2  1   8.2   4.5
 12000  13.3  55.9  040   5  3   8.0   4.4 |  13.4  56.1  350   1  1   7.9   4.3
 11500  14.4  57.9  025   5  3   8.9   4.9 |  14.6  58.3  310   2  1   8.7   4.8
 11000  16.2  61.2  010   6  3   7.7   4.2 |  16.2  61.2  290   4  2   7.0   3.8
 10500  17.1  62.8  360   6  3   6.0   3.3 |  17.3  63.1  285   5  3   8.9   4.9
 10250  17.6  63.7  355   6  3   6.6   3.6 |  17.9  64.2  280   6  3   8.9   4.9
 10000  18.0  64.4  355   7  3   6.7   3.7 |  18.6  65.5  280   6  3   8.8   4.9
  9750  18.5  65.3  350   7  4   5.9   3.2 |  19.2  66.6  275   6  3   9.1   5.0
  9500  18.8  65.8  350   7  4   4.3   2.4 |  19.9  67.8  275   6  3   9.6   5.2
  9250  19.1  66.4  350   7  3   4.2   2.3 |  20.6  69.1  275   6  3   9.6   5.3
  9000  19.4  66.9  350   7  4   4.4   2.4 |  21.3  70.3  270   7  3   9.5   5.2
  8750  19.7  67.5  350   7  4   4.6   2.5 |  22.0  71.6  270   7  4   9.7   5.3
  8500  20.0  68.0  350   7  3   4.5   2.4 |  22.8  73.0  270   7  4   9.8   5.4
  8250  20.3  68.5  345   6  3   5.8   3.2 |  23.5  74.3  270   7  4  10.0   5.5
  8000  20.9  69.6  340   6  3   8.0   4.4 |  24.2  75.6  265   7  4  10.1   5.6
  7750  21.5  70.7  340   6  3   9.0   5.0 |  25.0  77.0  265   7  4  10.4   5.7
  7500  22.2  72.0  335   6  3   9.6   5.3 |  25.8  78.4  265   7  4  10.7   5.9
  7250  22.9  73.2  335   6  3   9.2   5.0 |  26.6  79.9  265   7  4  10.5   5.7
  7000  23.6  74.5  330   5  3  10.2   5.6 |  27.4  81.3  265   7  4  11.2   6.1
  6750  24.5  76.1  325   5  3  15.0   8.3 |  28.4  83.1  260   7  4  18.7  10.3
  6500  25.9  78.6  320   5  2  23.3  12.8 |  30.6  87.1  260   7  4  45.7  25.1

           07/26/2026 at 1500 MDT          |       07/26/2026 at 1800 MDT
                                           |
CAPE...  +468.9    LI...       -1.9        | CAPE...  +275.6    LI...       -0.5
CINH...    -7.5    K Index... +33.7        | CINH...   -48.6    K Index... +30.5
                                           |
Height Temperature  Wnd WndSpd  Lapse Rate | Temperature  Wnd WndSpd  Lapse Rate
ft MSL deg C deg F  Dir kt m/s  C/km F/kft | deg C deg F  Dir kt m/s  C/km F/kft
--------------------------------------------------------------------------------
 50000 -68.2 -90.8  100  19 10   4.5   2.5 | -67.6 -89.7  090  19 10   4.1   2.2
 45000 -59.4 -74.9  100  17  9   7.5   4.1 | -58.9 -74.0  080  15  8   7.9   4.3
 40000 -47.2 -53.0  075  10  5   8.5   4.6 | -46.5 -51.7  050  12  6   7.9   4.3
 38000 -42.1 -43.8  090  10  5   8.5   4.7 | -41.8 -43.2  070  12  6   7.9   4.3
 36000 -37.2 -35.0  100   9  5   7.8   4.3 | -37.1 -34.8  085  12  6   7.5   4.1
 34000 -32.5 -26.5  095   5  3   7.8   4.3 | -32.6 -26.7  080   9  5   7.5   4.1
 32000 -27.8 -18.0  090   2  1   7.9   4.3 | -28.1 -18.6  075   6  3   8.0   4.4
 30000 -23.0  -9.4  165   5  3   7.9   4.3 | -23.3  -9.9  130   3  2   8.0   4.4
 29000 -20.7  -5.3  175   7  4   7.9   4.3 | -20.9  -5.6  165   4  2   8.0   4.4
 28000 -18.4  -1.1  175   9  5   7.3   4.0 | -18.5  -1.3  180   5  3   7.9   4.3
 27000 -15.6   3.9  180  10  5   7.3   4.0 | -15.6   3.9  190   6  3   7.9   4.3
 26000 -13.5   7.7  185  11  6   7.3   4.0 | -13.2   8.2  195   7  4   7.8   4.3
 25000 -11.4  11.5  185  11  6   6.0   3.3 | -11.0  12.2  200   8  4   7.1   3.9
 24000  -9.6  14.7  175  10  5   6.1   3.4 |  -8.9  16.0  200   8  4   7.1   3.9
 23000  -7.9  17.8  160   9  4   6.2   3.4 |  -6.7  19.9  200   8  4   7.1   3.9
 22000  -6.2  20.8  145   8  4   5.1   2.8 |  -4.9  23.2  195   7  4   4.9   2.7
 21000  -4.8  23.4  125   8  4   5.3   2.9 |  -3.4  25.9  170   5  3   5.3   2.9
 20000  -3.3  26.1  105   8  4   5.5   3.0 |  -2.0  28.4  125   5  3   5.6   3.1
 19500  -2.6  27.3  100   8  4   5.1   2.8 |  -1.3  29.7  110   6  3   5.0   2.8
 19000  -2.0  28.4  095   7  4   5.0   2.8 |  -0.7  30.7  110   6  3   4.7   2.6
 18500  -1.4  29.5  095   6  3   5.2   2.8 |  -0.1  31.8  110   7  3   4.6   2.5
 18000  -0.6  30.9  095   4  2   7.3   4.0 |   0.7  33.3  115   6  3   7.5   4.1
 17500   0.4  32.7  105   3  2   7.1   3.9 |   1.7  35.1  125   6  3   7.3   4.0
 17000   1.4  34.5  120   2  1   7.4   4.1 |   2.7  36.9  140   6  3   7.0   3.8
 16500   2.5  36.5  145   2  1   7.6   4.2 |   3.6  38.5  160   7  3   6.7   3.7
 16000   3.6  38.5  175   2  1   7.8   4.3 |   4.6  40.3  175   8  4   6.7   3.7
 15500   4.9  40.8  195   2  1   9.3   5.1 |   5.6  42.1  190   9  4   7.7   4.2
 15000   6.2  43.2  210   3  1   9.2   5.0 |   6.7  44.1  200  10  5   7.6   4.2
 14500   7.6  45.7  220   3  2   9.3   5.1 |   7.9  46.2  205  11  5   8.2   4.5
 14000   9.0  48.2  225   3  2   9.3   5.1 |   9.1  48.4  210  11  6   8.3   4.6
 13500  10.4  50.7  230   4  2   9.4   5.2 |  10.3  50.5  215  12  6   8.7   4.7
 13000  11.8  53.2  230   4  2   9.5   5.2 |  11.6  52.9  220  12  6   8.9   4.9
 12500  13.2  55.8  235   4  2   9.4   5.2 |  13.0  55.4  225  13  7   8.9   4.9
 12000  14.6  58.3  235   5  2   9.4   5.1 |  14.3  57.7  225  13  7   8.9   4.9
 11500  16.0  60.8  240   5  3   9.9   5.4 |  15.6  60.1  230  13  7   9.3   5.1
 11000  18.2  64.8  245   5  3   9.6   5.3 |  17.7  63.9  230  13  7   9.4   5.1
 10500  19.5  67.1  245   6  3   9.3   5.1 |  19.0  66.2  235  12  6   8.8   4.9
 10250  20.3  68.5  250   6  3   9.7   5.3 |  19.7  67.5  240  12  6   9.5   5.2
 10000  21.0  69.8  250   6  3   9.6   5.3 |  20.4  68.7  240  11  6   9.4   5.1
  9750  21.7  71.1  250   7  3   9.7   5.3 |  21.1  70.0  245  11  6   9.2   5.1
  9500  22.4  72.3  250   7  4   9.8   5.4 |  21.7  71.1  245  11  5   8.5   4.6
  9250  23.1  73.6  255   7  4   9.5   5.2 |  22.3  72.1  250  10  5   8.8   4.8
  9000  23.8  74.8  255   7  4   9.2   5.1 |  23.0  73.4  250  10  5   9.4   5.2
  8750  24.5  76.1  255   8  4   9.5   5.2 |  23.7  74.7  255   9  5   9.2   5.1
  8500  25.2  77.4  260   8  4  10.1   5.6 |  24.4  75.9  255   9  5   9.5   5.2
  8250  26.0  78.8  260   8  4   9.7   5.3 |  25.1  77.2  260   9  4   9.3   5.1
  8000  26.7  80.1  260   8  4   8.6   4.7 |  25.8  78.4  260   8  4   8.7   4.8
  7750  27.3  81.1  265   8  4   9.3   5.1 |  26.4  79.5  265   7  4   8.8   4.8
  7500  28.0  82.4  265   9  4  10.2   5.6 |  27.1  80.8  265   7  3   9.1   5.0
  7250  28.8  83.8  270   9  5  10.7   5.9 |  27.8  82.0  270   6  3   9.2   5.1
  7000  29.5  85.1  270   9  5   8.3   4.6 |  28.4  83.1  270   6  3   8.2   4.5
  6750  30.2  86.4  270   9  4  12.5   6.9 |  29.0  84.2  270   5  3   9.0   4.9
  6500  32.5  90.5  270   8  4  64.6  35.4 |  30.1  86.2  270   4  2  24.6  13.5
________________________________________________________________________________

This product is issued once per day, at approximately 730 AM local
time. It is not continuously monitored nor updated after its initial
issuance.

The information contained herein is based on numerical weather prediction
model data for the Santa Fe County Municipal Airport site in Santa Fe, New Mexico at

                   North Latitude: 35.61097 deg
                   West Longitude: 106.61097 deg
                   Elevation: 6279.5 feet (1936.0 meters)

and may not be representative of other areas along and east of the Sandia
and Manzano Mountains. Note that some elevations in numerical weather
prediction models differ from actual station elevations, which can lead to
data which appear to be below ground.  Erroneous data such as these should
not be used.

The content and format of this report as well as the issuance times are subject
to change without prior notice.  Comments are welcome and should be directed
to one of the addresses or phone numbers shown at the bottom of this page.

DEFINITIONS:

CAPE (Convective Available Potential Energy) - An integrated measure of the
     energy available for convective development, also known as the positive
     area on a thermodynamic diagram.  Units are Joules per kilogram.  Larger
     values are indicative of greater instability and the possibility of
     stronger convective activity, including thunderstorms.  Values around or
     greater than 1000 suggest the possibility of severe weather should
     convective activity develop.

CINH (Convective Inhibition) - An integrated measure of the amount of energy
     needed to initiate convective activity, also known as the negative area on
     a thermodynamic diagram.  Units are Joules per kilogram.  The more negative
     this number, the more energy is required to initiate convection.  This
     inhibitive energy can be overcome through surface heating, cooling aloft,
     lifting mechanisms (orographic, frontal, gravity waves, etc.)

Convective Condensation Level - The height to which an air parcel possessing the
     average saturation mixing ratio in the lowest 4000 feet of the airmass,
     if heated sufficiently from below, will rise dry adiabatically until it
     just becomes saturated.  It estimates the base of cumulus clouds that are
     produced by surface heating only.

Convection Temperature (ConvectionT) - The surface temperature required to make
     the airmass dry adiabatic up to the given level.  It can be considered a
     "trigger temperature" for that level.

Freezing Level - The height where the temperature is zero degrees Celsius.

Height of Stable Layer - The height (between 12,000 and 18,000 feet above
     mean sea level) where the smallest lapse rate exists.  The location and
     existence of this feature is important in the generation of mountain
     waves.

K Index - A measure of stability which combines the temperature difference
     between approximately 5,000 and 18,000 feet above the surface, the amount
     of moisture at approximately 5,000 feet above the surface, and a measure
     of the dryness at approximately 10,000 feet above the surface.  Larger
     positive numbers indicate more instability and a greater likelihood of
     thunderstorm development.  One interpretation of K index values regarding
     soaring in the western United States is given in WMO Technical Note 158
     and is reproduced in the following table:

          below -10    no or weak thermals
           -10 to 5    dry thermals or 1/8 cumulus with moderate thermals
            5 to 15    good soaring conditions
           15 to 20    good soaring conditions with occasional showers
           20 to 30    excellent soaring conditions, but increasing
                       probability of showers and thunderstorms
           above 30    more than 60 percent probability of thunderstorms

Lapse Rate - The change with height of the temperature. Negative values indicate
     inversions.

Lifted Condensation Level - The height to which an air parcel possessing the
     average dew point in the lowest 4000 feet of the airmass and the forecast
     maximum temperature must be lifted dry adiabatically to attain saturation.

Lifted Index (LI) - The difference between the environmental temperature at a
     level approximately 18,000 feet above the surface and the temperature of
     an air parcel lifted dry adiabatically from the surface to its lifted
     condensation level and then pseudoadiabatically thereafter to this same
     level.  The parcel's initial temperature is the forecast maximum
     temperature and its dew point is the average dew point in the lowest 4000
     feet of the airmass.  Negative values are indicative of instability with
     positive values showing stable conditions.

Lift Rate - An experimental estimate of the strength of thermals.  It is
     computed the same way as the maximum rate of lift but uses the actual
     level rather than the maximum height of thermals in the calculation.
     Also, none of the empirical adjustments based on cloudiness and K-index
     are applied to these calculations.

Maximum Height of Thermals - The height where the dry adiabat through the
     forecast maximum temperature intersects the environmental temperature.

Maximum Rate of Lift - An estimate of the maximum strength of thermals.  It
     is computed from an empirical formula which combines the expected maximum
     height of thermals with the difference in the environmental temperatures
     between the maximum height of thermals and the temperature 4,000 feet
     above the ground.  After this computation, further empirical adjustments
     are made based on the value of the K-index and the amount and opacity of
     middle and high level cloudiness expected between the time of trigger
     temperature and the time of overdevelopment.

Middle/High Clouds - The amount and opacity of middle (altostratus, altocumulus)
     or high (cirrus, cirrostratus, cirrocumulus) clouds.  Broken means that
     between 60% and 90% of the sky is covered by the cloud, with overcast
     conditions occurring when more than 90% of the sky is covered by the cloud.
     Thin implies that the clouds are predominantly transparent, meaning that
     some sunlight is reaching the ground, in contrast to opaque which suggests
     that little sunlight is reaching the ground.

Potential Height of Wave - The minimum of the following two heights:
     1. Level above the height of stable layer (or 14,000 feet if none exists)
        where the wind direction changes by 30 degrees or more
     2. Level above the height of stable layer (or 14,000 feet if none exists)
        where the wind speed no longer increases with height

PVA/NVA - Positive vorticity advection (PVA)/negative vorticity advection (NVA)
     on the 500 millibar isobaric surface (approximately 18,000 feet above mean
     sea level).  Weak PVA has been shown to assist in mountain wave soaring.

Soaring Window - The time between the time the trigger temperature is reached
                 and the time of overdevelopment.

Thermal Index - The difference between the environmental temperature and the
     temperature at a particular level determined by following the dry adiabat
     through the forecast maximum temperature up to that level.  Negative values
     are indicative of thermal lift.

Thermal Soaring Index - An adjective rating (for sailplanes) based on the
     computed maximum rate of lift, and the wind speed and middle and high
     cloud cover expected during the soaring window (the time of the trigger
     temperature and the time of overdevelopment) according to the following:

                 Maximum rate of lift        Adjective Rating
                      >= 800 fpm                 Excellent
                 >= 400 and < 800 fpm              Good
                 >= 200 and < 400 fpm              Fair
                       < 200 fpm                   Poor

Time of Overdevelopment - The time one or more of the following phenomena,
     which essentially shut off thermal lift, is expected to occur:
     1. formation of broken to overcast convective cloud cover
     2. formation of scattered to numerous downbursts
     3. initiation of widespread precipitation

Time of Trigger Temperature - The time the surface temperature is expected to
     reach the trigger temperature.

Trigger Temperature - The surface temperature required to make the first 4000
     feet of the atmosphere dry adiabatic.

Wave Soaring Index - An empirical, adjective rating (for sailplanes) which
     attempts to combine a variety of phenomena important in mountain wave
     soaring into a single index number.  Objective points are assigned to
     these phenomena: wind speed and direction at 14,000 ft MSL, the static
     stability in the 12,000-18,000 ft MSL layer, the wind speed gradient above
     the stable layer, jet stream location and frontal and upper trough
     movements.

042613
Albuquerque (KABX) Radar Velocity Azimuth Display Wind Profile (Observed) |
Albuquerque Vertical Wind Profile (Forecast from Rapid Refresh Model)Lowest 2000 ft Above Ground LevelVertical Wind Profile (for lowest 2000 ft) |
Albuquerque Vertical Wind Profiler at Double Eagle Airport (Real-time observations)Note: The Wind Profiler is moved to Balloon Fiesta Park during Balloon FiestaDouble Eagle (Albuquerque) Vertical Wind Profiler |
|
Map of Surface Observations (Including Winds) Once the map is loaded, click on an observation site for more details. |
|
Phone Numbers for Up-to-the-Minute Airport Observations |
|---|
|
This is a nationwide information resource from NOAA
AIRMETs, SIGMETs, TURBC, ICG, PIREPs, flight-level winds, CCFP/CAWS and more
Regional perspective of aviation weather forecasts and data
Diagram showing the relative frequency of wind direction and speed each airport