
Severe thunderstorms capable of large hail and damaging wind gusts appear possible over the central and southern High Plains and eastern Kansas into Missouri Friday afternoon and evening. Rounds of storms Friday ahead of a slow moving frontal boundary will bring locally heavy rainfall and scattered flash flooding potential to the Mid-Mississippi, Ohio, and Tennessee Valleys, and the Appalachians. Read More >
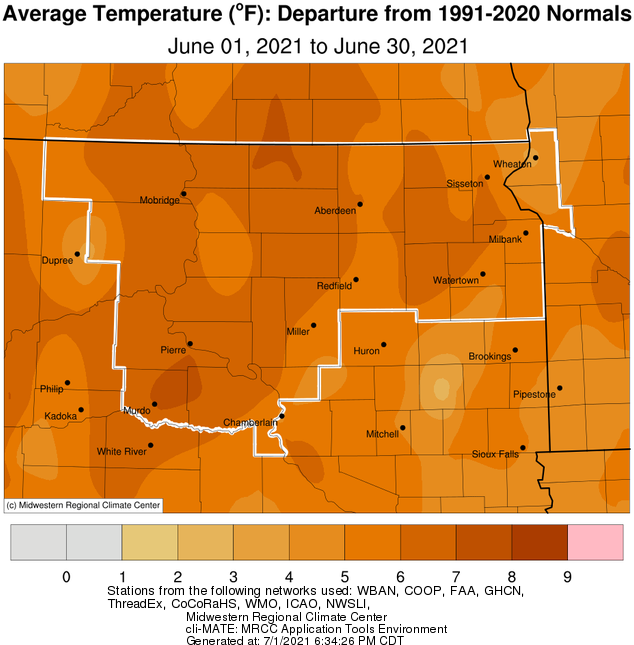
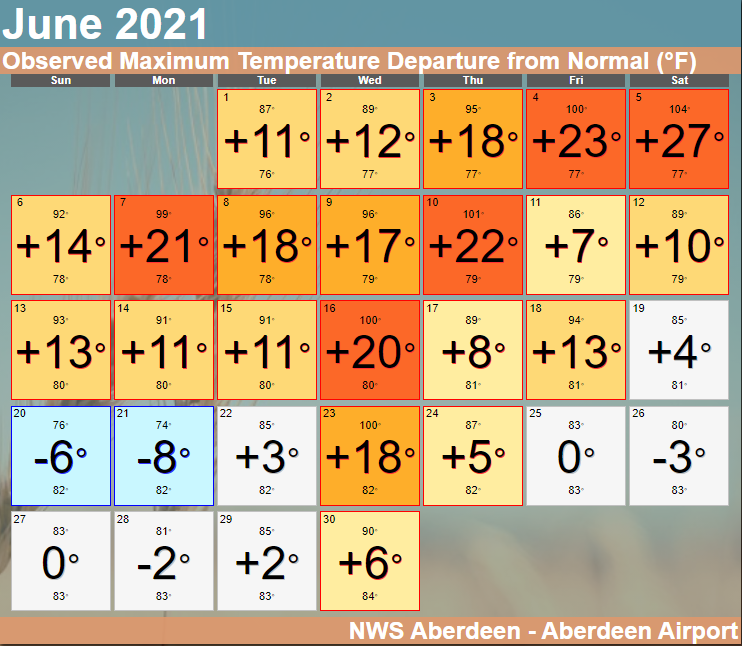
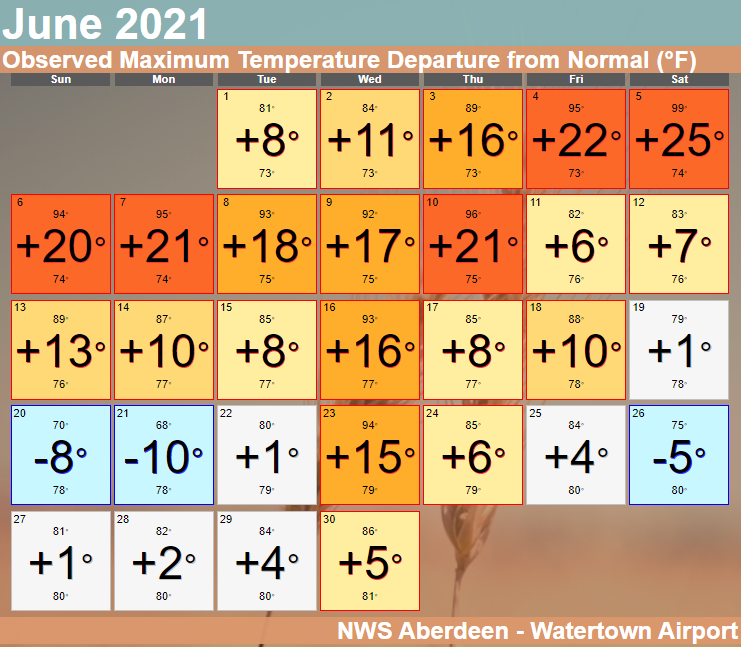
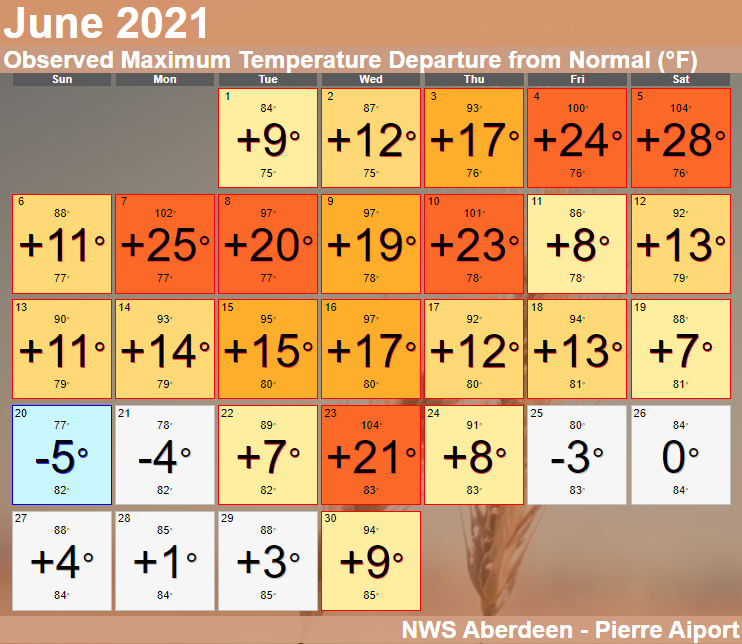
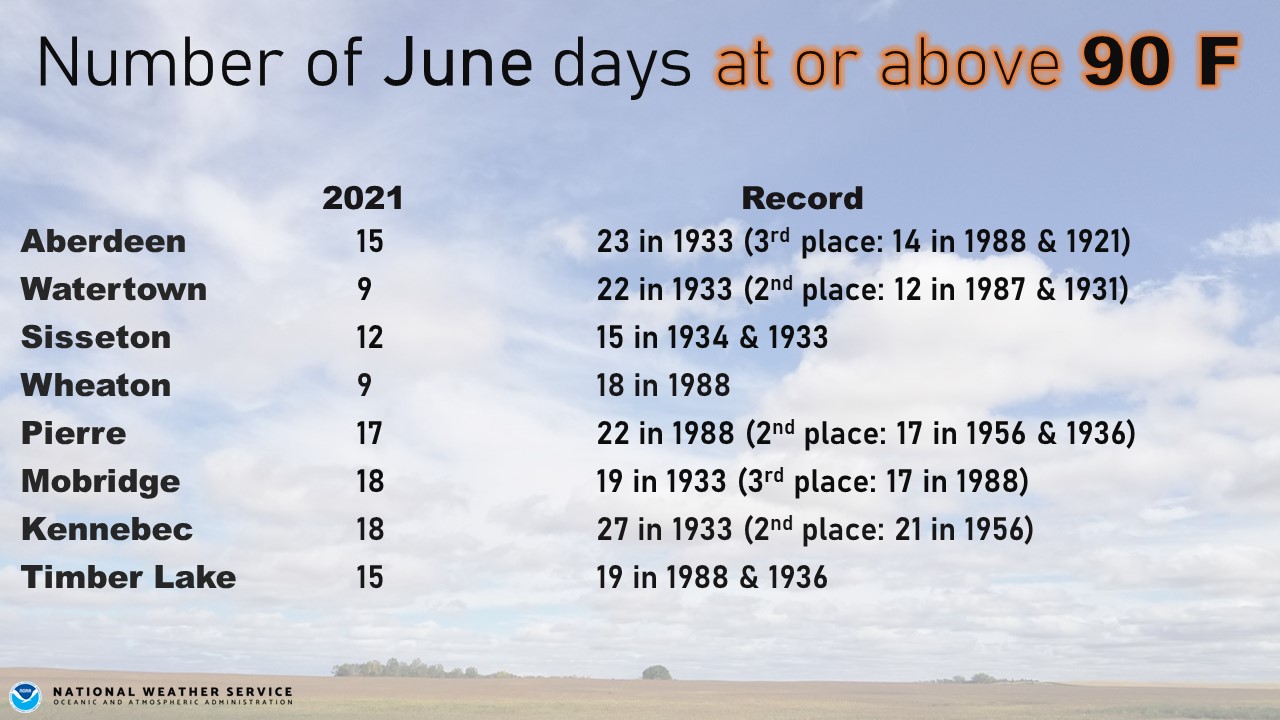
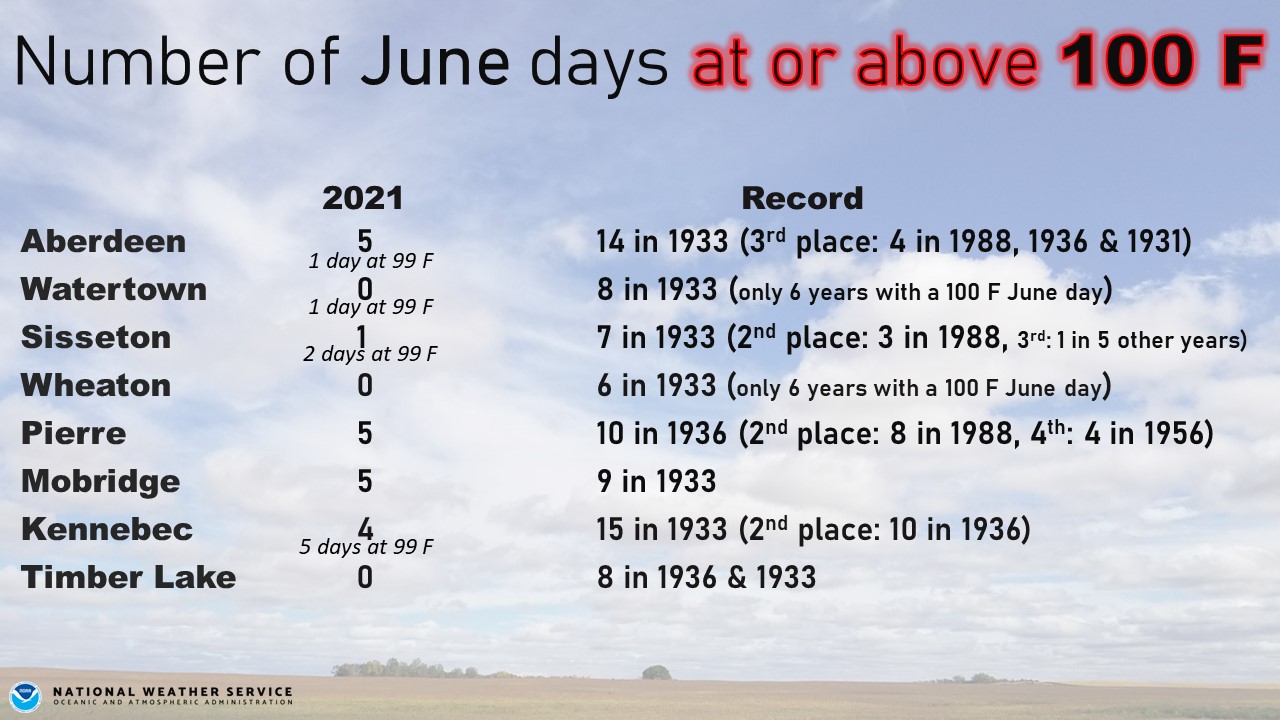
Most locations recorded their hottest June in over 30 years (1988). With average temperatures anywhere from 4 to 7 degrees above normal, June 2021 will go down as the 7th warmest on record at Wheaton, 6th warmest at Mobridge, the 5th warmest at Aberdeen and Kennebec, 4th at Watertown, Pierre and Timber Lake, and the 3rd at Sisseton. Many locations recorded 10 to 20 days with highs at or above 90 degrees, and up to 5 days at or above 100 (at least one 100 degree June day occurs on average every 2.5 years in Pierre, 5 years in Aberdeen and Mobridge, 12.5 years in Sisseton and 20 years in Watertown). Numerous record daily warm low and high temperatures were set as well, particularly from the 3-10th, including highs during 5 out of 6 days in Mobridge from the 3rd through the 8th.
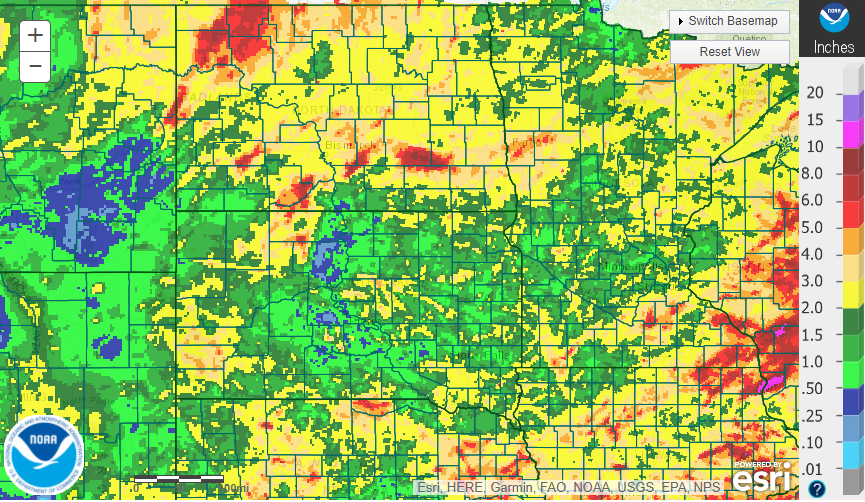
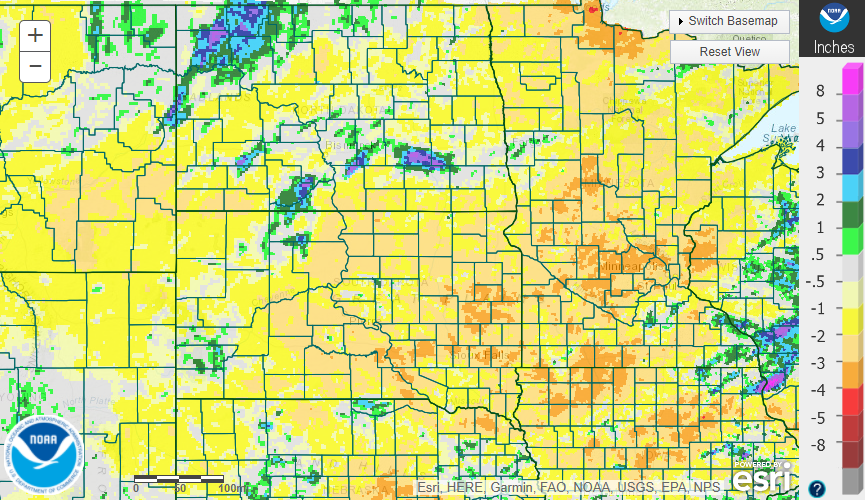
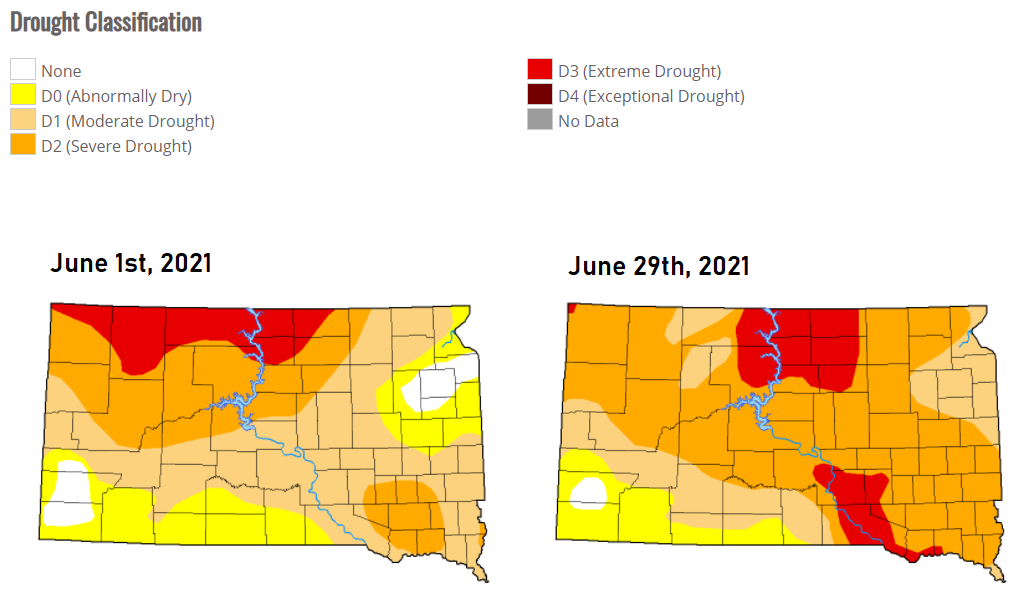
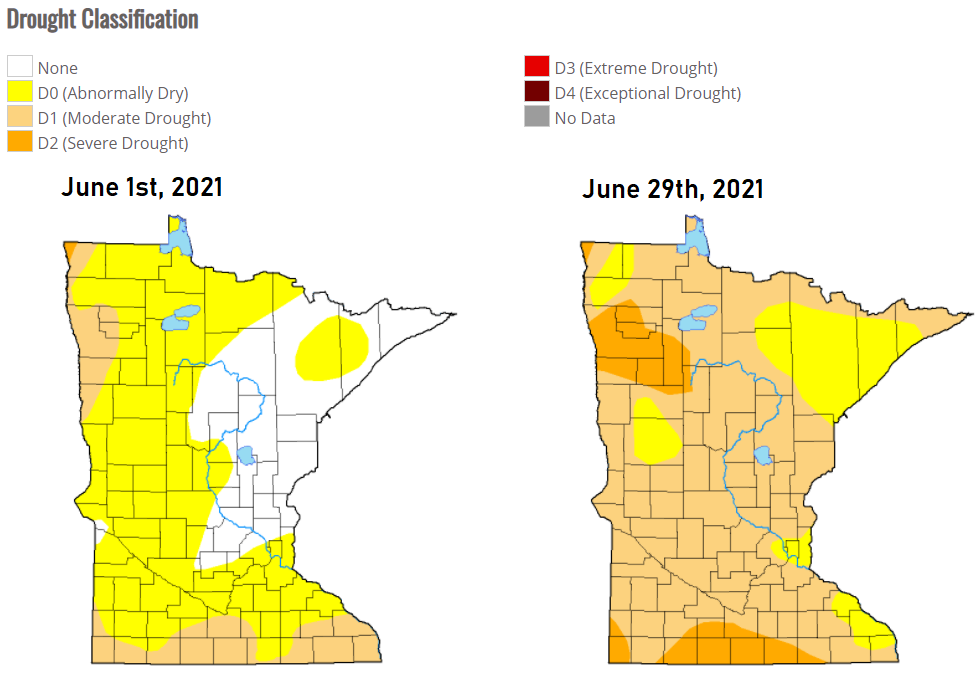
The heat was in part a testament to just how dry it’s been, both leading up to and also throughout the month. During times of drought, air holds less moisture, and is thus able to heat up faster and to a greater extent. The large-scale weather pattern involved a jet stream that was displaced further north than usual (more typical of July). This meant limited opportunities for quality or widespread storms and rainfall during a time of the year that is typically the wettest on average, climatologically speaking. Aside from fairly isolated pockets, the area ranged from 2 to 3.5 inches below normal for precipitation. This June will go down as the 6th driest on record in Sisseton, 5th driest in Aberdeen, 4th in Pierre, 3rd in Kennebec, and tied 2nd at both Watertown and Mobridge. Drought conditions worsened from the 1st to the 30th for the majority of central and northeastern South Dakota and west central Minnesota as a result. Fire weather became increasingly concerning as fuels further dried out.
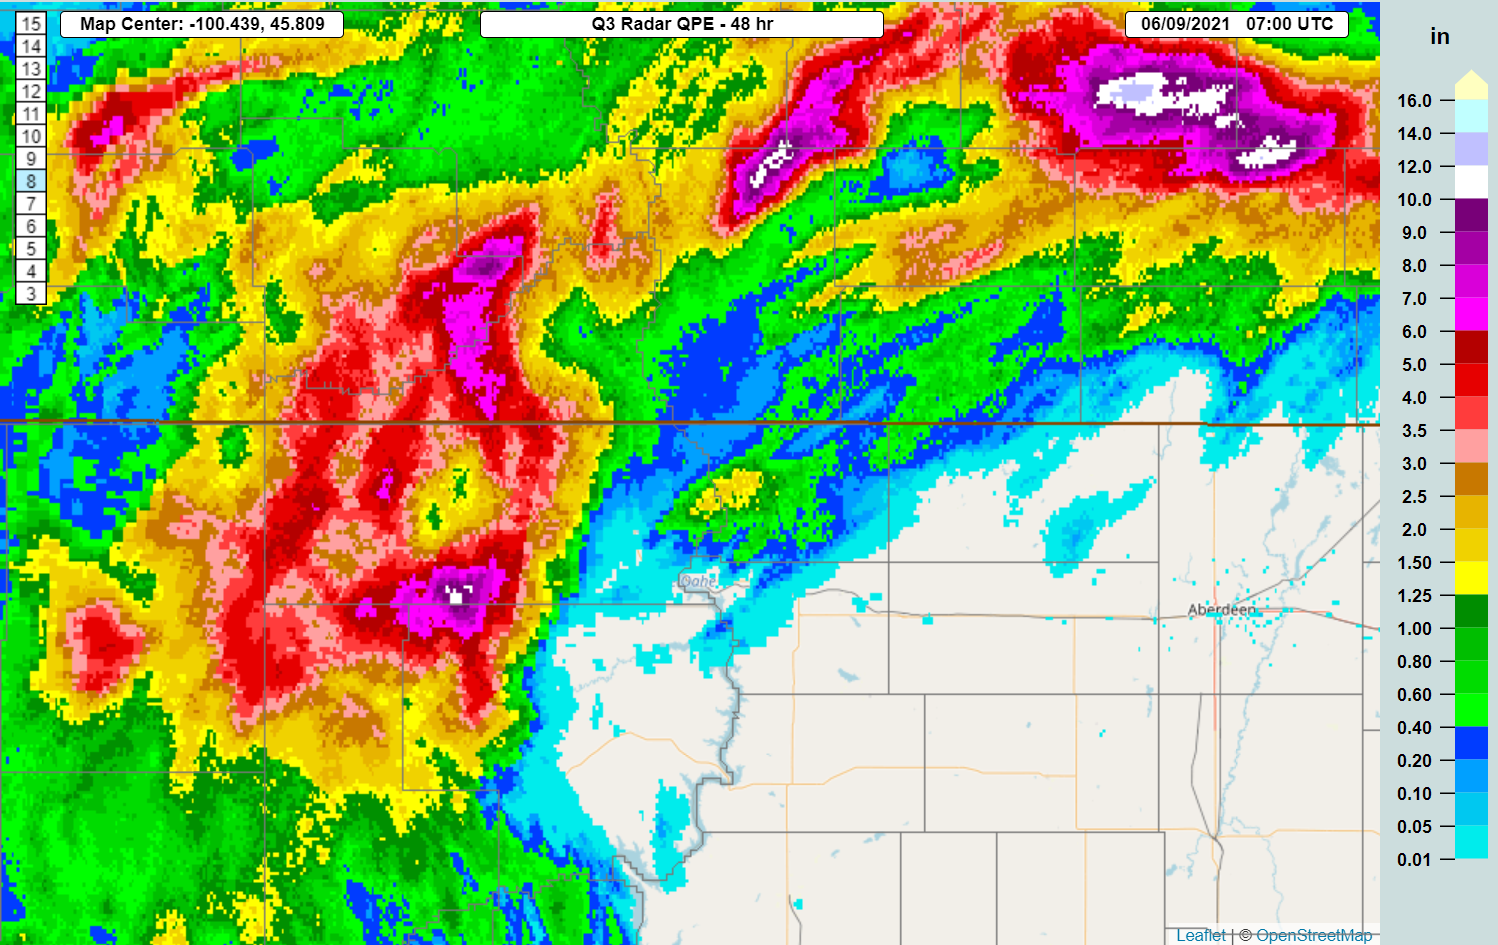
The drought also meant a reduction in severe weather across the area. The NWS office in Aberdeen issued 35 severe thunderstorm warnings across our forecast area this June, and all from the 7-14th (the average since 1986 is 51). That said, there were a couple events of note. A complex of storms developed and back-built generally from southeastern North Dakota into north central South Dakota from June 7th into the 8th. Large hail, damaging winds, a couple tornadoes and flash flooding (10.35” of rain measured near Firesteel) resulted across north central South Dakota. Additionally, a line of intense thunderstorms raced across the area on the night of June 10th, leading to winds with gusts up to 80 mph. The result was uprooted trees, severe damage to barns and outbuildings, rolled trailers and more, particularly across portions of northern South Dakota.
|
June 2021 |
||||
|
Temperature Data |
Aberdeen |
Sisseton |
Wheaton |
Watertown |
|
Warmest Temperature / Date |
104 / 5th |
101 / 5th |
98 / 5th |
99 / 5th |
|
Coldest Temperature / Date |
44 / 21st |
45 / 1,21,22 |
46 / 21, 22nd |
43 / 21st |
|
Average High / Departure from Normal |
90.0 / +9.8 |
88.0 / +9.6 |
84.2 / +6.0 |
85.9 / +9.1 |
|
Average Low / Departure from Normal |
57.0 / +1.9 |
58.7 / +2.7 |
60.2 / +1.6 |
58.1 / +2.7 |
|
Monthly Average / Departure from Normal |
73.5 / +5.9 |
73.3 / +6.1 |
72.2 / +3.8 |
72.0 / +5.9 |
|
Precipitation Data |
|
|
|
|
|
Monthly Precipitation / Departure from Normal |
0.77 / -2.99 |
1.11 / -2.39 |
1.98 / -2.24 |
0.65 / -3.20 |
|
Most Precipitation in 24 hours / Date |
0.45 / 11th |
0.21 / 11,27th |
0.40 / 15,28th |
0.46 / 11th |
|
Monthly Snowfall / Departure from Normal |
0.0 / +0.0 |
0.0 / +0.0 |
0.0 / +0.0 |
0.0 / +0.0 |
|
Most Snow in 24 hours / Date |
N/A |
N/A |
N/A |
N/A |
|
Temperature Data |
Pierre |
Kennebec |
Mobridge |
Timber Lake |
|
Warmest Temperature / Date |
104 / 5, 23rd |
104 / 23rd |
103 / 5, 23rd |
98 / 5th |
|
Coldest Temperature / Date |
45 / 21, 22nd |
44 / 22nd |
44 / 21st |
45 / 21st |
|
Average High / Departure from Normal |
91.3 / +11.3 |
92.5 / +10.1 |
90.9 / +10.8 |
88.2 / +9.5 |
|
Average Low / Departure from Normal |
58.0 / +2.4 |
58.2 / +2.6 |
57.4 / +1.7 |
57.3 / +3.4 |
|
Monthly Average / Departure from Normal |
74.6 / +6.8 |
75.3 / +6.3 |
74.2 / +6.3 |
72.7 / +6.4 |
|
Precipitation Data |
|
|
|
|
|
Monthly Precipitation / Departure from Normal |
0.53 / -3.16 |
0.65 / -2.83 |
0.38 / -2.70 |
2.56 / -1.0 |
|
Most Precipitation in 24 hours / Date |
0.29 / 9th |
0.35 / 20th |
0.09/9,11,25 |
2.01 / 9th |
|
Monthly Snowfall / Departure from Normal |
0.0 / +0.0 |
0.0 / +0.0 |
0.0 / +0.0 |
0.0 / +0.0 |
|
Most Snow in 24 hours / Date |
N/A |
N/A |
N/A |
N/A |
June 2021's average temperature's departure from normal, courtesy of the Midwestern Regional Climate Center
Calendar day high temperature departures (large number) as well as high temperatures (small top number) and average high temperatures (small bottom number) for Aberdeen, Watertown and Pierre, in that order.
Number of days this June in the 90s and 100s, and perspective.
Estimated rainfall totals across the region during June, from water.weather.gov.
Estimated rainfall departures across the region during June, from water.weather.gov.
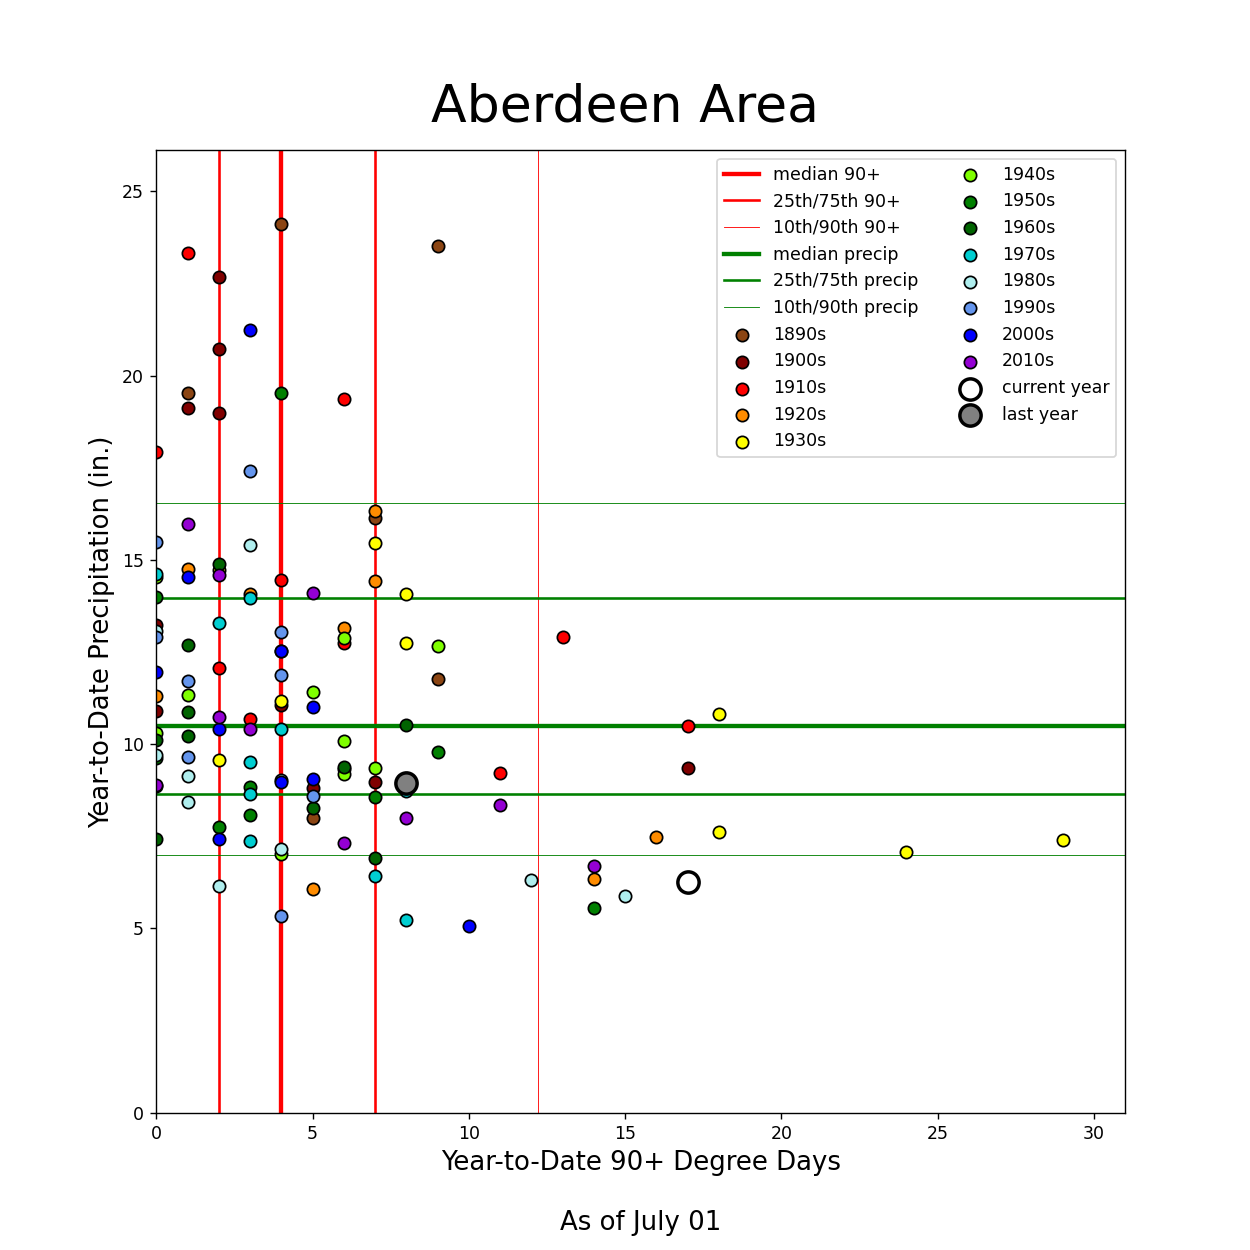
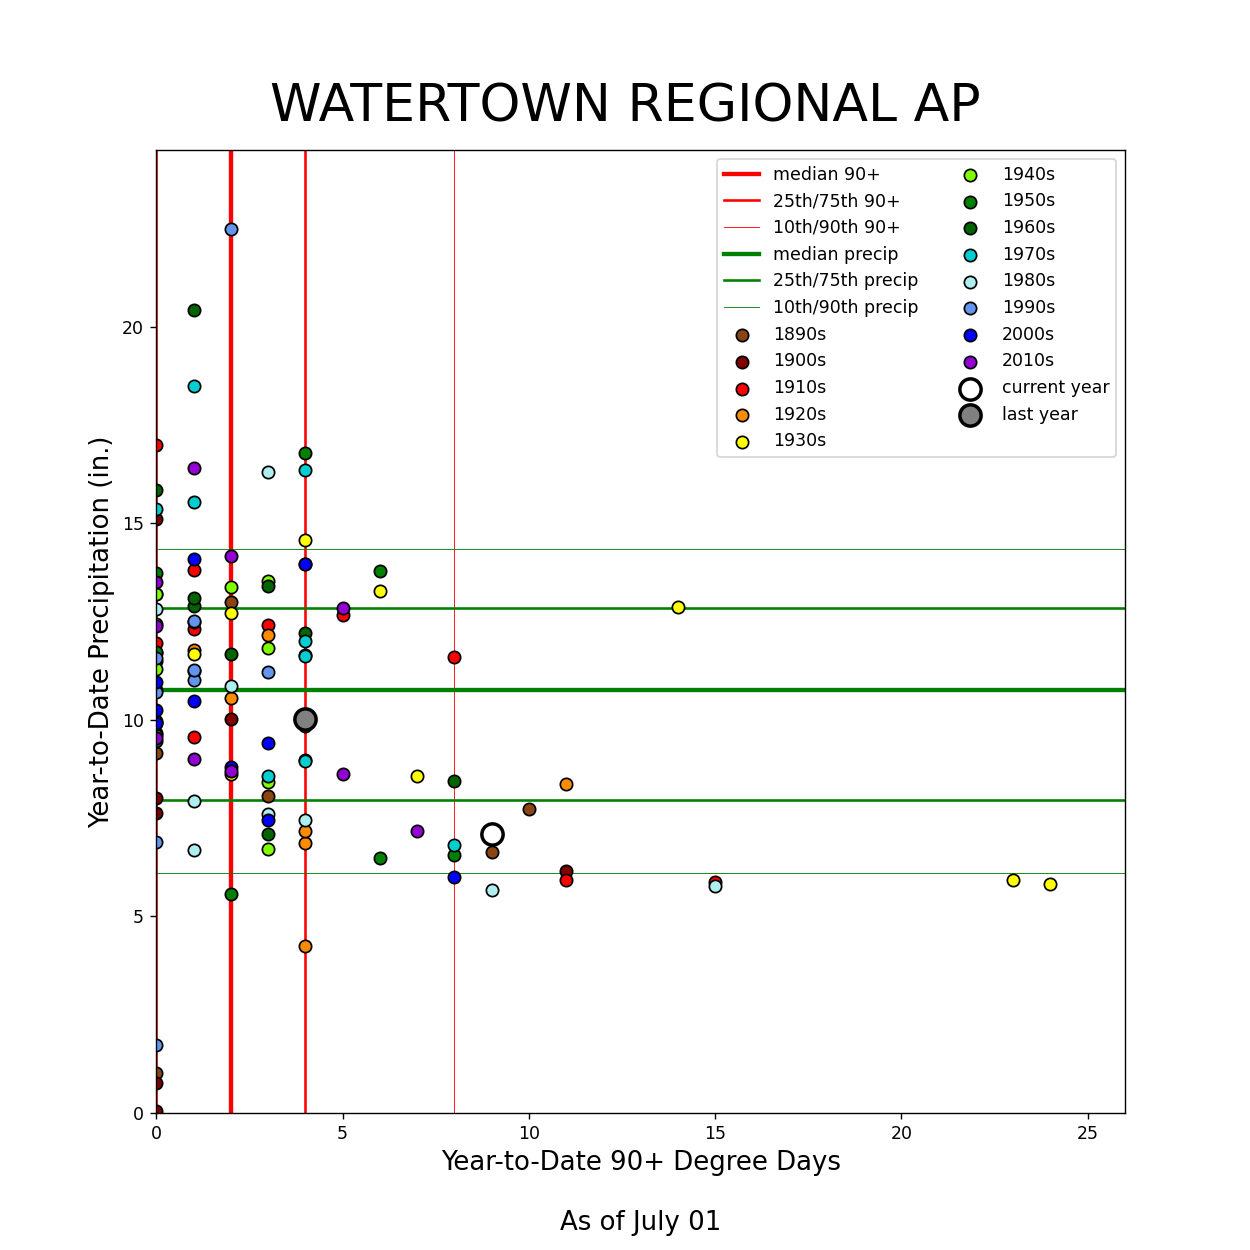
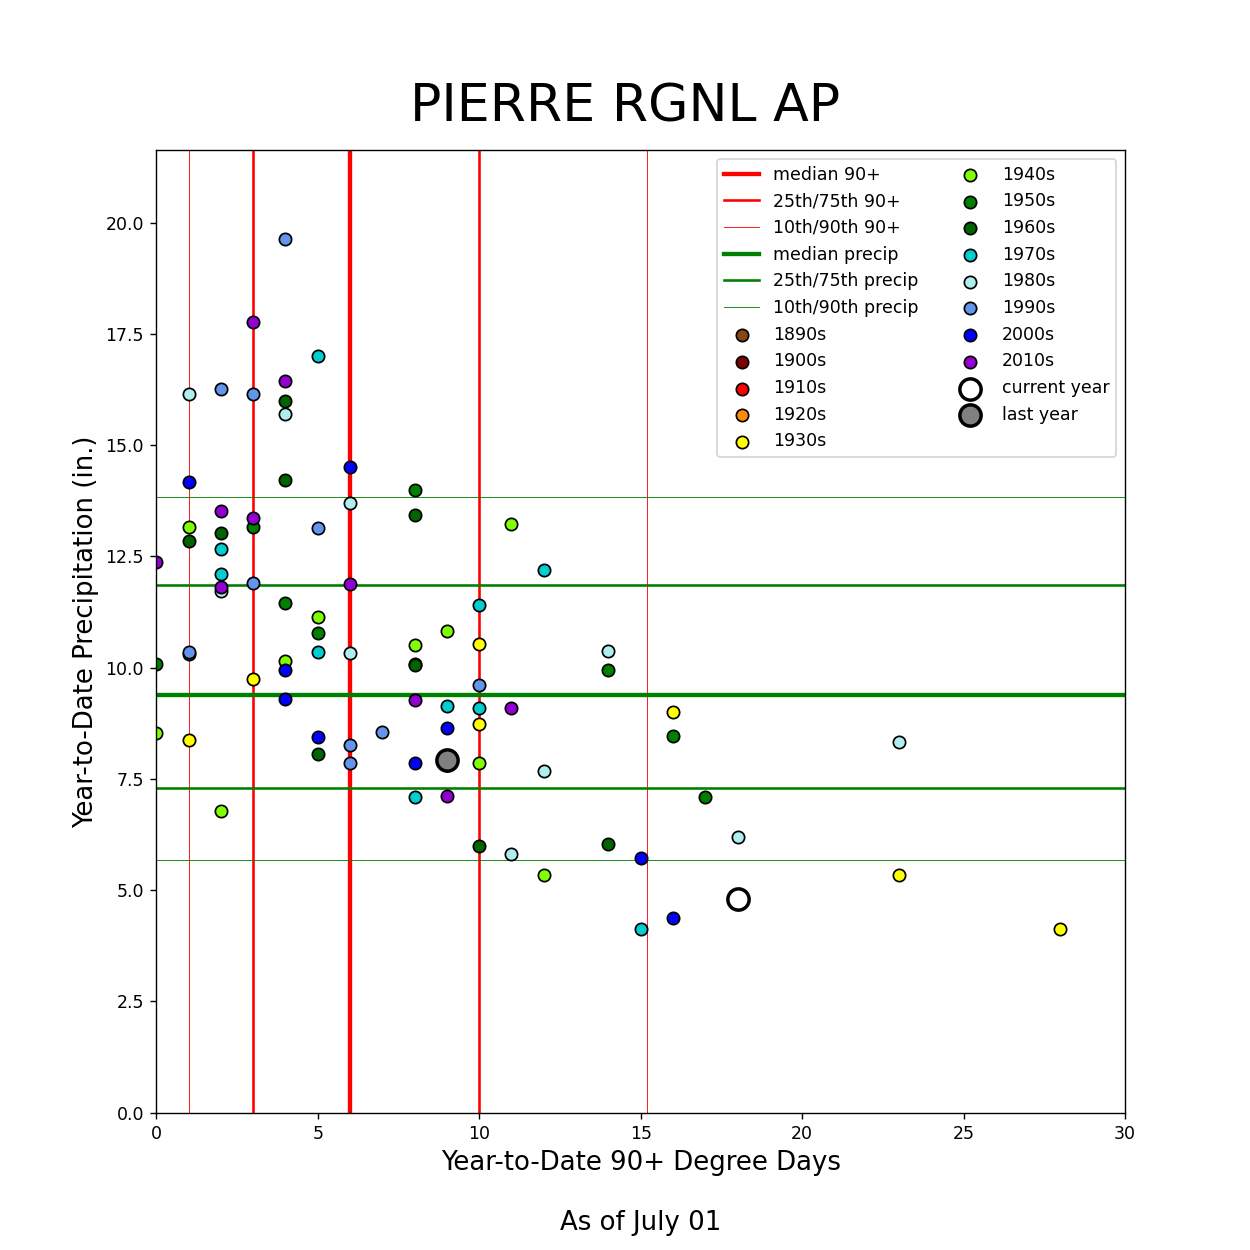
Year-to-date information (as of July 1) regarding number of 90+ degree days (horizontal axis) and precipitation totals (vertical axis), as plotted as a large white dot with respect to other years in the database for Aberdeen, Watertown and Pierre in that order. This information for additional cities can be found here.
A comparison of the US Drought Monitor from the beginning to end of June 2021.
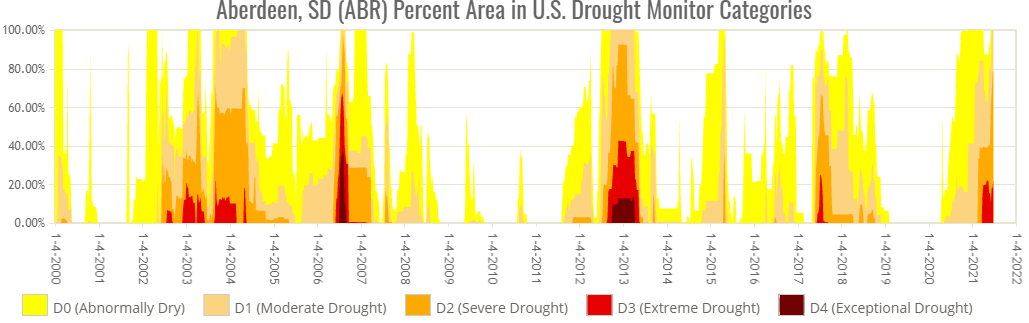
Looking at the US Drought Monitor another way, we can try to put the area's current drought in context to other droughts in relatively recent history (since 2000) in terms of coverage (not necessarily impact due to timing differences). This graphic shows the percent of the Aberdeen, SD National Weather Service's forecast area under drought and that drought's level of severity.
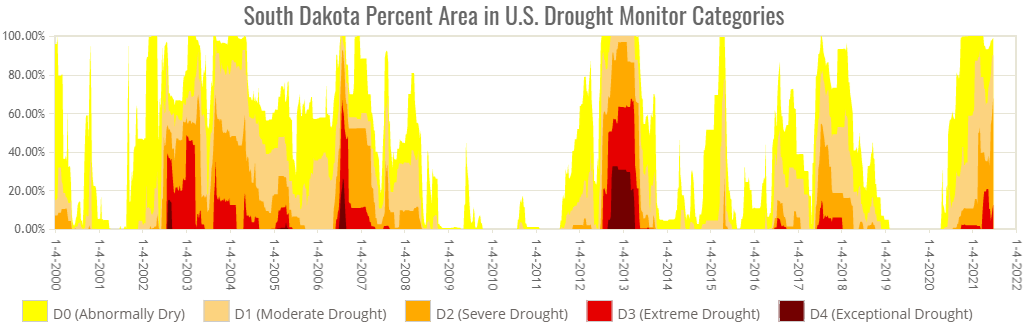
Same as above, but across the state of South Dakota.
Estimated rainfall amounts from June 7-8th.
Number of severe thunderstorm warnings issued by the NWS office in Aberdeen, SD by month since 1986, highlighting the slow start to the severe weather season across this part of the country. Data courtesy of the Iowa Environmental Mesonet. 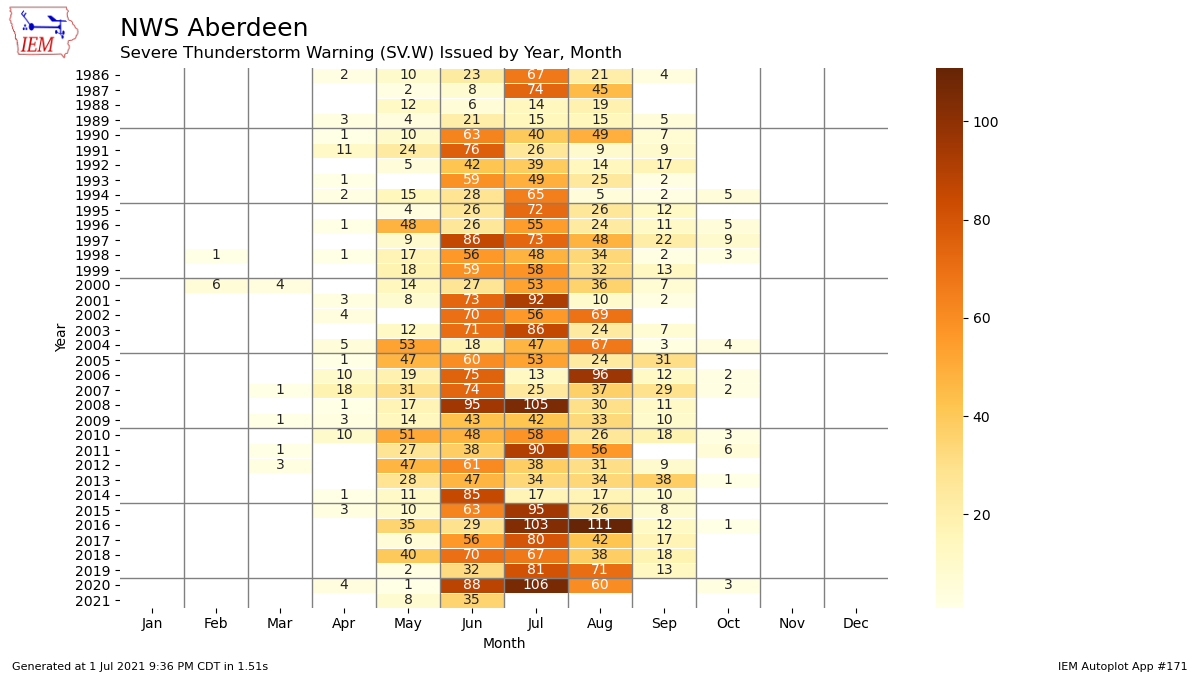
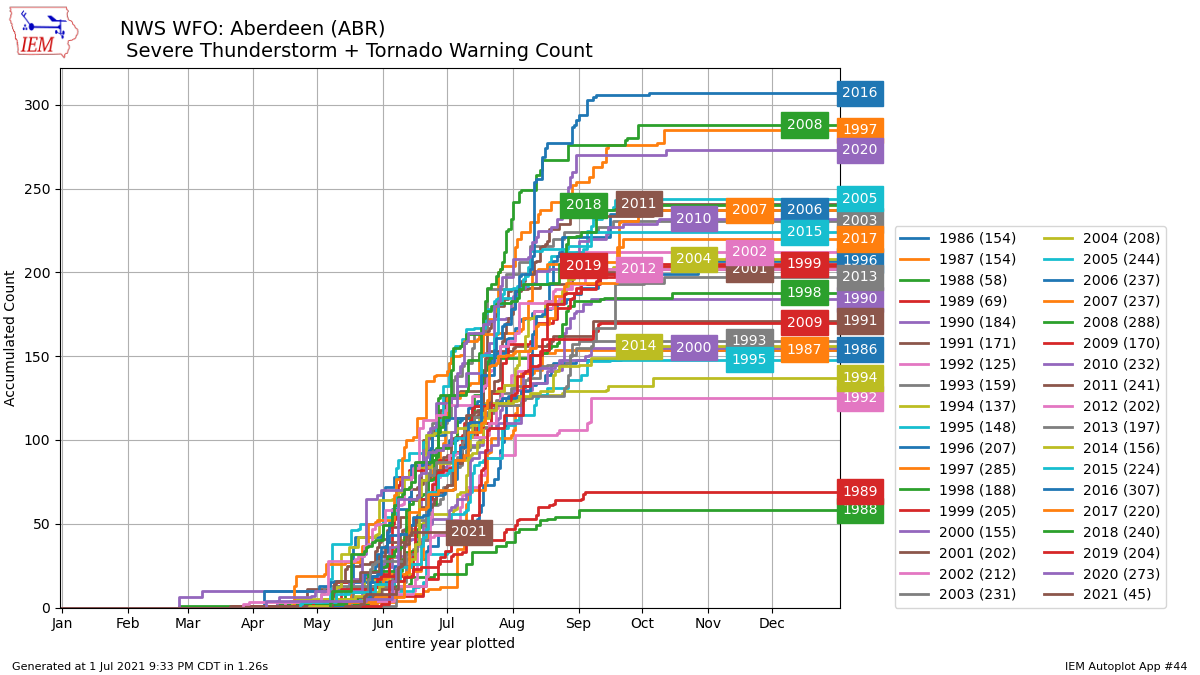
Number of combined severe thunderstorm and tornado warnings issued by the NWS office in Aberdeen, SD by year since 1986, highlighting the slow start to the severe weather season across this part of the country. Data courtesy of the Iowa Environmental Mesonet.

