Tropical Storm Bertha could bring tropical storm conditions to portions of the Florida Panhandle and Alabama coast through Wednesday, where a Tropical Storm Watch and Storm Surge Watch is in effect. Numerous severe thunderstorms with heavy rainfall are expected from the Ohio Valley into the Mid-Atlantic and Northeast Tuesday. Read More >
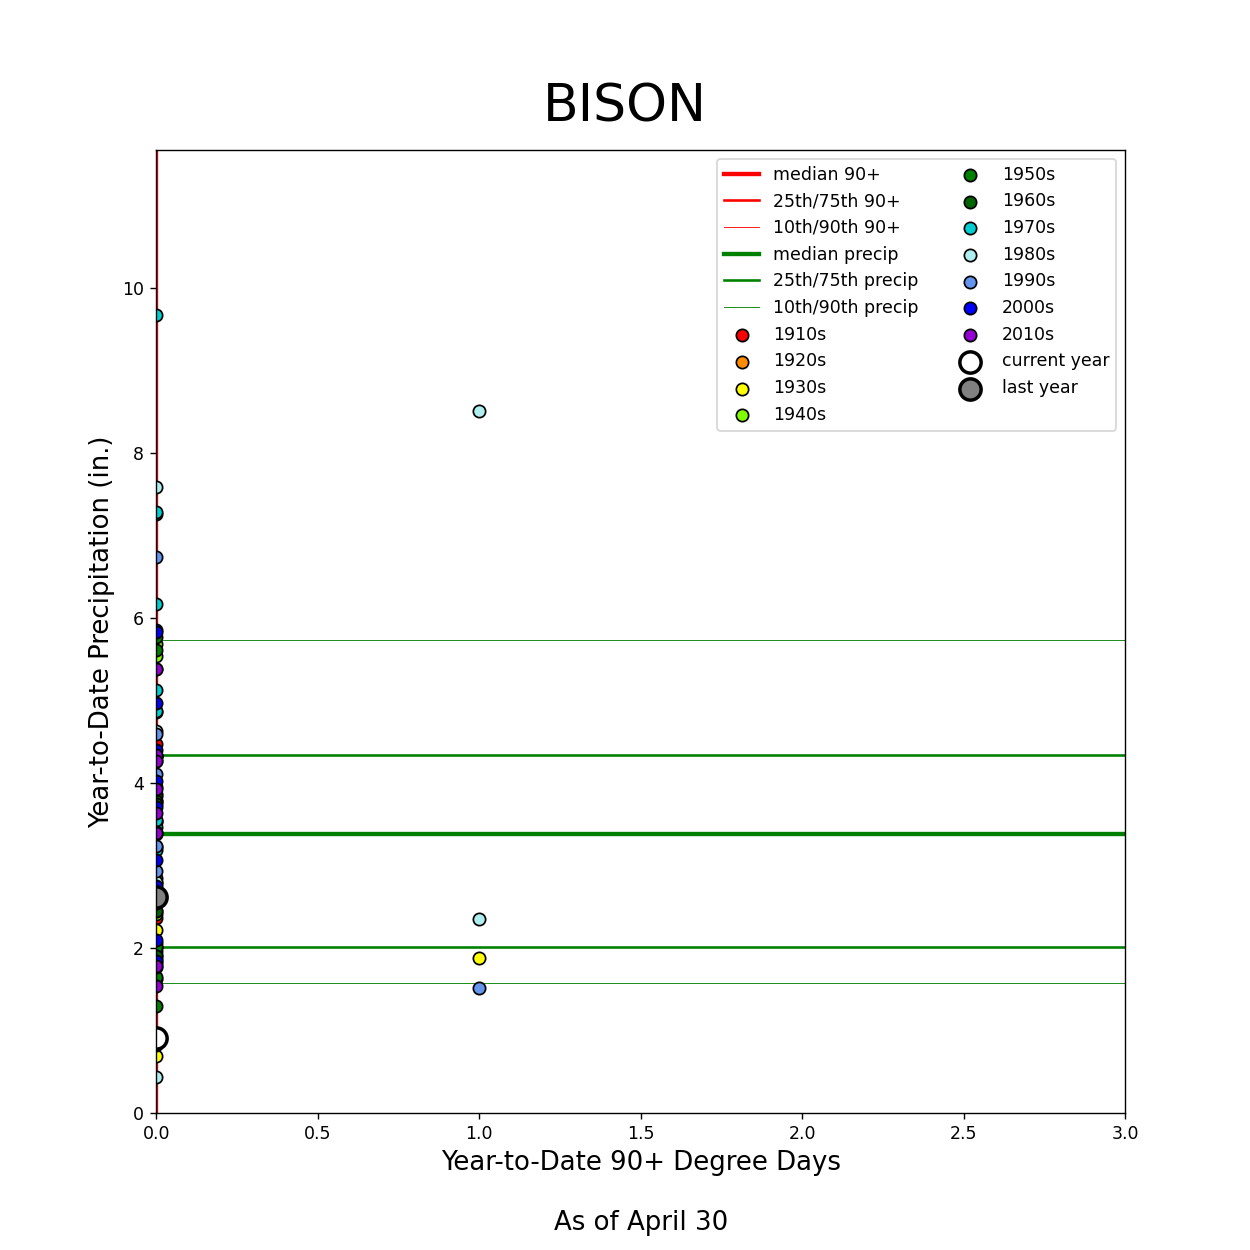
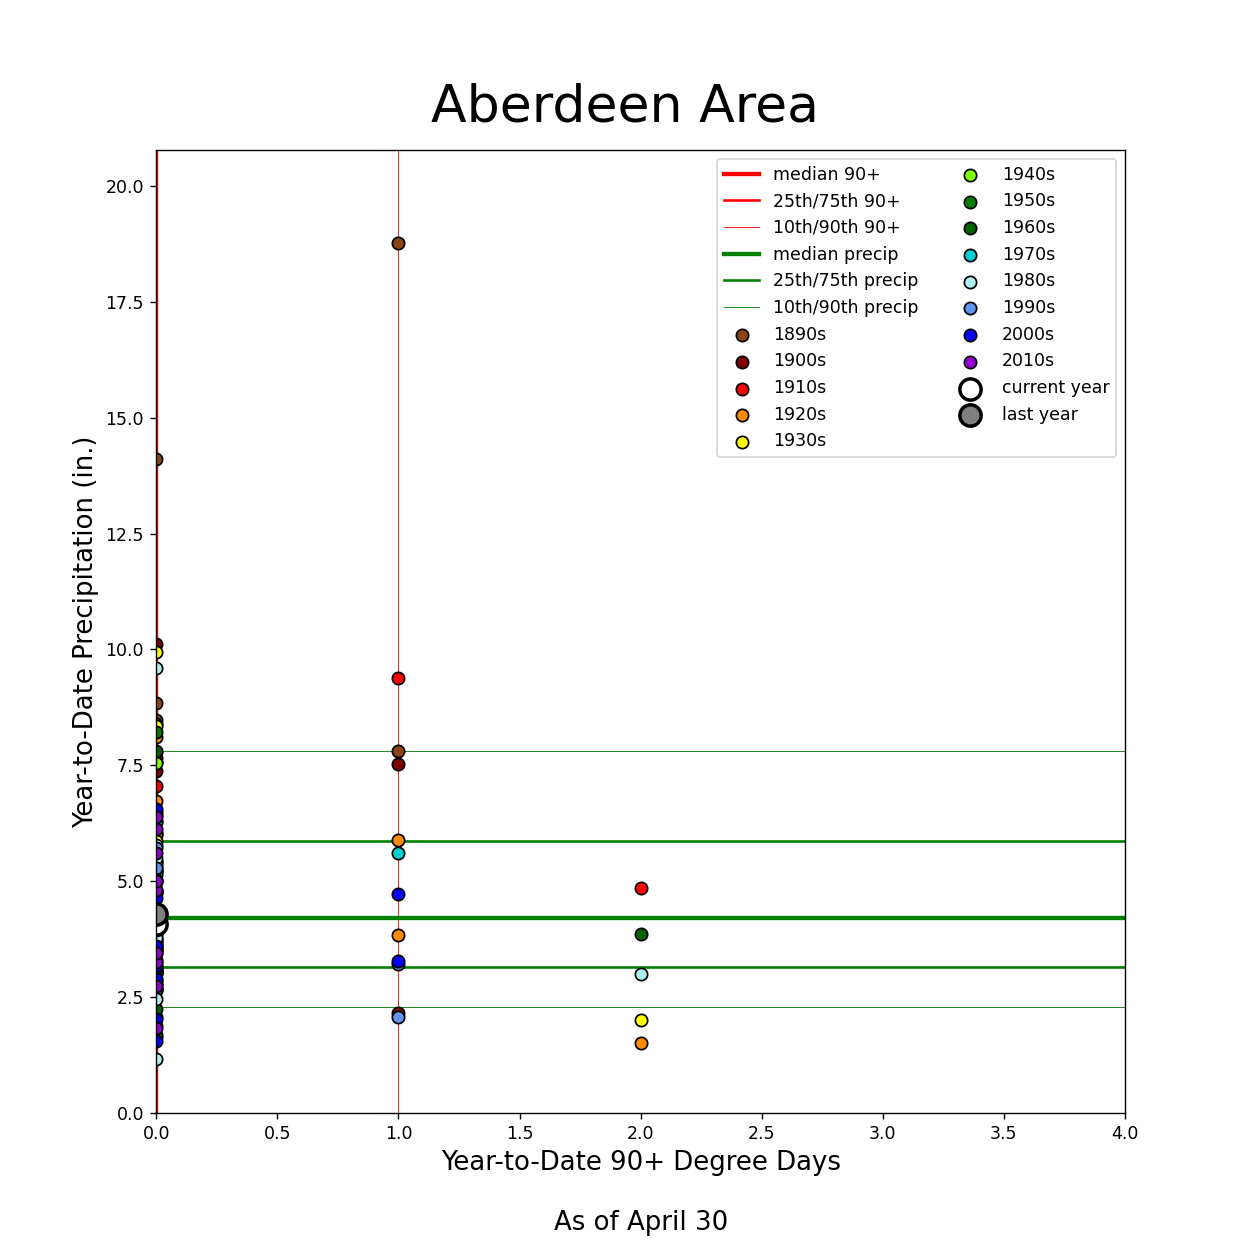
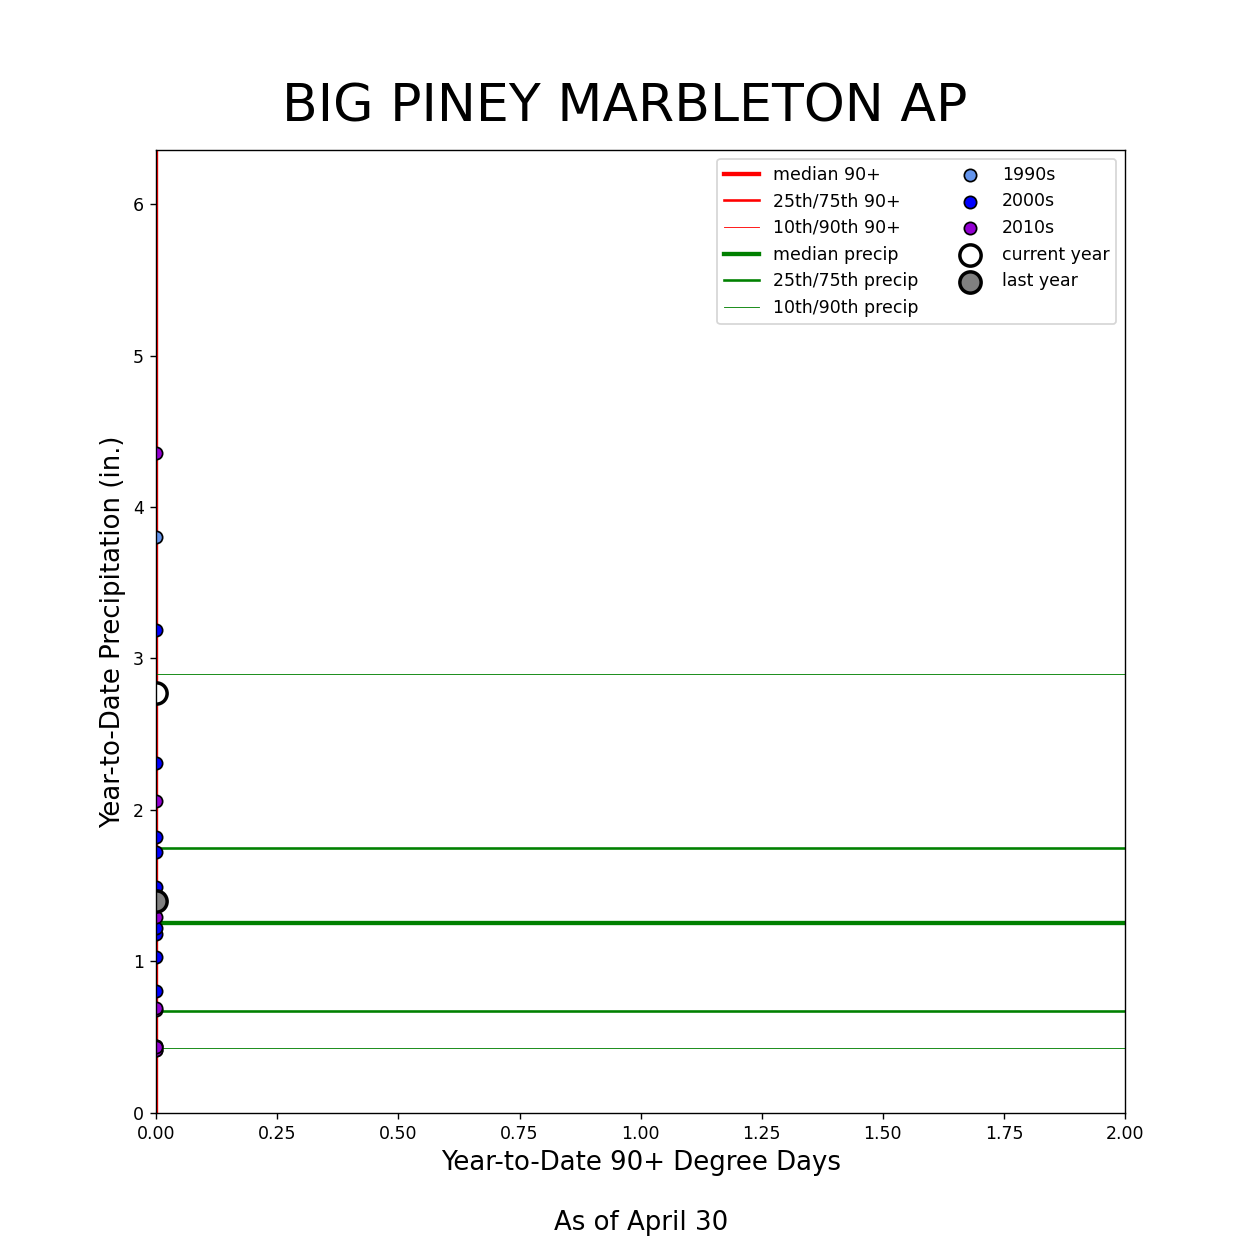
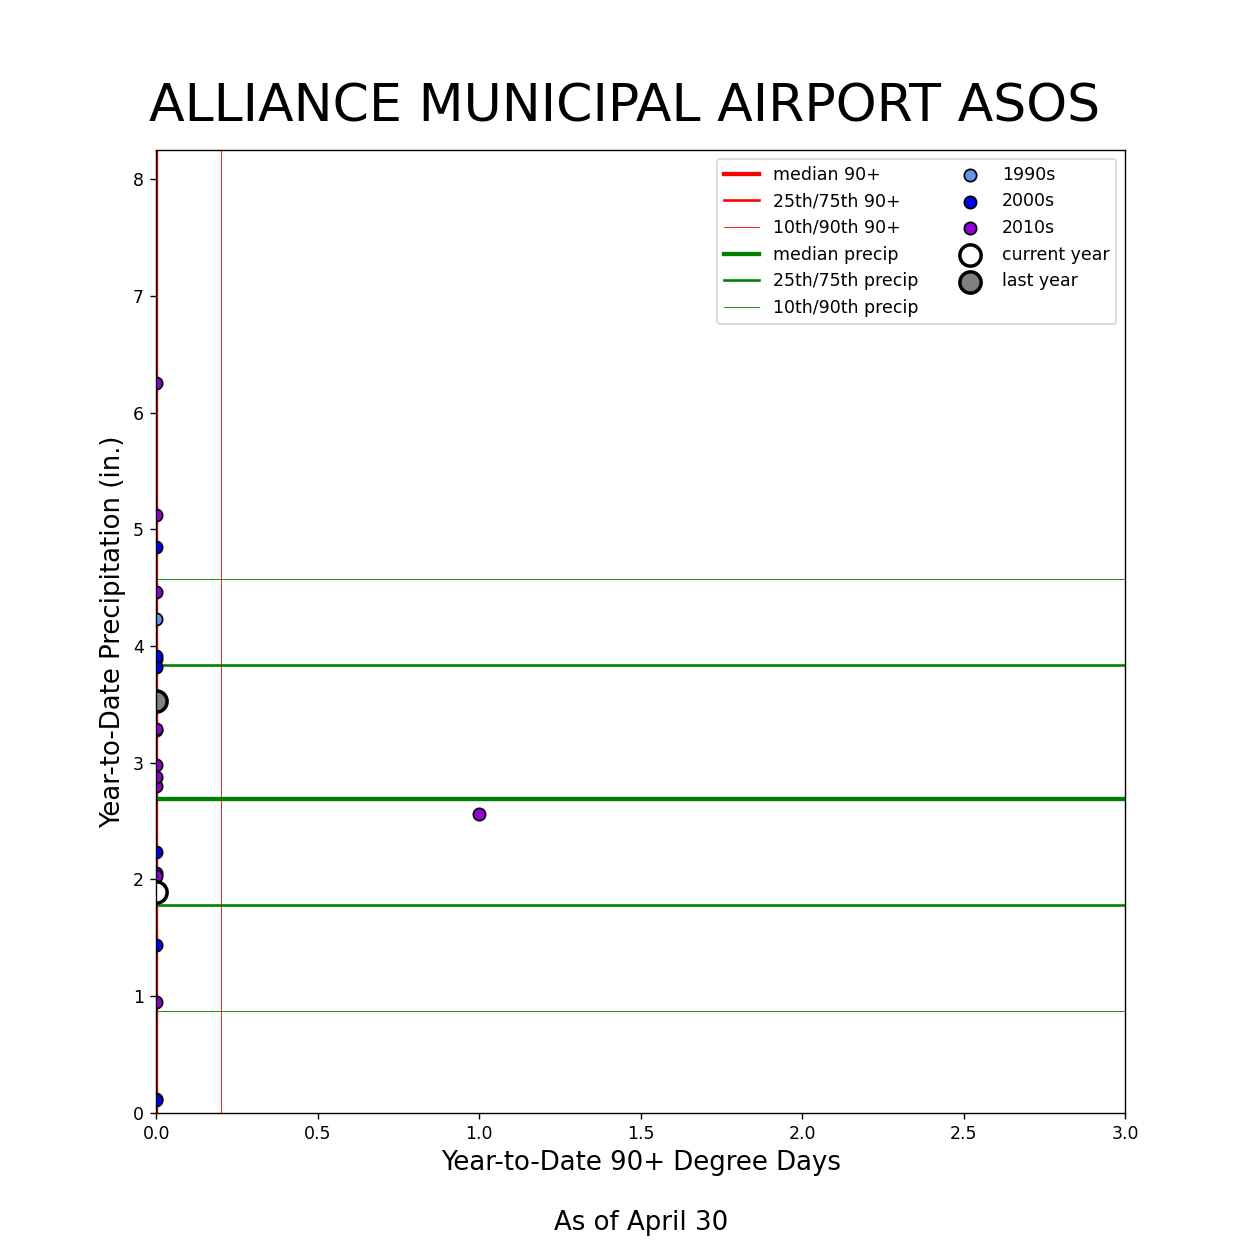
The following graphics depict the number of days that a given site has reached 90 degrees or more this year (on the x-axis) and the annual precipitation to date (on the y-axis). Also included are prior years, color coded by decade, and the 10th, 25th, 50th (i.e., median), 75th, and 90th percentiles for each variable. These graphics show us how hot and dry (or cool and wet) the current year is compared to the period of record and may be useful in drought monitoring.
Many of these sites are maintained by cooperative observers, a program which you can learn more about here. We are in the process of quality controlling past data, so some of these values are subject to change. To view the percentiles, hover over a location on the left after choosing the desired region of interest along the top of the page. Data courtesy of the Applied Climate Information System.