| Snow Amount
Potential
Experimental - Leave feedback
|
|
| Expected
Snowfall - Official NWS Forecast
What's this? |
High End Amount 1 in 10 Chance (10%) of Higher Snowfall What's this? |
| Low End
Amount 9 in 10 Chance (90%) of Higher Snowfall What's this? |
|
| Percent Chance That Snow
Amounts Will Be Greater Than...
Experimental - Leave feedback
What's
this?
|
||||||||||||||||
|
||||||||||||||||
| Snowfall Totals by Location
Experimental - Leave feedback
What's
this?
|
|
|
|
Snow Amount Potential
Experimental -
Leave feedback
|
|
|
Expected Snowfall - Official NWS Forecast
What's this? |
High End Amount 1 in 10 Chance (10%) of Higher Snowfall What's this? |
|
Low End Amount 9 in 10 Chance (90%) of Higher Snowfall What's this? |
|
|
Percent Chance That Snow Amounts Will Be Greater Than...
Experimental -
Leave feedback
What's this?
|
||||||||||||||||
|
||||||||||||||||
| Ice Accumulation
Potential
Experimental - Leave feedback
|
|
| Expected
Ice Accumulation - Official NWS Forecast
What's this? This is the elevated flat surface ice accumulation. It is not radial/line ice. Radial/line ice is typically 39% of the elevated flat surface ice. For more information on this, see this module. |
High End Amount 1 in 10 Chance (10%) of Higher Ice Accumulation What's this? |
| Low End
Amount 9 in 10 Chance (90%) of Higher Ice Accumulation What's this? |
|
| Percent Chance That Ice
Accumulation Will Be Greater Than...
Experimental - Leave feedback
What's
this?
|
||||||||||||||||
|
||||||||||||||||
| Ice Accumulation by
Location
Experimental - Leave feedback
What's
this?
|
|
|
|
Ice Accumulation Potential
Experimental -
Leave
feedback
|
|
|
Expected Ice Accumulation - Official NWS Forecast
What's this? This is the elevated flat surface ice accumulation. It is not radial/line ice. Radial/line ice is typically 39% of the elevated flat surface ice. For more information on this, see this module. |
High End Amount 1 in 10 Chance (10%) of Higher Ice Accumulation What's this? |
|
Low End Amount 9 in 10 Chance (90%) of Higher Ice Accumulation What's this? |
|
|
Percent Chance That Ice Accumulations Will Be Greater Than...
Experimental -
Leave
feedback
What's this?
|
||||||||||||||||
|
||||||||||||||||
| Precipitation Onset/End Timing | ||
| Onset of Wintry Precipitation | End Timing of Wintry Precipitation | |
|---|---|---|
 |
 |
|
| What's this? | What's this? | |
 |
 |
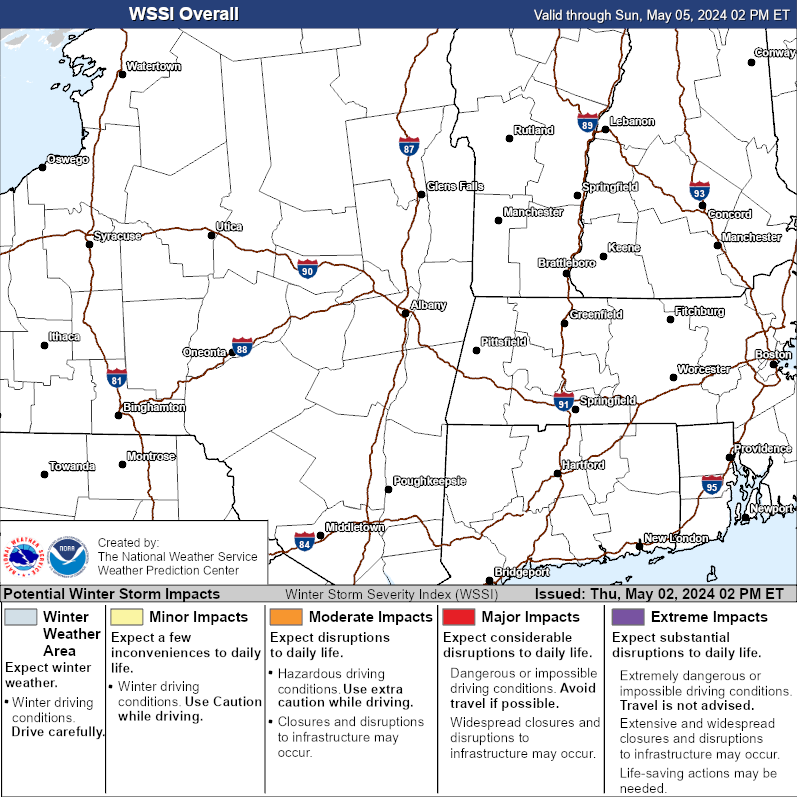
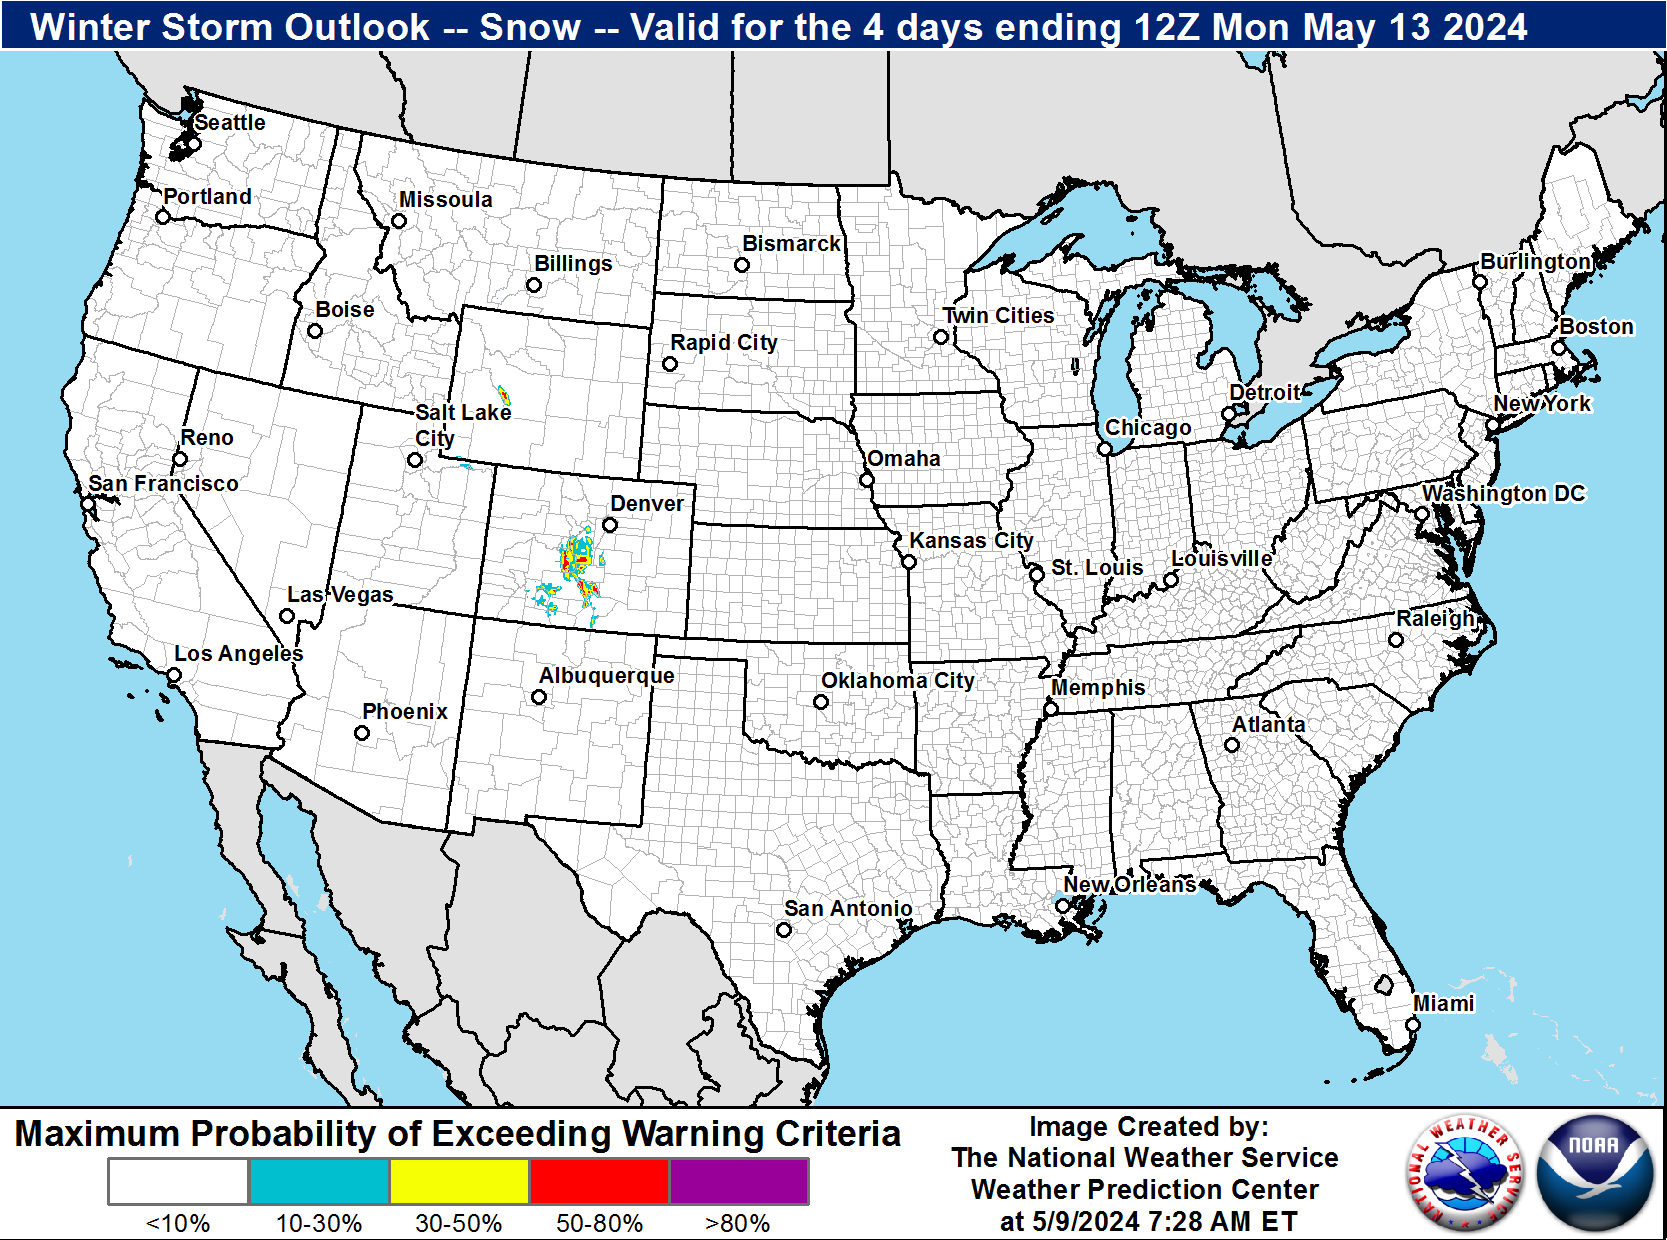
| Winter Storm Severity Index (WSSI) | Winter Storm Outlook (WSO) |
|---|---|
|
|
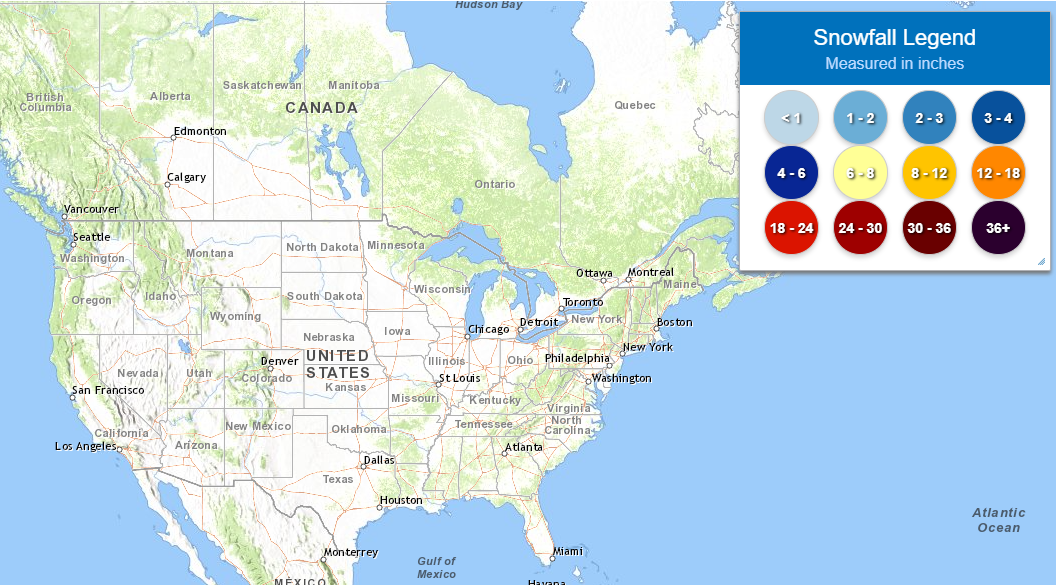
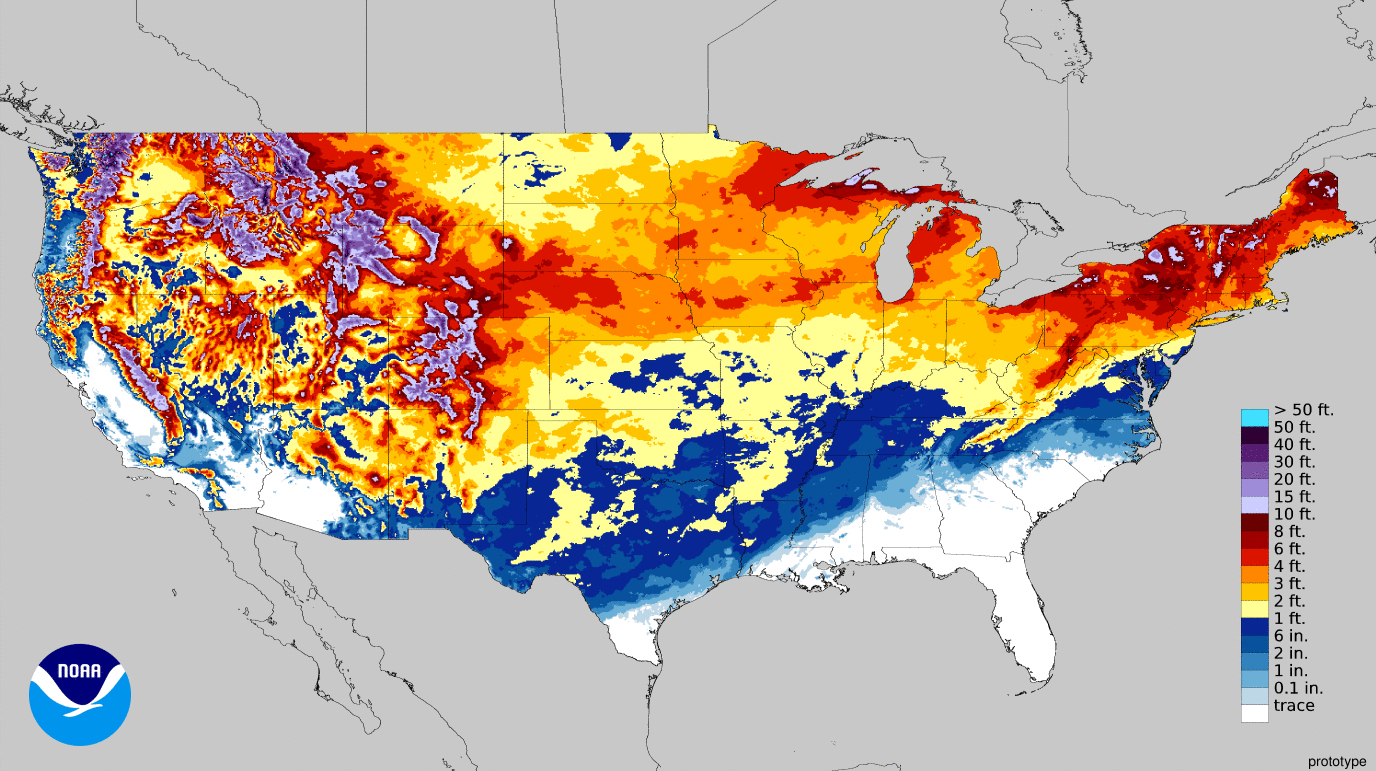
| Local Snow Reports | National Snowfall Analysis |
|---|---|
 |
 |
| Days 4-7 Winter Weather Outlook | |
| Day 4 Winter Weather Outlook | Day 5 Winter Weather Outlook |
|
|
| Day 6 Winter Weather Outlook | Day 7 Winter Weather Outlook |
|
|
|
|
|
| CPC Week-2 Experimental Heavy Snow Risk | |
 |
|
| CPC Temperature & Precipitation Maps | |
|
Days 6-10 |
|
| Temperature | Precipitation |
 |
 |
|
Days 8-14 |
|
| TEMPERATURE | PRECIPITATION |
 |
 |
|
Week 3-4 |
|
|
TEMPERATURE |
PRECIPITATION |
 |
 |

