
These preliminary observed rainfall graphics are automatically updated daily to show the last 1-, 2-, 3-, 5-, 7-, and 10-day rainfall totals. Click individual images for larger version; click again or use arrow keys to step through the images. Since these data are preliminary and created within hours of rainfall, the maps have not completed the quality-control process.
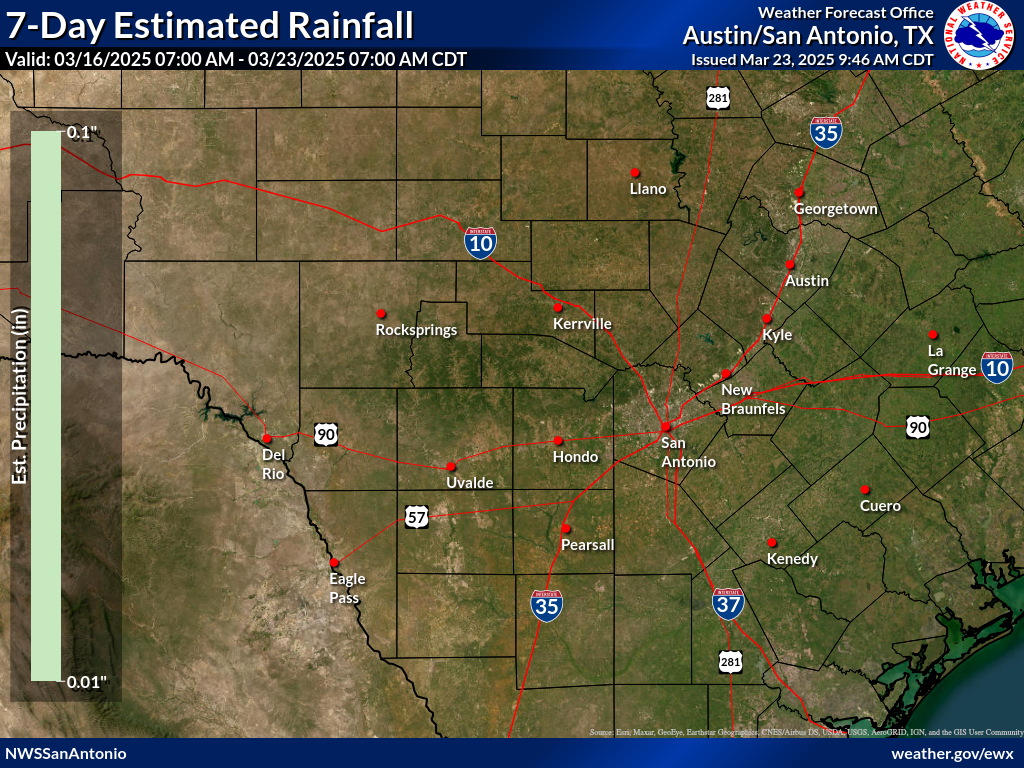
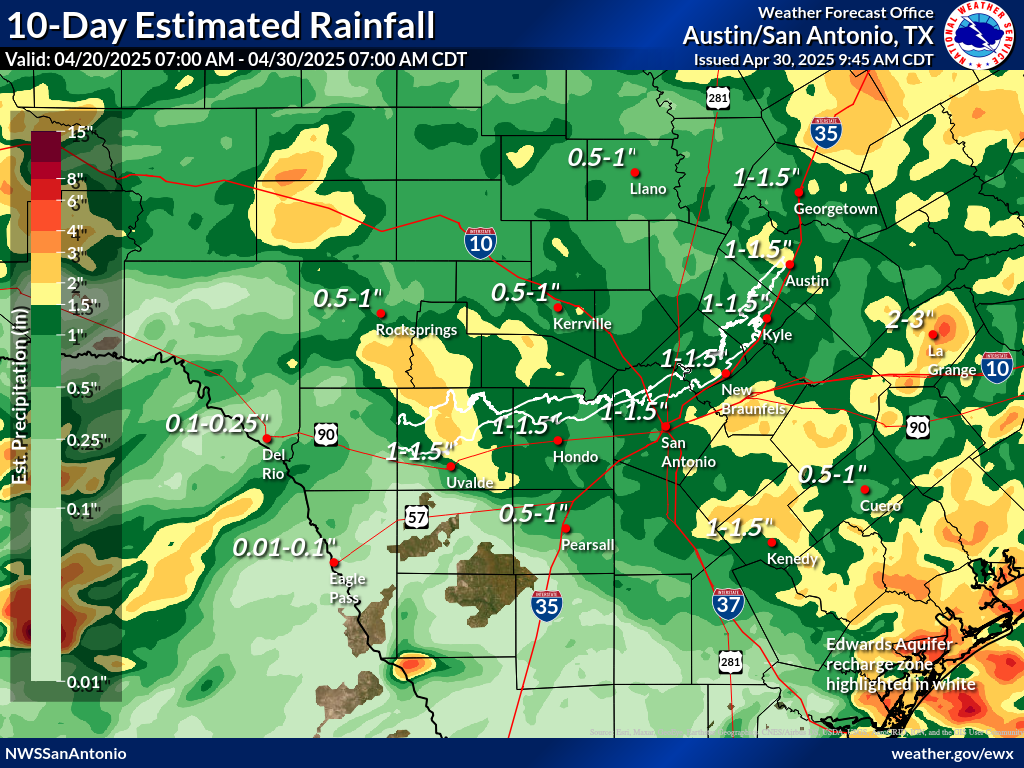
Disclaimer: Graphics should be treated as rainfall estimates and not used for decision purposes. Preliminary data based on the UnRestricted Mesoscale Analysis (URMA) QPE field.
These preliminary observed rainfall graphics are automatically updated every 6 hours to show the latest 6-, 12-, 18-, and 24-hour rainfall totals for standard periods. Click individual images for larger version; click again or use arrow keys to step through the images. Since these data are preliminary and created within hours of rainfall, the maps have not completed the quality-control process.
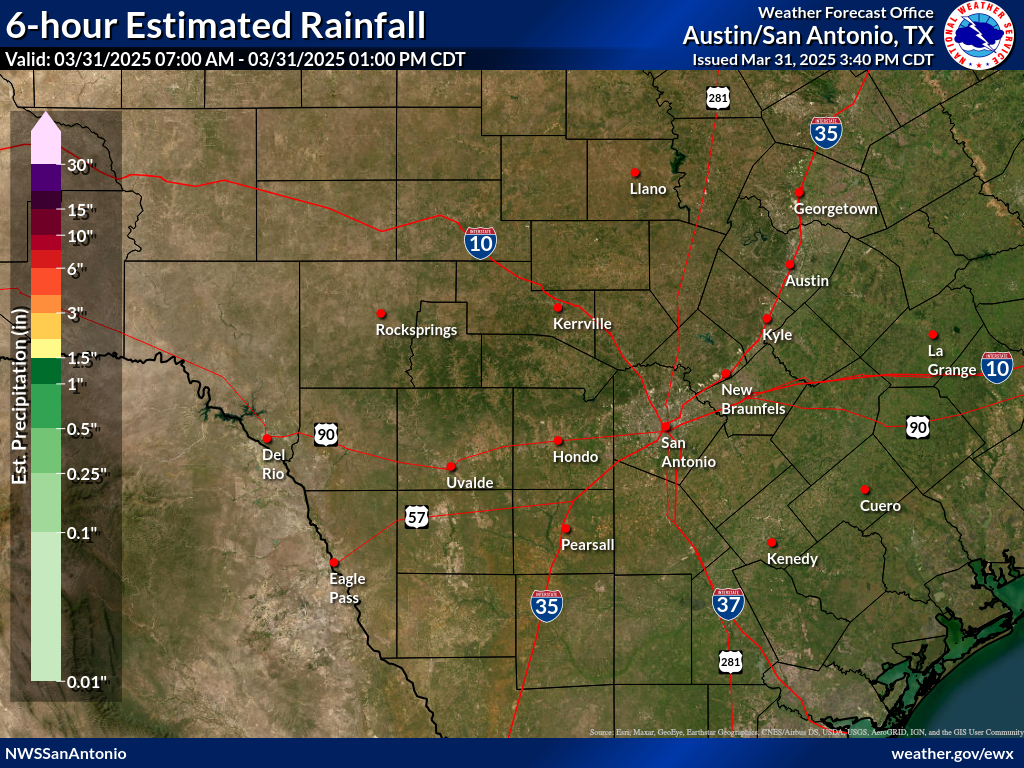
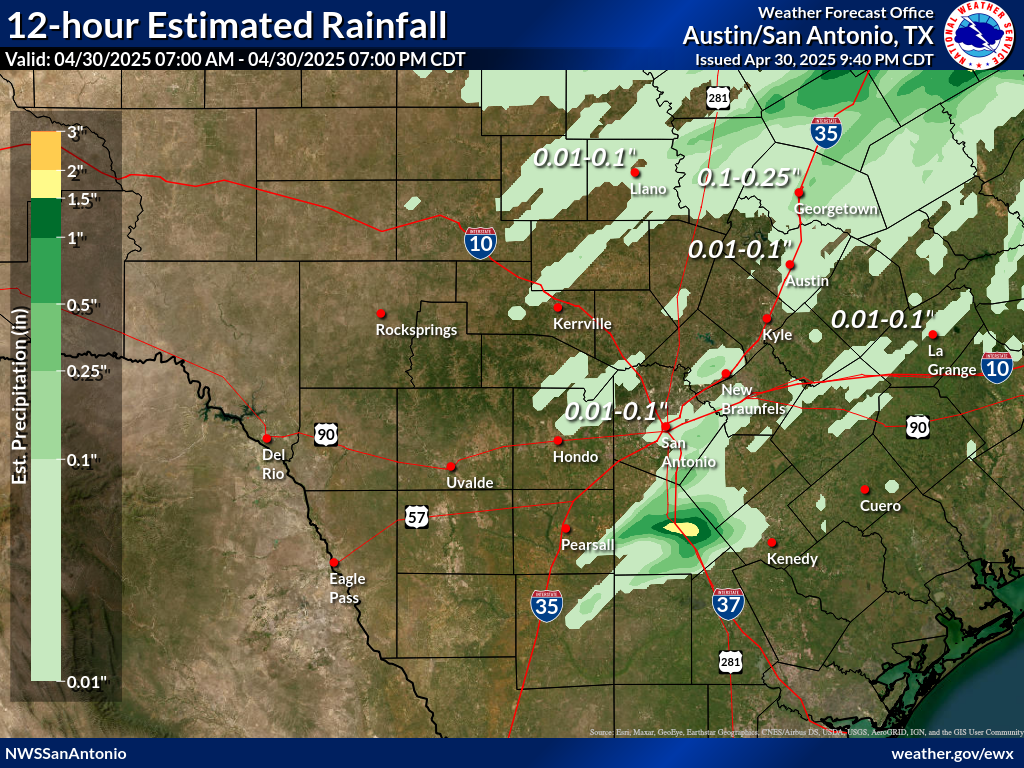
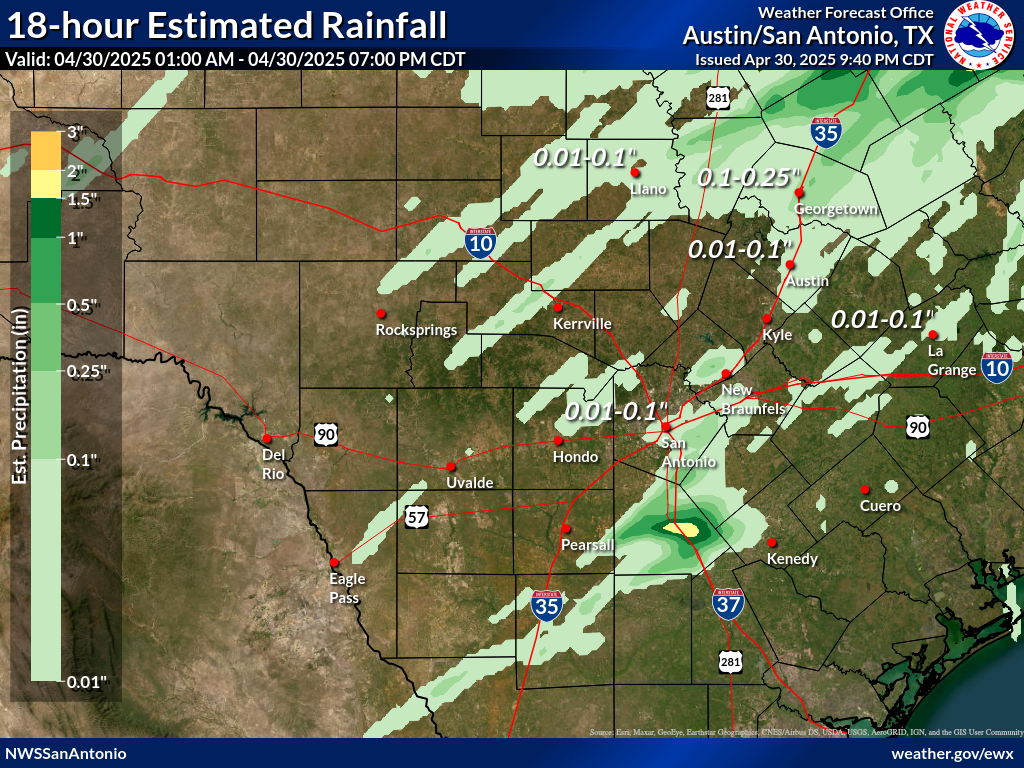
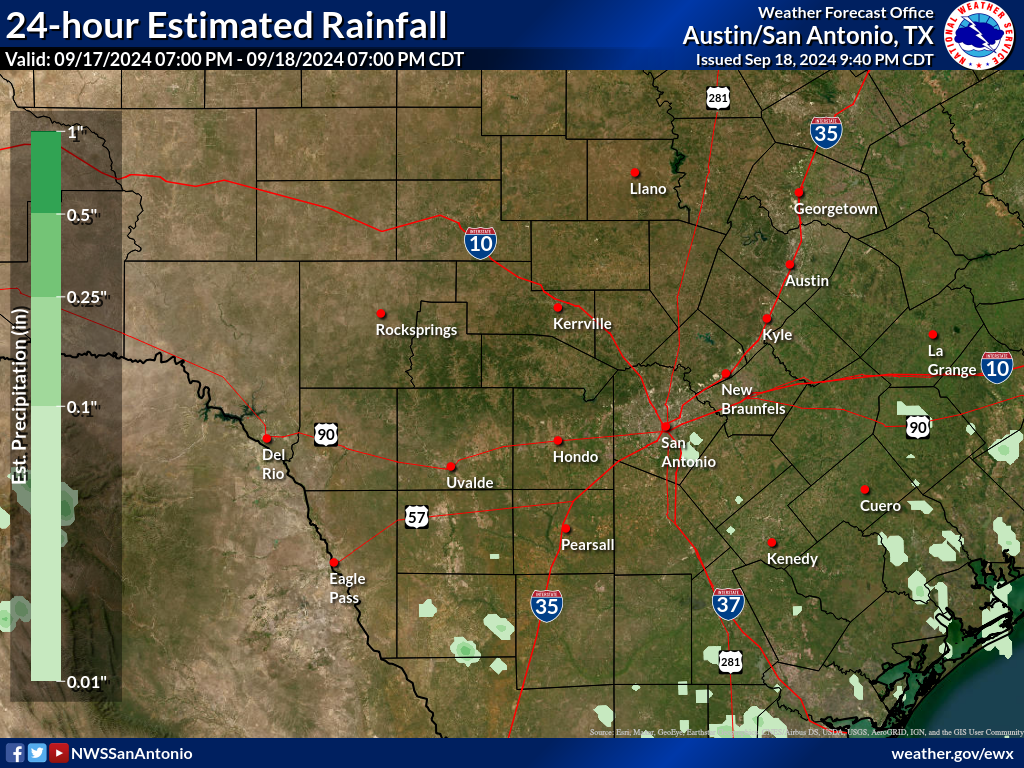
Disclaimer: Graphics should be treated as rainfall estimates and not used for decision purposes. Preliminary data based on the UnRestricted Mesoscale Analysis (URMA) QPE field.
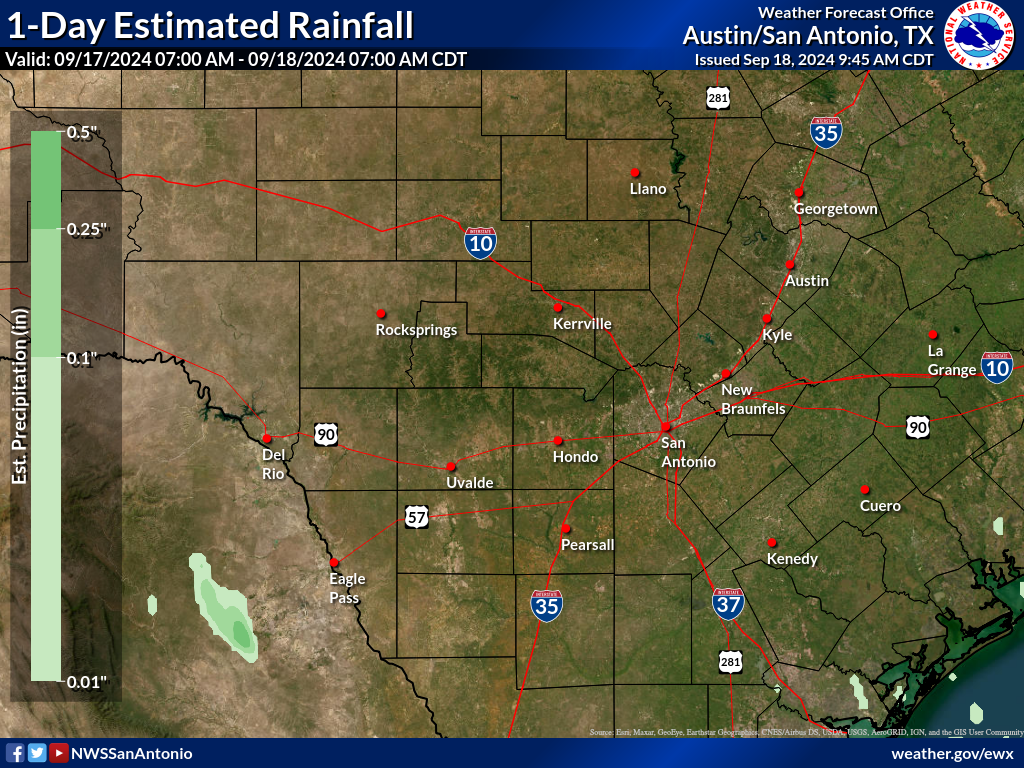
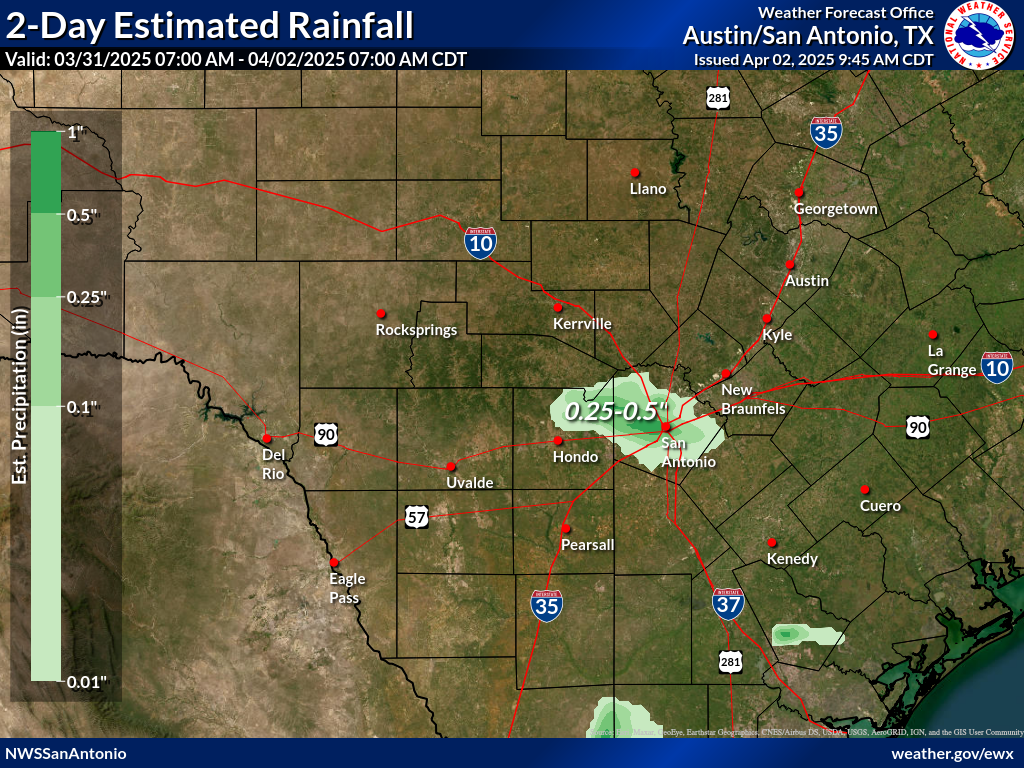
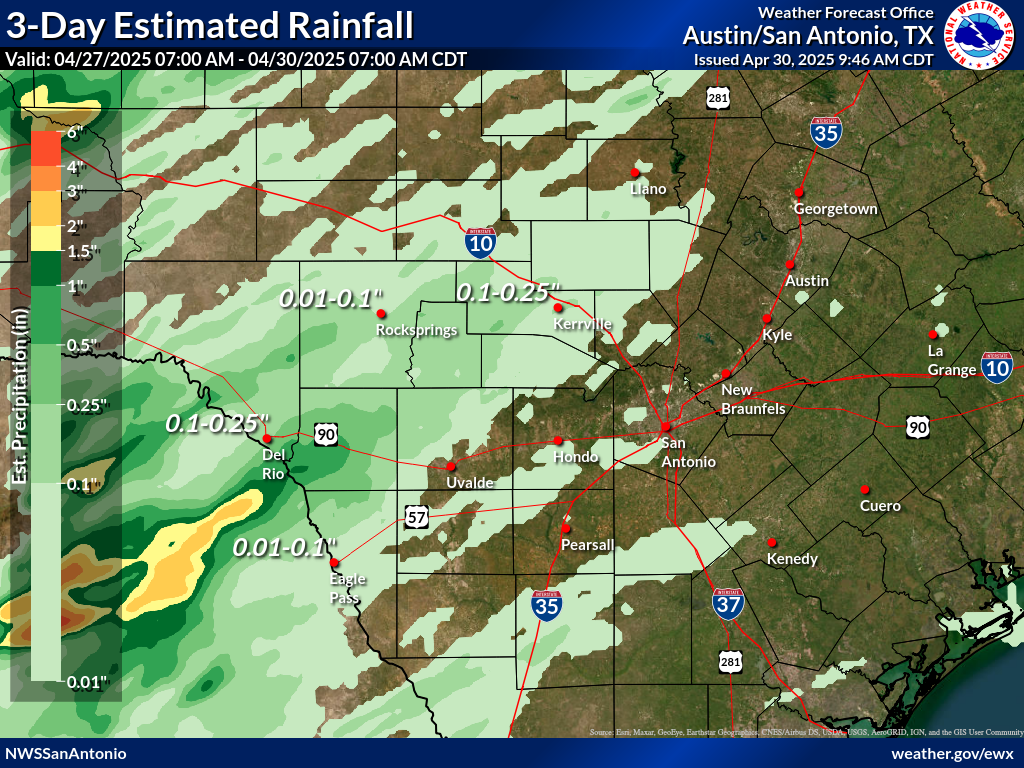
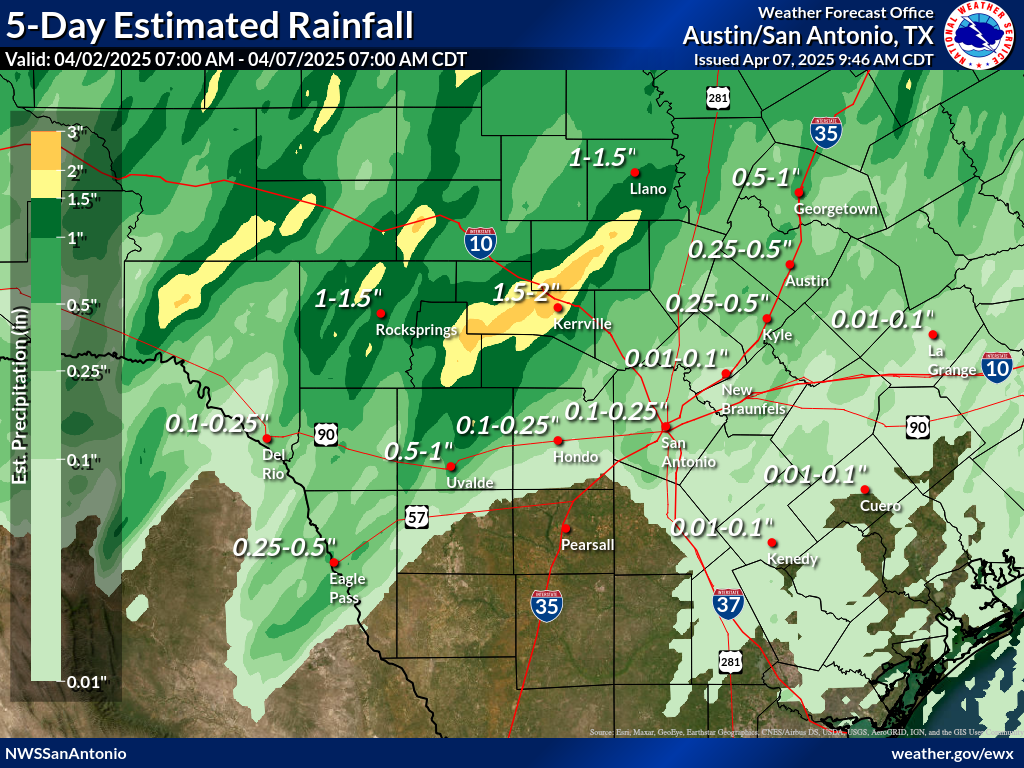
Preliminary daily rainfall maps are archived for the Austin/San Antonio County Warning Area for one year. Please use the date selector below to retrieve an archived map. Since these data are preliminary and created within hours of rainfall, the maps have not completed the quality-control process and should not be used for decision or research purposes.
Note: The date selection below corresponds to the previous 24 hours of rainfall. For example, the 10/12/2017 map will display data beginning at 7am on 10/11/2017 (the day before) and up until 7am on 10/12/2017.
Note: Due to technical issues, the rainfall maps from 7/15/2024 through 8/6/2024 are not available via the archive.
Disclaimer: Graphic should be treated as rainfall estimates and not used for decision purposes. Preliminary data based on the UnRestricted Mesoscale Analysis (URMA) QPE field.
Daily Local Cooperative Observer Report:
                                        Miscellaneous Hydrologic Data

                Issued: 08/03/2026 01:25:00 PM UTC
Daily Local CoCoRaHS Reports:
                                        Local Cooperative Observation

                Issued: 08/02/2026 09:15:00 PM UTC
Daily Consolidated Precipitation Reports from the West Gulf River Forecast Center:
                                        Daily Hydrometeorological Products

                Issued: 08/02/2026 08:58:27 PM UTC

