
Flash flooding threatens areas from the Tennessee Valley to the Carolinas as storms repeat along a stalled front. Monsoonal storms may trigger flooding in the Southwest. Dangerous heat expands across the Desert Southwest, Plains, mid-Mississippi Valley and Southern Tier. Critical fire weather for interior Pacific Northwest. Cooler, drier air brings brief relief to the Great Lakes and Northeast. Read More >
New Climate Normals (1991-2020)
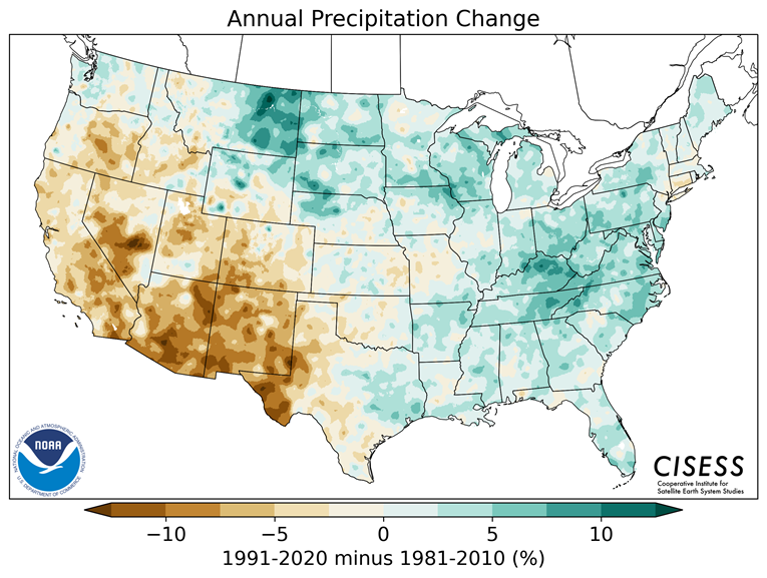
Climate normals are produced every 10 years for the previous 30-year period. On May 4, we began incorporating new normals into our climate products, replacing the 1981-2010 normals with normals based on data from 1991-2020.
The new normals are now available for Dallas/Fort Worth and Waco. Additional datasets can be accessed here.
Dallas/Fort Worth
| 1991-2020 Normals | Change from 1981-2010 | |
| annual mean temperature | 66.6°F | +0.3°F |
| annual precipitation total | 37.01" | +0.87" |
| average number of 100-degree days per year | 20 | +2 |
| average number of freezes per season | 29 | -4 |
Waco
| 1991-2020 Normals | Change from 1981-2010 | |
| annual mean temperature | 67.2°F | +0.5°F |
| annual precipitation total | 36.40" | +1.71" |
| average number of 100-degree days per year | 24 | 0 |
| average number of freezes per season | 34 | +1 |
Frequently Asked Questions
In a general sense, a "normal" is the expected value (e.g., temperature, precipitation amount, etc.) for a particular location during a particular time of year. Normals help describe a location's climate by quantifying certain elements, such as precipitation seasonality (i.e., when during the year precipitation tends to fall.) For monthly and annual values, normals are typically the average values during the 30-year period. Distinctly different from averages, daily normals are computed using a harmonic fit, a statistical method which dampens the effects of outliers, creating a smooth transition between adjacent days.
NOAA's computation of climate normals is in accordance with the recommendation of the World Meteorological Organization (WMO), of which the United States is a member. While the WMO mandates each member nation to compute 30-year averages of meteorological quantities at least every 30 years (1931-1960, 1961-1990, 1991-2020, etc.), the WMO recommends a decadal update, in part to incorporate newer weather stations. Further, NOAA's National Centers for Environmental Information (NCEI) has a responsibility to fulfill the mandate of Congress "... to establish and record the climatic conditions of the United States." This responsibility stems from a provision of the Organic Act of October 1, 1890, which established the U.S. Weather Bureau, the predecessor to the National Weather Service, as a civilian agency (15 U.S.C. 311).
The U.S. Weather Bureau's first 30-year normals were produced in the mid 1930s and were based on data from the period 1901-1930. Many locations across the country had continuous datasets that began in the late 1800s, and this provided a nationwide assessment of the climate. The 1991-2020 normals are thus the tenth iteration of 30-year normals in the United States.
Meteorologists and climatologists regularly use normals for placing recent climate conditions into a historical context. NOAA's normals are commonly seen on local weather news segments for comparisons with the day's weather conditions. In addition to weather and climate comparisons, normals are utilized in seemingly countless applications across a variety of sectors. These include: regulation of power companies, energy load forecasting, crop selection and planting times, construction planning, building design, and many others.
Initially, yes, but the entire month of May, including the first 3 days, will be assessed based on the new normals. Similarly, the spring season (March-May), as well as 2021 as a whole, will be compared to the new normals. In addition, the seasonal total of heating degree days (July 2020 to June 2021) will be measured against the new normals.
Departures from normal help gauge extreme events, such as the current drought. The utility of this concept is not lost when new normals are introduced, but when new normals are noticeably different from the previous iteration, departures from normal may appear more or less impressive.
For our region, the 1991-2020 normals are generally warmer and wetter than the 1981-2010 normals. However, these changes are not uniform across North and Central Texas. For example, some locations, particularly north of the I-20 corridor, experienced decreases in annual precipitation. Data from 1991-2010 are included in both sets of normals, so the changes are based on the differences between 1981-1990 and 2011-2020. In a nutshell, the most recent decade was generally warmer and wetter than the 1980s.
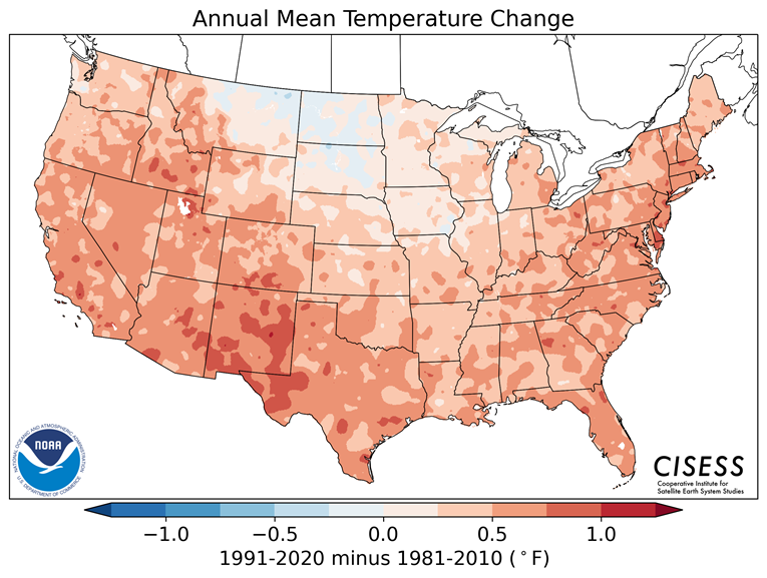
The climate of a particular location changes over time, but climate normals were not designed to be metrics of climate change. They may capture recent trends, giving a better perspective of the current state of the climate, but changes between sets of normals do not necessarily confirm a trend. Because of the rigidity of the 30-year time period, a trend on shorter or longer time scales may not be represented. When coupled with other issues, including the effects of urbanization, the changes from one set of normals to the next are not necessarily reflective of real changes in the underlying climate signal. Normals aim to provide expected values, but they cannot and do not provide a prediction of the future state of the climate.
For the period of reduced precipitation, departures from normal will generally increase and percent of normal values will decrease. This may give the impression that the drought is worse than if 1981-2010 normals were used, but drought statistics are much more than comparisons to the current normals. Precipitation totals can be compared to previous events, irrespective of the normal values used at the time. The U.S. Drought Monitor incorporates both objective and subjective methods to assess drought in a historical context. For example, droughts from the entire instrumental climate record are considered, many of which occurred long before the recent 30-year periods. Exceptional drought (D4) is reserved for events with a return period of 50 years, far beyond the scope of climate normals.

