
Heavy rain and widely scattered severe storms capable of large hail, damaging winds, and possibly a tornado are expected over portions of the central and southern Plains into the Lower Missouri Valley. Unseasonable warmth will continue for a few more days across the Midwest and Southeast where several daily record highs could fall. Read More >
Fort Worth/Dallas, TX
Weather Forecast Office
|
|
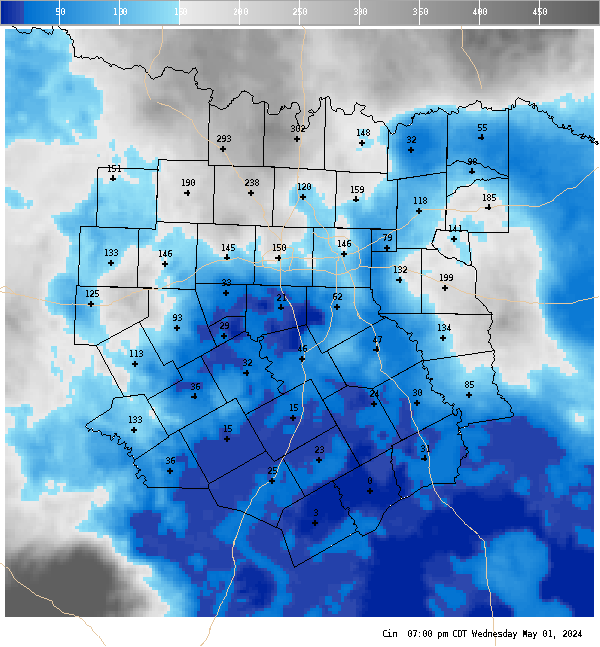
4 Panel Display | Animated Loop CIN The image is a surface based measurement of Convective INhibition (CIN) or what is sometimes more commonly referred to as the strength of the cap. The value is capped off at 500 J/KG. In cases where there is no surface based CAPE available this parameter is set to 500 J/KG. The yellow contours are the Lid Strength Index (LSI). This is another measure of how strong the cap is. It shows the thermal difference between a lifted surface parcel and the warmest part of the cap. Higher values indicate a more stable layer. In general, the Cap is said to be breakable when CIN is 30 J/Kg or less and/or the LSI is 2 degrees or less. A negative LSI is rare, but is indicative of freely buoyant low level instability. |
Current Hazards
National Outlooks
Tropical
Local Storm Reports
Storm Reports (Graphical)
Submit Storm Report
Tornado Warnings
Severe Thunderstorm Warnings
Flash Flood Warnings
Forecasts
Forecast Discussion
Graphical Forecast
Aviation Forecasts
Fire Weather
Hazard Planner
N. Texas Convective Parameters

US Dept of Commerce
National Oceanic and Atmospheric Administration
National Weather Service
Fort Worth/Dallas, TX
3401 Northern Cross Blvd.
Fort Worth, TX 76137
817.429.2631
Comments? Questions? Please Contact Us.


 Follow us on X
 Follow us on Facebook
 Follow us on YouTube
 FWD RSS Feed