A significant heat wave continues for the Rockies, Northern Plains, and Great Lakes into the Mid-Atlantic, peaking in intensity through midweek and lingering across parts of the Northern Plains and Midwest until this weekend. Excessive rainfall my bring life-threatening and locally catastrophic flash and urban flooding across portions of southwestern Texas through early Friday. Read More >
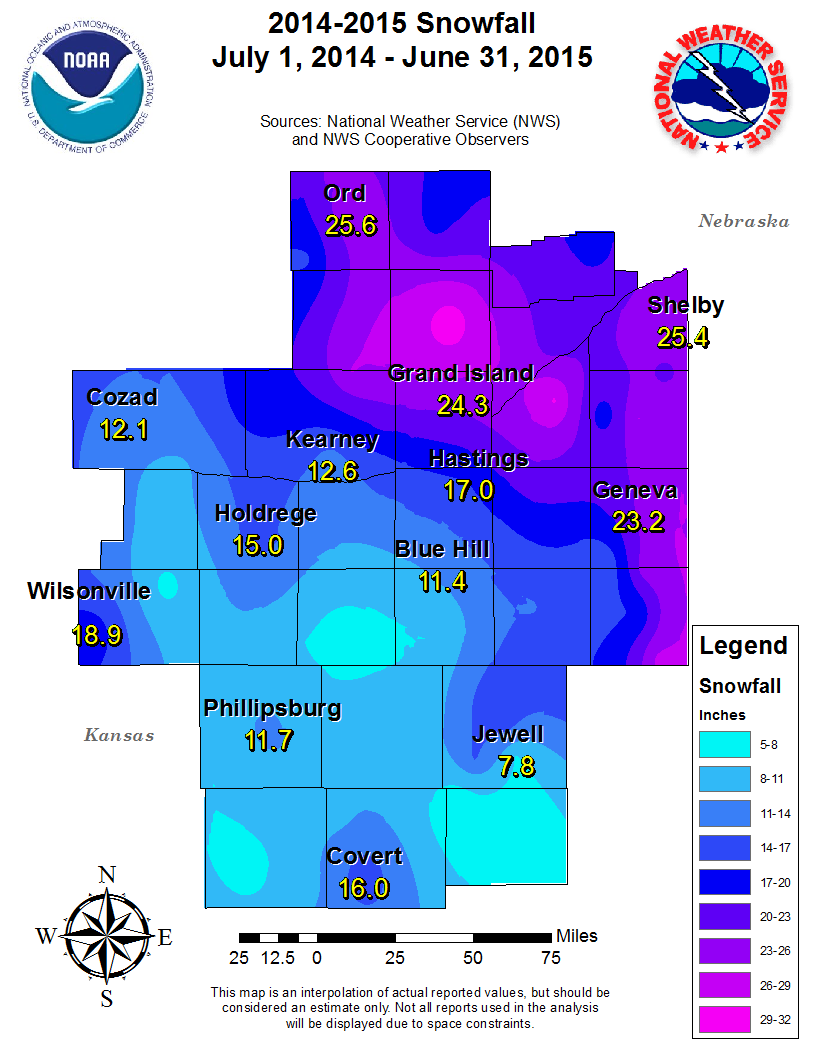
Following below are graphics and tables that reflect totals, departures from normal/average etc. for the 2014-2015 snowfall season. Before continuing though, and in order to give last season's snow totals some perspective, official 30-year NCEI normals/averages from 1981-2010 suggest that "normal"/average seasonal snowfall within the local area is:
The 2014-2015 snowfall season was highlighted/defined by the following points:
|
Click on image for larger version.
 |
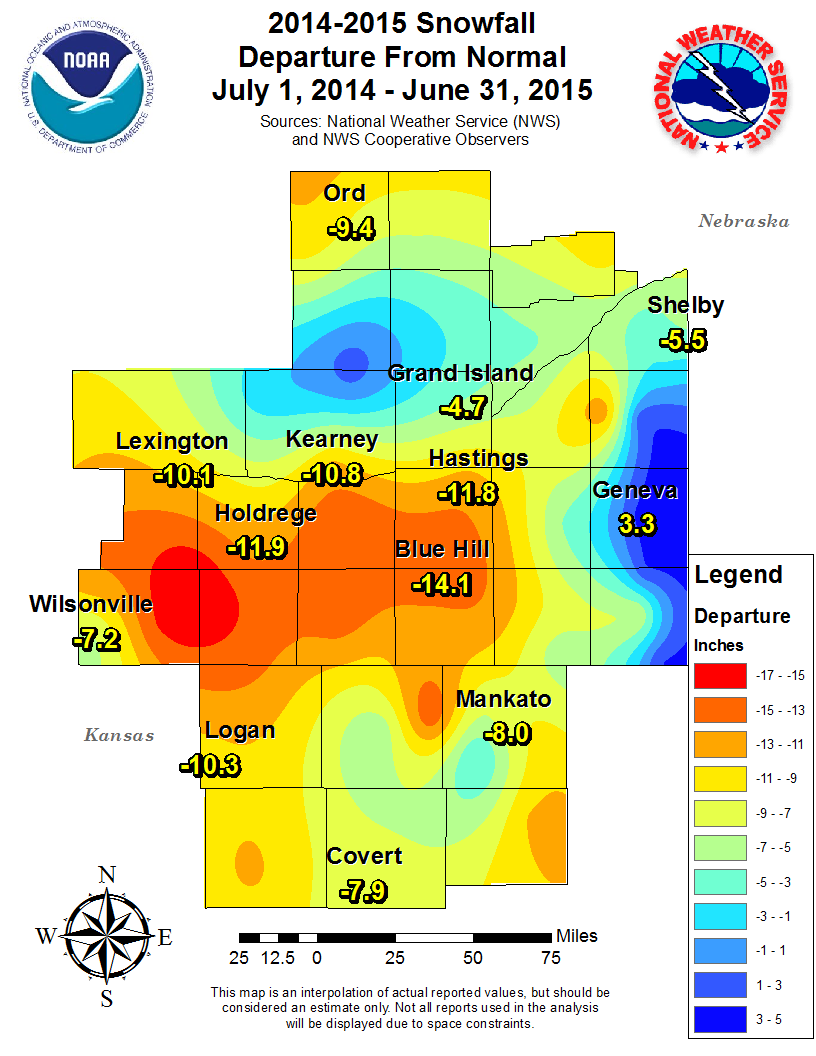 |
| 2014-15 Seasonal Snowfall | 2014-15 Snowfall Departure From Normal |
WINTER 2014-2015 NORTH CENTRAL KANSAS
COOPERATIVE OBSERVER SNOWFALL
* The highest reported amount under each month indicated in BLUE, the lowest amount in RED.
| Station | Sep | Oct | Nov | Dec | Jan | Feb | Mar | Apr | May | Season |
| Alton 2SW | 0.0 | 0.0 | 3.0 | 3.3 | 1.0 | 2.0 | 1.0 | 0.0 | 0.0 | 10.3 |
| Beloit | 0.0 | 0.0 | 0.5 | 2.5 | 2.0 | 0.5 | 1.0 | 0.0 | 0.0 | 6.5 |
| Burr Oak 1N | 0.0 | 0.0 | 1.6 | 3.1 | 2.2 | 4.9 | 3.3 | 0.0 | 0.0 | 15.1 |
| Cawker City | 0.0 | 0.0 | 1.2 | 2.5 | 1.0 | 1.0 | 1.0 | 0.0 | 0.0 | 6.7 |
| Covert Rural | 0.0 | 0.0 | 3.0 | 4.0 | 4.0 | 3.5 | 1.5 | 0.0 | 0.0 | 16.0 |
| Glen Elder Lake | 0.0 | 0.0 | Trace | 2.0 | 0.5 | MSG | MSG | 0.0 | MSG | MSG |
| Ionia | 0.0 | 0.0 | 1.5 | 2.4 | 2.0 | 2.5 | 1.7 | 0.0 | 0.0 | 10.1 |
| Jewell | 0.0 | 0.0 | 2.3 | 4.6 | 0.9 | MSG | MSG | 0.0 | 0.0 | MSG |
| Kirwin Dam | 0.0 | 0.0 | 0.6 | 4.5 | 3.0 | 1.5 | 0.8 | 0.0 | 0.0 | 10.4 |
| Lebanon | 0.0 | 0.0 | 0.5 | 1.4 | 1.5 | 3.7 | 2.4 | 0.0 | 0.0 | 9.5 |
| Logan | 0.0 | 0.0 | Trace | 4.0 | 1.0 | 2.0 | 1.0 | 0.0 | 0.0 | 8.0 |
| Long Island 1N | 0.0 | 0.0 | Trace | MSG | MSG | MSG | MSG | MSG | MSG | MSG |
| Lovewell Dam | 0.0 | 0.0 | MSG | 3.5 | 1.0 | 6.5 | 1.5 | 0.0 | 0.0 | MSG |
| Mankato | 0.0 | 0.0 | 2.0 | 3.1 | 3.4 | 4.0 | 3.0 | 0.0 | 0.0 | 15.5 |
| Natoma | 0.0 | 0.0 | 2.0 | 2.2 | 3.5 | 2.5 | 1.3 | 0.0 | 0.0 | 11.5 |
| Phillipsburg | 0.0 | 0.0 | 2.0 | 5.0 | 2.0 | 1.9 | 0.8 | 0.0 | 0.0 | 11.7 |
| Plainville 4WNW | 0.0 | 0.0 | 0.5 | 2.4 | 1.9 | 2.0 | 0.3 | 0.0 | 0.0 | 7.1 |
| Smith Center | 0.0 | 0.0 | 1.3 | 2.7 | 2.2 | 1.7 | 2.5 | 0.0 | 0.0 | 10.4 |
| Webster Dam | 0.0 | 0.0 | 0.7 | 1.3 | 1.2 | 1.0 | 1.1 | 0.0 | 0.0 | 5.3 |
WINTER 2014-2015 SOUTH CENTRAL NEBRASKA
COOPERATIVE OBSERVER SNOWFALL
* The highest reported amount under each month indicated in BLUE, the lowest amount in RED.
| Station | Sep | Oct | Nov | Dec | Jan | Feb | Mar | Apr | May | Season |
| Arcadia | 0.0 | 0.0 | 1.0 | 4.5 | 0.5 | 8.5 | Trace | 2.0 | 0.0 | 16.5 |
| Aurora 4N | 0.0 | 0.0 | 3.8 | 4.5 | 1.4 | 19.0 | 0.7 | Trace | 0.0 | 29.4 |
| Beaver City | 0.0 | 0.0 | 1.0 | 4.0 | 2.0 | 2.5 | 1.0 | 0.0 | 0.0 | 10.5 |
| Belgrade | 0.0 | 0.0 | 3.0 | 7.8 | 1.0 | 7.5 | Trace | 2.0 | 0.0 | 21.3 |
| Blue Hill 4SW | 0.0 | 0.0 | 1.3 | 2.6 | 1.0 | 5.1 | 1.4 | Trace | 0.0 | 11.4 |
| Bradshaw | 0.0 | 0.0 | 2.8 | 2.4 | 1.1 | 11.2 | 0.7 | 0.0 | 0.0 | 18.2 |
| Bruning | 0.0 | 0.0 | 3.0 | 3.1 | 2.0 | 15.3 | 1.0 | 0.0 | 0.0 | 24.4 |
| Cambridge | 0.0 | 0.0 | 1.0 | 6.3 | 1.4 | 4.2 | 1.7 | 0.0 | 0.0 | 14.6 |
| Lexington 6SSE (Canaday) | 0.0 | 0.0 | 1.5 | 4.7 | 0.5 | 3.2 | 0.5 | Trace | 0.0 | 10.4 |
| Central City | 0.0 | 0.0 | 2.6 | 4.8 | 1.8 | 12.6 | 0.2 | 0.0 | 0.0 | 22.0 |
| Clay Center 6ESE | 0.0 | 0.0 | 1.2 | 2.2 | 1.3 | 12.9 | 1.4 | 0.0 | 0.0 | 19.0 |
| Clay Center | 0.0 | 0.0 | 3.5 | 1.7 | 1.0 | 12.0 | 1.0 | 0.0 | 0.0 | 19.2 |
| Cozad | 0.0 | 0.0 | Trace | 4.8 | 0.6 | 5.7 | 1.0 | 0.0 | 0.0 | 12.1 |
| Edison | 0.0 | 0.0 | 1.0 | 3.0 | Trace | 2.0 | 1.0 | 0.0 | 0.0 | 7.0 |
| Elwood 8S | 0.0 | 0.0 | 1.2 | 5.4 | 0.9 | 2.6 | 0.6 | Trace | 0.0 | 10.7 |
| Franklin | 0.0 | 0.0 | Trace | 0.5 | 1.5 | 3.5 | 1.0 | 0.0 | 0.0 | 6.5 |
| Geneva | 0.0 | 0.0 | 3.2 | 4.0 | 4.5 | 11.0 | 0.5 | 0.0 | 0.0 | 23.2 |
| Genoa 2W | 0.0 | 0.0 | 2.4 | 3.9 | 3.2 | 8.5 | 0.4 | 1.0 | 0.0 | 19.4 |
| Gothenburg | 0.0 | 0.0 | MSG | MSG | MSG | MSG | MSG | MSG | 0.0 | MSG |
| Grand Island Airport | 0.0 | 0.0 | 2.2 | 5.9 | 3.7 | 11.1 | 0.6 | 0.8 | 0.0 | 24.3 |
| Greeley | 0.0 | 0.0 | 2.3 | 8.9 | 0.8 | 5.8 | Trace | 1.0 | 0.0 | 18.8 |
| Gresham 3W | 0.0 | 0.0 | 3.0 | 3.4 | 2.1 | 13.8 | Trace | Trace | 0.0 | 22.3 |
| Harlan County Lake | 0.0 | 0.0 | 0.0 | 2.5 | 1.0 | 4.5 | 1.0 | 0.0 | 0.0 | 9.0 |
| Hastings NWS | 0.0 | 0.0 | 1.7 | 3.4 | 5.7 | 5.4 | 0.8 | Trace | 0.0 | 17.0 |
| Hebron | 0.0 | 0.0 | 3.6 | 2.3 | 1.2 | 8.5 | 1.6 | 0.0 | 0.0 | 17.2 |
| Holdrege | 0.0 | 0.0 | 1.0 | 6.3 | 2.2 | 4.3 | 1.2 | 0.0 | 0.0 | 15.0 |
| Hubbell | 0.0 | 0.0 | 5.0 | 4.0 | 2.0 | 13.0 | 3.0 | 0.0 | 0.0 | 27.0 |
| Kearney Airport | 0.0 | 0.0 | 1.7 | 4.0 | 0.8 | 5.6 | 0.5 | Trace | 0.0 | 12.6 |
| Loup City | MSG | MSG | MSG | MSG | MSG | MSG | MSG | 2.0 | 0.0 | MSG |
| Miller | 0.0 | 0.0 | 1.3 | 5.8 | 0.5 | 9.8 | 0.8 | 0.8 | 0.0 | 19.0 |
| Minden | 0.0 | 0.0 | 0.9 | 3.8 | 2.0 | 4.4 | 1.0 | 0.0 | 0.0 | 12.1 |
| Naponee | 0.0 | 0.0 | Trace | 3.0 | 1.0 | 3.5 | 0.5 | 0.0 | 0.0 | 8.0 |
| Nelson | 0.0 | 0.0 | 1.9 | 3.3 | 2.1 | 5.3 | 1.2 | 0.0 | 0.0 | 13.8 |
| Ord | 0.0 | 0.0 | 4.0 | 10.8 | 1.5 | 8.3 | Trace | 1.0 | 0.0 | 25.6 |
| Osceola | 0.0 | 0.0 | 3.0 | 3.7 | 2.0 | 14.7 | 0.6 | 1.4 | 0.0 | 25.4 |
| Oxford 6NNW | 0.0 | 0.0 | 0.8 | 5.6 | 0.5 | 1.7 | 1.0 | 0.0 | 0.0 | 9.6 |
| Polk | 0.0 | 0.0 | 2.5 | 3.5 | MSG | 11.0 | 1.0 | 1.0 | 0.0 | MSG |
| Ravenna | 0.0 | 0.0 | 2.0 | 6.8 | 1.0 | 14.5 | 0.7 | 1.1 | 0.0 | 26.1 |
| Red Cloud | 0.0 | 0.0 | 0.5 | 3.0 | 0.5 | 3.0 | 1.0 | 0.0 | 0.0 | 8.0 |
| St. Paul | 0.0 | 0.0 | 3.2 | 10.8 | 1.7 | 13.6 | Trace | 1.6 | 0.0 | 30.9 |
| Shelby 3NE | 0.0 | 0.0 | 3.3 | 4.5 | 2.0 | 13.6 | 0.6 | 1.4 | 0.0 | 25.4 |
| Shickley 4S | 0.0 | 0.0 | 1.0 | 2.0 | 1.0 | 10.0 | 1.0 | 0.0 | 0.0 | 15.0 |
| Superior 4E | 0.0 | 0.0 | 1.5 | 3.4 | 3.1 | 6.3 | 2.5 | 0.0 | 0.0 | 16.8 |
| Wilsonville | 0.0 | 0.0 | 0.5 | 8.5 | 1.2 | 6.7 | 2.0 | 0.0 | 0.0 | 18.9 |
| York 3N | 0.0 | 0.0 | 4.3 | 5.7 | 1.4 | 13.9 | 0.8 | Trace | 0.0 | 26.1 |
MSG...All or part of data for the month/season is either missing or considered unrepresentative
(*Please Note: All climate data presented here are preliminary and have not undergone final quality control by the National Centers for Environmental Information (NCEI). Therefore, these data are subject to revision. Final and certified climate data can be accessed at: WWW.NCDC.NOAA.GOV)
 |
This page was composed by the staff at the National Weather Service in Hastings, Nebraska. |
 |