
Severe thunderstorms and heavy rain may produce large to very-large hail, severe winds, tornadoes and numerous instances of flash flooding across portions of the central Plains. Scattered slow-moving storms will continue to bring a flash flooding threat to the central Gulf Coast. Elevated to critical fire weather conditions are expected across much of the western U.S.. Read More >
2018 Precipitation Summary and Monthly Stats For 5 "Key" Sites
|
2018 as a whole was a wetter-than-normal year, as roughly 99 PERCENT of the 30-county NWS Hastings coverage area observed at least slightly ABOVE NORMAL precipitation. More specifically, most places finished somewhere between 2-6" above normal. That being said, these annual totals were somewhat skewed by an unusually wet December, which ranked among the Top-3 wettest on record in most places. In some ways, this resulted in the year as a whole looking a bit wetter than it otherwise might have seemed through the typical "rainy season" and agricultural growing season. |
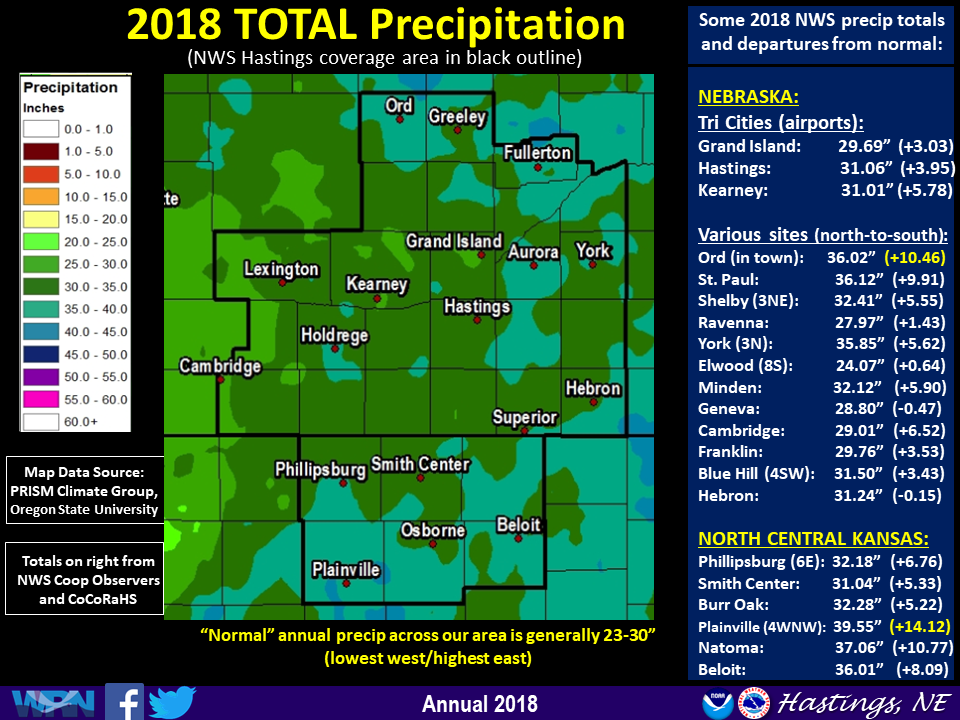 2018 Precipitation Map and list of several official totals (click to enlarge) |
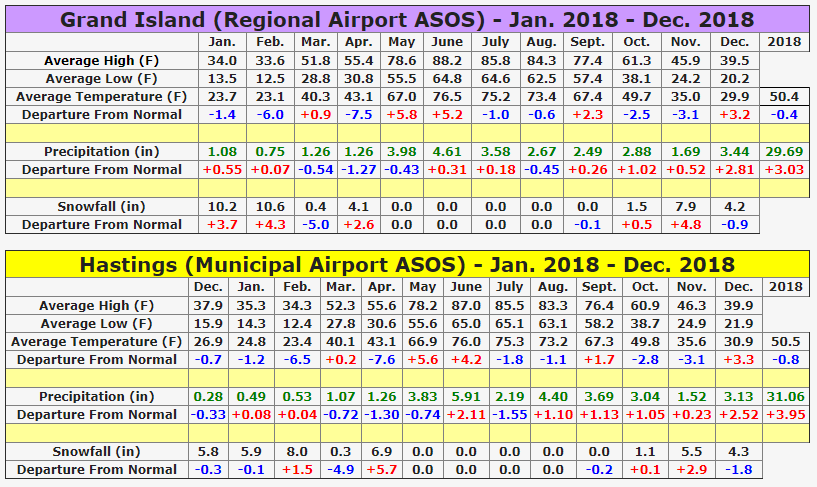 |
| 2018 Monthly Stats for Grand Island and Hastings airports (Hastings snow measured at NWS office) |
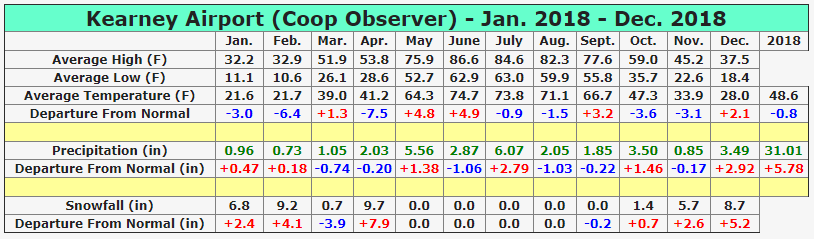 |
| 2018 Monthly Stats for Kearney airport (official NWS coop observer, not the unofficial automated sensor) |
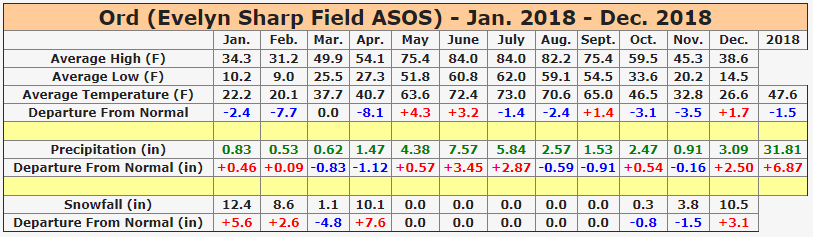 |
| 2018 Monthly Stats for Ord airport (snowfall data provided by NWS coop observer in town) |
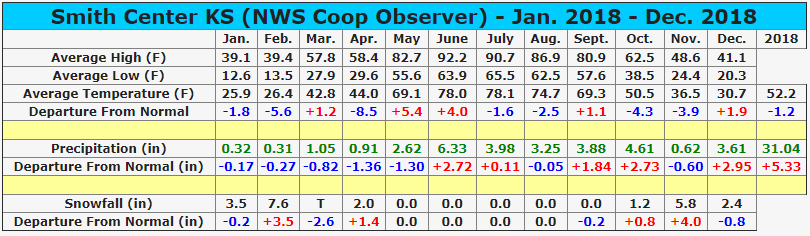 |
| 2018 Monthly Stats for Smith Center (NWS coop observer) |
 |
Media use of NWS Web News Stories is encouraged! Please acknowledge the NWS as the source of any news information accessed from this site. |
|

