2016 South Central Nebraska Precipitation Summary (for all 24 counties in central/south central Nebraska covered by NWS Hastings): As is the case in many years, this 24-county area as a whole exhibited quite a bit of variability in precipitation totals. While most areas weren't TRULY parched or TRULY water-logged for months on end, there were a number of places that ended up several inches short of normal and also many places that ended up at least a few inches above normal. Overall though, the vast majority of the area measured somewhere between 75-125% of normal. Breaking things down geographically, it is interesting to note that the driest portions of the area really seemed to focus within central counties, including areas in and near the Tri Cities. In contrast, some of the higher totals seemed to focus around the "outer fringes" of the area, farthest from the Tri Cities. As for extremes, the driest of roughly 40 primary NWS Cooperative Observer stations within the area included Minden with 19.96" (6.26" below normal) and Hastings airport with 20.66" (6.45" below normal). In contrast, a few of the wettest stations featured three miles northeast of Shelby at 33.07" (6.21" above normal) and Ord with 32.90" (7.34" above normal).
2016 ANNUAL PRECIPITATION MAP
(ENTIRE NWS HASTINGS COVERAGE AREA)
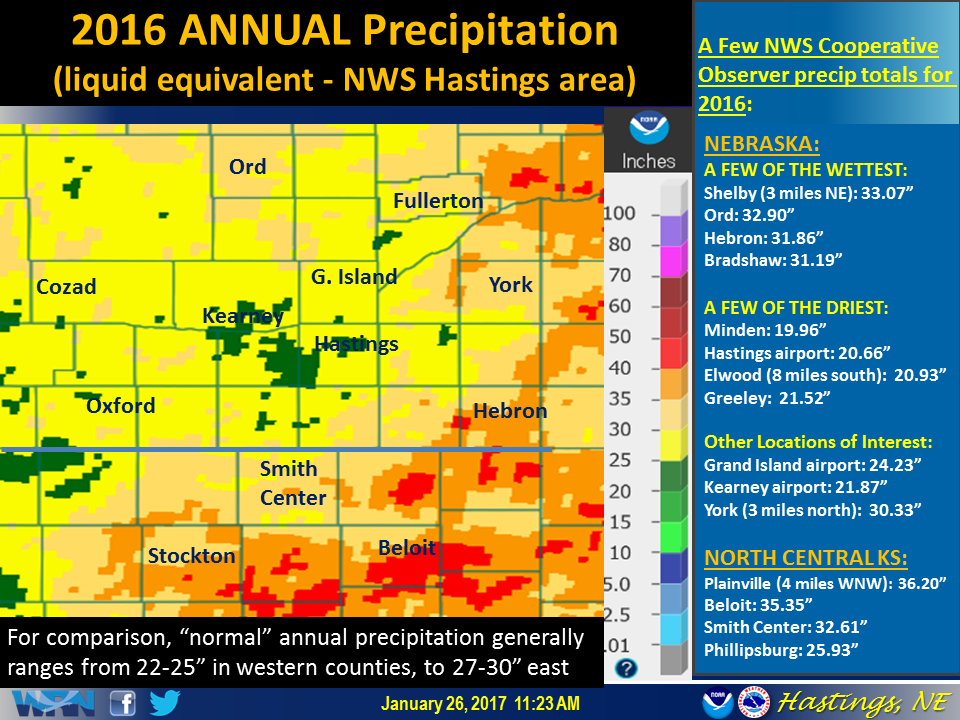 |
| Image generated from: https://water.weather.gov/precip/ (CLICK TO ENLARGE) |
2016 SOUTH CENTRAL NEBRASKA
NWS COOPERATIVE OBSERVER PRECIPITATION TABLE
(for 24 counties in the NWS Hastings coverage area)
(see bottom tables for winter 2015-2016 and 2016-2017 seasonal snowfall)
* The highest reported amount under each month indicated in BLUE, the lowest amount in RED.
According to 30-year data from NCEI 1981-2010, normal annual precipitation across this 24-county area generally ranges from 22-30 inches, with the lowest part of this range including far western locations such as Gothenburg and Cambridge, and the highest part of this range including far eastern locations such as York and Hebron.
| Station | Jan | Feb | Mar | Apr | May | Jun | July | Aug | Sep | Oct | Nov | Dec | 2016 Total |
| Arcadia | 0.30 | 0.82 | 0.39 | 8.06 | 6.42 | 1.49 | 8.24 | 0.65 | 1.37 | 0.24 | 1.12 | 0.43 | 29.53 |
| Aurora 4N | 0.39 | 0.80 | 0.45 | 3.90 | 6.17 | 0.97 | 4.04 | 1.88 | 4.12 | 1.32 | 0.82 | 0.99 | 25.82 |
| Beaver City | 0.14 | 1.36 | 0.07 | 5.23 | 5.07 | 4.03 | 4.21 | 3.08 | 2.50 | 0.20 | 0.81 | 0.90 | 27.60 |
| Belgrade | 0.42 | 0.90 | 1.52 | 4.88 | 4.40 | 1.34 | 3.40 | 3.19 | 2.86 | 0.30 | 1.22 | 0.50 | 24.93 |
| Blue Hill 4SW | 0.43 | 1.25 | 0.36 | 5.93 | 4.11 | 0.57 | 1.38 | 7.47 | 4.76 | 0.55 | MSG | 0.79 | MSG |
| Bradshaw | 0.58 | 1.07 | 0.65 | 4.33 | 5.60 | 0.24 | 4.25 | 3.70 | 5.65 | 3.21 | 1.05 | 0.86 | 31.19 |
| Bruning | 1.58 | 0.72 | 0.90 | 5.40 | 6.63 | MSG | 1.40 | 3.05 | 0.93 | 3.50 | 0.43 | 1.11 | MSG |
| Cambridge | 0.14 | 0.99 | 0.07 | 6.47 | 3.24 | 2.09 | 3.72 | 3.87 | 0.79 | 0.11 | 0.54 | 0.70 | 22.73 |
| Lexington 6SSE (Canaday) | 0.73 | 0.75 | 0.16 | 6.24 | 4.63 | 4.28 | 2.53 | 2.11 | 3.12 | 0.08 | 1.12 | 0.62 | 26.37 |
| Central City | 0.31 | 1.53 | 0.89 | 4.95 | 5.50 | 1.12 | 2.47 | 2.43 | 2.95 | 0.52 | 1.03 | 1.17 | 24.87 |
| Clay Center 6ESE | 0.53 | 0.75 | 0.31 | 3.19 | 4.21 | 0.23 | 2.77 | 3.12 | 3.42 | 1.15 | 1.22 | 0.86 | 21.76 |
| Clay Center | 0.68 | 1.22 | 0.33 | 4.19 | 5.41 | 0.43 | 2.61 | 2.18 | 3.55 | 1.83 | 1.19 | 0.94 | 24.56 |
| Cozad | 0.25 | 1.30 | 0.28 | 6.84 | 4.14 | 1.65 | 3.32 | 2.59 | 0.16 | 0.35 | 1.21 | 0.42 | 22.51 |
| Edison | 0.22 | 1.08 | 0.26 | 5.55 | 5.13 | 3.97 | 2.48 | 1.86 | 1.12 | 0.13 | 0.99 | 0.69 | 23.48 |
| Elwood 8S | 0.13 | 1.38 | 0.07 | 5.67 | 4.19 | 1.92 | 2.57 | 1.69 | 1.47 | 0.14 | 1.07 | 0.63 | 20.93 |
| Franklin | 0.35 | 1.30 | 0.73 | 7.16 | 3.24 | 0.78 | 3.61 | 1.90 | 3.27 | 0.05 | 0.72 | 0.82 | 23.93 |
| Geneva | 0.79 | 0.88 | 0.57 | 3.16 | 7.86 | 0.27 | 2.15 | 5.77 | 2.03 | 2.50 | 0.82 | 1.05 | 27.85 |
| Genoa 2W | 0.77 | 1.21 | 1.65 | 5.60 | 4.35 | 0.71 | 3.52 | 3.39 | 3.89 | 1.55 | 0.88 | 0.78 | 28.30 |
| Gothenburg | 0.38 | 0.93 | 0.22 | 7.37 | 6.70 | 2.64 | 3.63 | 2.63 | 0.86 | 0.91 | 1.00 | 0.38 | 27.65 |
| Grand Island Airport | 0.32 | 1.86 | 0.61 | 5.05 | 6.84 | 0.05 | 4.10 | 0.57 | 2.53 | 0.12 | 1.37 | 0.81 | 24.23 |
| Greeley | 0.33 | 0.66 | 0.76 | 6.72 | 3.92 | 0.64 | 3.81 | 1.60 | 1.02 | 0.53 | 1.22 | 0.31 | 21.52 |
| Gresham 3W | 0.67 | 0.65 | 1.19 | 3.39 | 8.54 | 0.11 | 2.00 | 3.18 | 4.09 | 2.27 | 1.03 | 0.78 | 27.90 |
| Harlan County Lake | 0.27 | 0.81 | 0.10 | 7.10 | 5.49 | 1.82 | 3.46 | 3.70 | 2.96 | 0.11 | 1.27 | 0.72 | 27.81 |
| Hastings Airport | 0.35 | 1.57 | 0.54 | 5.69 | 3.68 | 0.75 | 2.22 | 1.77 | 1.80 | 0.22 | 1.46 | 0.61 | 20.66 |
| Hastings NWS Office | 0.35 | 1.57 | 0.61 | 6.38 | 3.92 | 0.86 | 6.05 | 1.88 | 2.23 | 0.24 | 1.52 | 0.70 | 26.31 |
| Hebron | 0.68 | 0.30 | 0.62 | 4.91 | 8.38 | 0.33 | 2.78 | 7.84 | 2.02 | 2.01 | 0.79 | 1.20 | 31.86 |
| Holdrege | 0.74 | 1.58 | 0.23 | 10.41 | 4.14 | 2.04 | 2.21 | 1.61 | 1.43 | 0.18 | 1.53 | 0.71 | 26.81 |
| Hubbell | 1.08 | 0.73 | 0.57 | 3.50 | 5.75 | 0.44 | 4.11 | 6.37 | 2.26 | 2.21 | 0.63 | 1.42 | 29.07 |
| Kearney Airport | 0.40 | 0.98 | 0.56 | 8.39 | 2.30 | 0.61 | 3.38 | 1.47 | 1.20 | 0.12 | 1.56 | 0.90 | 21.87 |
| Loup City | 0.41 | 1.01 | 0.69 | 9.05 | 3.38 | 1.14 | 7.81 | 0.31 | 1.24 | 0.17 | 1.16 | 0.41 | 26.78 |
| Miller | 0.49 | 0.77 | 0.19 | 7.89 | 3.26 | 2.33 | 3.02 | 1.63 | 2.38 | 0.16 | 1.10 | 0.57 | 23.79 |
| Minden | 0.27 | 1.27 | 0.76 | 7.48 | 2.87 | 0.34 | 1.90 | 1.05 | 1.65 | 0.42 | 1.36 | 0.59 | 19.96 |
| Naponee | 0.27 | 1.03 | 0.27 | 6.69 | 4.56 | 1.47 | 2.92 | 2.47 | 3.16 | 0.21 | 1.15 | 0.70 | 24.90 |
| Ord Airport | 0.30 | 0.85 | 1.35 | 8.99 | 5.05 | 3.52 | 6.66 | 0.44 | 1.70 | 0.09 | 1.26 | 0.41 | 30.62 |
| Ord | 0.32 | 0.82 | 1.36 | 9.61 | 5.74 | 3.67 | 7.73 | 0.59 | 1.39 | 0.06 | 1.23 | 0.38 | 32.90 |
| Osceola | 0.60 | 1.00 | 1.18 | 5.40 | 4.21 | 0.23 | 2.57 | 3.88 | 4.61 | 2.02 | 1.22 | 1.04 | 27.96 |
| Oxford 6NNW | 0.20 | 1.04 | 0.05 | 6.63 | 5.28 | 2.97 | 2.23 | 1.84 | 1.04 | 0.14 | 1.03 | 0.79 | 23.24 |
| Polk | 0.48 | 1.01 | 0.59 | 5.16 | 7.20 | 0.48 | 2.02 | 3.23 | 4.19 | 4.21 | MSG | 0.88 | MSG |
| Ravenna | 0.28 | 1.09 | 0.35 | 8.28 | 3.58 | 0.93 | 4.51 | 1.26 | 3.75 | 0.51 | 1.35 | 0.40 | 26.29 |
| Red Cloud | 0.33 | MSG | 0.45 | 5.16 | 4.94 | 0.90 | 2.52 | 5.26 | 2.51 | 0.05 | 1.44 | 0.29 | MSG |
| St. Paul | 0.50 | 1.72 | 2.39 | 6.70 | 4.34 | 1.10 | 3.82 | 0.59 | 3.85 | 0.27 | 1.95 | 0.63 | 27.86 |
| Shelby 3NE | 0.69 | 0.97 | 1.11 | 5.45 | 5.57 | 1.74 | 3.47 | 5.51 | 4.43 | 2.20 | 0.96 | 0.97 | 33.07 |
| Shickley 4S | 0.75 | 1.20 | 0.10 | 4.52 | 4.92 | 1.04 | 2.27 | 2.60 | 2.20 | 2.77 | 0.75 | 1.08 | 24.20 |
| Superior | 0.99 | 1.31 | 0.38 | 4.38 | 5.24 | 1.46 | MSG | MSG | MSG | MSG | 0.62 | 0.90 | MSG |
| Wilsonville | 0.05 | 1.84 | 0.12 | 5.99 | 2.24 | 2.43 | 3.61 | 3.43 | 1.87 | 0.18 | 0.80 | 0.61 | 23.17 |
| York 3N | 0.65 | 1.26 | 1.07 | 4.46 | 7.75 | 0.27 | 4.08 | 2.01 | 4.41 | 2.08 | 1.22 | 1.07 | 30.33 |
WINTER 2015-2016 SOUTH CENTRAL NEBRASKA
COOPERATIVE OBSERVER SNOWFALL TABLE
* The highest reported amount under each month indicated in BLUE, the lowest amount in RED.
| Station | Sep | Oct | Nov | Dec | Jan | Feb | Mar | Apr | May | Season |
| Arcadia | 0.0 | 0.0 | 6.5 | 7.5 | MSG | 11.0 | 2.5 | 0.0 | 0.0 | MSG |
| Aurora 4N | 0.0 | 0.0 | 4.4 | 4.6 | 5.1 | 12.3 | 1.6 | T | 0.0 | 28.0 |
| Beaver City | 0.0 | 0.0 | 4.5 | 4.5 | 1.0 | 15.0 | T | 0.0 | 0.0 | 25.0 |
| Belgrade | 0.0 | 0.0 | 2.5 | 5.3 | 5.6 | 12.2 | 6.3 | T | 0.0 | 31.9 |
| Blue Hill 4SW | 0.0 | 0.0 | T | 4.0 | 3.4 | 14.3 | 0.7 | 0.0 | 0.0 | 22.4 |
| Bradshaw | 0.0 | 0.0 | 2.1 | 5.4 | 6.9 | 10.4 | 1.0 | 0.0 | 0.0 | 25.8 |
| Bruning | 0.0 | 0.0 | 1.3 | MSG | 11.1 | 8.0 | T | 0.0 | 0.0 | MSG |
| Cambridge | 0.0 | 0.0 | 6.6 | 5.9 | 1.6 | 13.2 | 0.5 | 0.0 | 0.0 | 27.8 |
| Lexington 6SSE (Canaday) | 0.0 | 0.0 | 6.3 | 4.8 | 2.8 | 10.2 | 0.5 | 0.0 | 0.0 | 24.6 |
| Central City | 0.0 | 0.0 | 4.7 | 2.5 | 3.6 | 12.7 | 2.0 | 0.0 | 0.0 | 25.5 |
| Clay Center 6ESE | 0.0 | 0.0 | 0.3 | 4.9 | 5.1 | 7.7 | 0.2 | 0.0 | 0.0 | 18.2 |
| Clay Center | 0.0 | 0.0 | 0.1 | 7.3 | 7.8 | 12.1 | T | 0.0 | 0.0 | 27.3 |
| Cozad | 0.0 | 0.0 | 0.5 | 4.2 | 2.8 | 14.8 | 1.3 | 0.0 | 0.0 | 23.6 |
| Edison | 0.0 | 0.0 | 3.0 | 3.0 | 1.4 | 12.5 | T | 0.0 | 0.0 | 19.9 |
| Elwood 8S | 0.0 | 0.0 | 5.7 | 8.6 | 1.6 | 15.6 | 0.5 | 0.0 | 0.0 | 32.0 |
| Franklin | 0.0 | 0.0 | 0.5 | 4.0 | 2.0 | 11.5 | 1.0 | 0.0 | 0.0 | 19.0 |
| Geneva | 0.0 | 0.0 | 2.3 | 7.0 | 10.0 | 8.5 | T | T | 0.0 | 27.8 |
| Genoa 2W | 0.0 | 0.0 | 3.7 | 2.0 | 12.4 | 12.3 | 3.0 | 0.0 | 0.0 | 33.4 |
| Grand Island Airport | 0.0 | 0.0 | 5.6 | 2.4 | 4.6 | 18.6 | 2.6 | 0.0 | 0.0 | 33.8 |
| Greeley | 0.0 | 0.0 | 1.7 | 10.4 | 2.4 | 13.6 | 4.0 | T | 0.0 | 32.1 |
| Gresham 3W | 0.0 | 0.0 | T | 3.5 | 7.0 | 11.5 | 2.0 | 0.0 | 0.0 | 24.0 |
| Harlan County Lake | 0.0 | 0.0 | 1.0 | 3.5 | 2.2 | 12.0 | 1.0 | 0.0 | 0.0 | 19.7 |
| Hastings NWS | 0.0 | 0.0 | 4.2 | 4.6 | 5.5 | 16.0 | 2.1 | 0.0 | 0.0 | 32.4 |
| Hebron | 0.0 | 0.0 | 0.7 | 2.8 | 9.5 | 5.5 | T | 0.0 | 0.0 | 18.5 |
| Holdrege | 0.0 | 0.0 | 2.8 | 2.0 | 7.8 | 16.5 | 2.5 | 0.0 | 0.0 | 31.6 |
| Hubbell | 0.0 | 0.0 | 1.0 | 3.0 | 12.0 | 6.0 | T | 0.0 | 0.0 | 22.0 |
| Kearney Airport | 0.0 | 0.0 | 4.5 | 1.7 | 4.0 | 11.0 | 3.0 | 0.0 | 0.0 | 24.2 |
| Loup City | 0.0 | 0.0 | 1.6 | 6.6 | 3.5 | 13.6 | 1.0 | 0.0 | 0.0 | 26.3 |
| Miller | 0.0 | 0.0 | 6.8 | 5.8 | 5.0 | 10.2 | 0.9 | 0.0 | 0.0 | 28.7 |
| Minden | 0.0 | 0.0 | 1.5 | 3.0 | 4.5 | 15.0 | 4.0 | 0.0 | 0.0 | 28.0 |
| Naponee | 0.0 | 0.0 | T | 2.4 | 2.5 | 10.7 | 1.8 | 0.0 | 0.0 | 17.4 |
| Ord | 0.0 | 0.0 | 5.5 | 10.5 | 5.3 | 12.0 | 8.0 | T | 0.0 | 41.3 |
| Osceola | 0.0 | 0.0 | 3.6 | 5.9 | 6.8 | 12.1 | 4.0 | T | 0.0 | 32.4 |
| Oxford 6NNW | 0.0 | 0.0 | 3.3 | 4.1 | 2.4 | 12.1 | 1.0 | 0.0 | 0.0 | 22.9 |
| Polk | 0.0 | 0.0 | 3.0 | 3.8 | 4.0 | 11.0 | 0.5 | 0.0 | 0.0 | 22.3 |
| Ravenna | 0.0 | 0.0 | 4.5 | 4.3 | 3.9 | 12.2 | 2.0 | 0.0 | 0.0 | 26.9 |
| Red Cloud | 0.0 | 0.0 | T | 3.0 | 3.5 | MSG | T | 0.0 | 0.0 | MSG |
| St. Paul | 0.0 | 0.0 | 3.5 | 4.1 | 5.7 | 14.3 | 3.2 | 0.0 | 0.0 | 30.8 |
| Shelby 3NE | 0.0 | 0.0 | 5.1 | 7.7 | 9.5 | 13.3 | 2.9 | 0.0 | 0.0 | 38.5 |
| Shickley 4S | 0.0 | 0.0 | T | 7.7 | 8.0 | 8.5 | T | 0.0 | 0.0 | 18.5 |
| Superior | 0.0 | 0.0 | 0.1 | 4.0 | 8.3 | 12.5 | T | 0.0 | 0.0 | 24.9 |
| Wilsonville | 0.0 | 0.0 | 5.0 | 5.0 | 0.5 | 18.0 | 0.5 | 0.0 | 0.0 | 29.0 |
| York 3N | 0.0 | 0.0 | 1.2 | 6.5 | 8.0 | 12.8 | 2.7 | T | 0.0 | 31.2 |
WINTER 2016-2017 SOUTH CENTRAL NEBRASKA
COOPERATIVE OBSERVER SNOWFALL TABLE
* The highest reported amount under each month indicated in BLUE, the lowest amount in RED.
| Station | Sep | Oct | Nov | Dec | Jan | Feb | Mar | Apr | May | Season |
| Arcadia | 0.0 | 0.0 | 1.0 | 1.5 | 8.5 | 8.5 | 0.1 | 1.5 | 4.0 | 25.1 |
| Aurora 4N | 0.0 | 0.0 | 0.2 | 1.4 | 1.8 | 2.7 | 1.0 | 0.0 | 0.0 | 7.1 |
| Beaver City | 0.0 | 0.0 | T | 2.5 | 1.0 | 1.0 | T | 1.1 | T | 5.6 |
| Belgrade | 0.0 | 0.0 | 1.5 | 0.8 | 6.1 | 4.6 | 1.2 | 1.0 | 1.0 | 16.2 |
| Blue Hill 4SW | 0.0 | 0.0 | MSG | 0.7 | 1.7 | 3.1 | T | 0.0 | 0.7 | MSG |
| Bradshaw | 0.0 | 0.0 | 0.2 | 1.7 | 1.9 | 2.8 | 1.2 | T | T | 7.8 |
| Bruning | 0.0 | 0.0 | 0.0 | 3.2 | 1.0 | MSG | MSG | MSG | 0.0 | MSG |
| Cambridge | 0.0 | 0.0 | 0.4 | 2.2 | 1.3 | 1.8 | 0.4 | 1.5 | 5.8 | 13.4 |
| Lexington 6SSE (Canaday) | 0.0 | 0.0 | 0.5 | 0.5 | 6.0 | 6.0 | 0.0 | 0.0 | 3.0 | 16.0 |
| Central City | 0.0 | 0.0 | 0.5 | 1.0 | 1.2 | 2.0 | 0.6 | MSG | MSG | MSG |
| Clay Center 6ESE | 0.0 | 0.0 | T | 1.0 | 4.0 | 1.9 | 0.4 | 0.0 | T | 7.3 |
| Clay Center | 0.0 | 0.0 | 0.0 | 0.5 | 3.5 | 4.0 | 0.8 | 0.0 | 0.0 | 8.8 |
| Cozad | 0.0 | 0.0 | 0.8 | T | 6.6 | 3.9 | 0.5 | T | 6.0 | 17.8 |
| Edison | 0.0 | 0.0 | T | 2.0 | 1.3 | 2.0 | T | T | T | 5.3 |
| Elwood 8S | 0.0 | 0.0 | 1.5 | 0.9 | 2.3 | 2.0 | T | 3.0 | 2.0 | 11.7 |
| Franklin | 0.0 | 0.0 | 0.0 | 2.5 | 0.5 | 1.0 | T | T | T | 4.0 |
| Geneva | 0.0 | 0.0 | 0.0 | 4.5 | 3.5 | 2.5 | 0.7 | 0.0 | 0.0 | 11.2 |
| Genoa 2W | 0.0 | 0.0 | 0.0 | T | 4.9 | 5.8 | 0.8 | T | 0.5 | 12.0 |
| Grand Island Airport | 0.0 | 0.0 | 0.4 | 1.4 | 2.4 | 3.5 | 1.2 | T | 0.3 | 9.2 |
| Greeley | 0.0 | 0.0 | 2.3 | 0.4 | 9.2 | 10.3 | 1.1 | 3.0 | 2.5 | 28.8 |
| Gresham 3W | 0.0 | 0.0 | T | T | 2.5 | 4.0 | T | 0.0 | 0.0 | 6.5 |
| Harlan County Lake | 0.0 | 0.0 | 0.0 | 1.0 | 0.5 | 0.6 | 0.0 | MSG | 0.0 | MSG |
| Hastings NWS | 0.0 | 0.0 | 0.1 | 1.0 | 3.7 | 4.3 | 1.2 | 0.2 | 0.6 | 11.1 |
| Hebron | 0.0 | 0.0 | 0.0 | 5.9 | 2.4 | 2.3 | 1.1 | 0.0 | T | 11.7 |
| Holdrege | 0.0 | 0.0 | T | 0.2 | 4.3 | 5.0 | T | 0.0 | 5.0 | 14.5 |
| Hubbell | 0.0 | 0.0 | 0.0 | 5.0 | 2.0 | 2.2 | T | 0.0 | T | 9.2 |
| Kearney Airport | 0.0 | 0.0 | 0.2 | 1.0 | 4.5 | 5.2 | 0.7 | T | 1.6 | 13.2 |
| Loup City | 0.0 | 0.0 | 0.2 | 0.2 | 7.5 | 5.6 | 0.3 | MSG | 1.0 | MSG |
| Miller | 0.0 | 0.0 | 0.7 | 0.2 | 6.7 | 6.3 | 1.8 | 0.7 | 5.7 | 22.1 |
| Minden | 0.0 | 0.0 | 0.0 | 0.6 | 3.6 | 4.4 | 1.0 | 1.0 | 1.0 | 11.6 |
| Naponee | 0.0 | 0.0 | T | 3.0 | 0.9 | 0.1 | T | T | 0.7 | 4.7 |
| Ord | 0.0 | 0.0 | 3.0 | 2.7 | 11.9 | 10.4 | 1.9 | 1.0 | 6.0 | 36.9 |
| Osceola | 0.0 | 0.0 | 1.0 | 1.9 | 1.7 | 4.8 | 0.5 | T | 0.4 | 10.3 |
| Oxford 6NNW | 0.0 | 0.0 | 0.3 | 3.3 | 2.6 | 2.2 | 0.5 | 2.3 | 1.5 | 12.7 |
| Polk | 0.0 | 0.0 | 0.5 | 1.0 | MSG | 3.0 | 2.0 | T | T | MSG |
| Ravenna | 0.0 | 0.0 | 1.0 | 0.8 | 6.6 | 4.5 | 1.0 | 1.0 | 2.0 | 16.9 |
| Red Cloud | 0.0 | 0.0 | 0.0 | 2.5 | 1.5 | 2.0 | T | 0.0 | T | 6.0 |
| St. Paul | 0.0 | 0.0 | 0.6 | 0.5 | 5.9 | 5.7 | 1.7 | T | T | 14.4 |
| Shelby 3NE | 0.0 | 0.0 | MSG | 2.5 | 4.1 | 6.0 | 0.8 | 0.0 | T | MSG |
| Shickley 4S | 0.0 | 0.0 | T | 3.5 | 1.5 | 3.0 | 2.0 | T | T | 10.0 |
| Superior | 0.0 | 0.0 | 0.0 | 2.1 | 0.5 | 1.3 | 0.2 | 0.0 | 0.0 | 4.1 |
| Wilsonville | 0.0 | 0.0 | T | 3.0 | 1.0 | 2.0 | 0.5 | 2.0 | 3.0 | 11.5 |
| York 3N | 0.0 | 0.0 | T | 1.0 | 2.5 | 4.3 | 0.9 | 0.0 | T | 8.7 |
( )... Partial month total due to some missing data
MSG...Missing due to no data available for month, or data appears unrepresentative
(*Please Note: All climate data presented here are preliminary and have not undergone final quality control by the National Centers for Environmental Information (NCEI). Therefore, these data are subject to revision. Final and certified climate data can be accessed at: WWW.NCDC.NOAA.GOV)
 |
This page was composed by the staff at the National Weather Service in Hastings, Nebraska. |
 |

