
Dangerous heat will expand from the Gulf Coast into the Southern Plains and Desert Southwest through week's end. Additional extreme heat impacting the Pacific Northwest will shift to the northern Plains by the weekend. Tropical Storm Bertha is expected to continue to impact portions of the northern Gulf Coast from the western Florida Panhandle to southeastern Louisiana through tonight. Read More >
| For a user-friendly, graphical/mapped version of daily, monthly, year-to-date etc. precipitation data, please see the following website: https://water.weather.gov/precip |
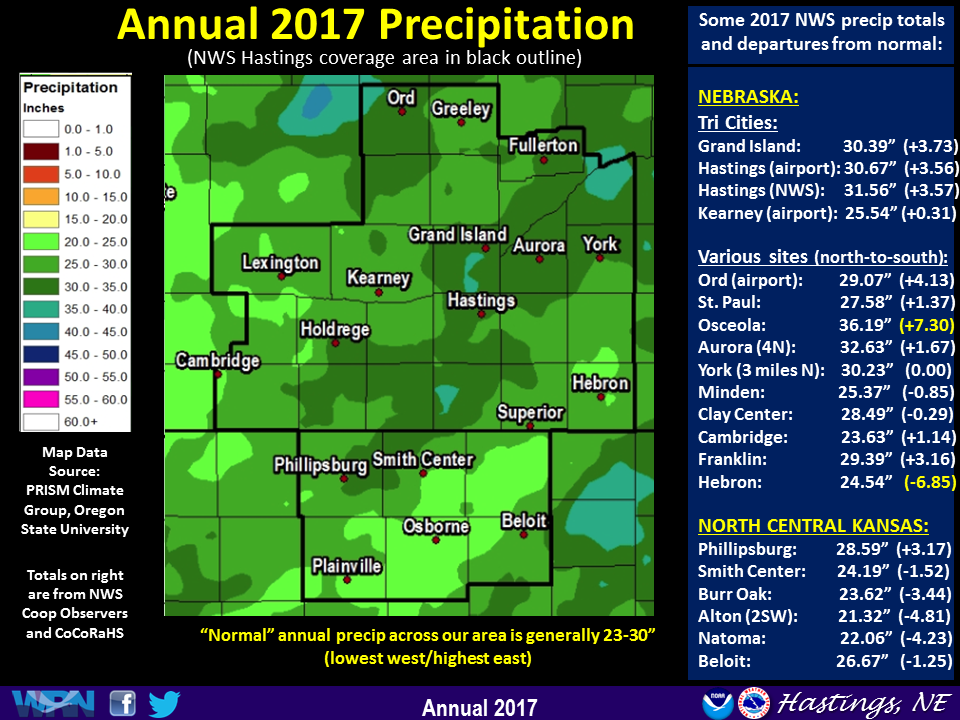
2017 Precipitation Summary for the Entire 30-county NWS Hastings coverage area (including 6 counties in north central KS):
Generally speaking, at least 75% of the 30-county NWS Hastings coverage area observed at least slightly ABOVE NORMAL precipitation during 2017, despite what ended up being a markedly-dry final two-and-half months from mid-October onward. Compared to 30-year normals, two of the overall-wettest official NWS stations included Osceola (7.30" above normal) and Ord airport (4.13" above). Of the roughly one-fourth/25% of the area that saw below normal 2017 precipitation, the majority of it was concentrated within or near the following counties: In KS: Osborne, Rooks, Smith, Jewell...In NE: Thayer, Fillmore. Within these areas, a few of the most glaring deficits included Hebron (6.85" below normal) and Natoma KS (4.23 below). All in all though, there really weren't any "bone dry" or "sopping wet" areas for the year as a whole, with most places ending up somewhere between 75-125% of normal/average totals.
As for outright-extremes (amount-wise) in north central KS, the driest of 18 primary NWS Cooperative Observer stations within the area was Glen Elder Lake (20.78") and the wettest site was Phillipsburg with 28.59".
2017 ANNUAL PRECIPITATION MAP
(ENTIRE NWS HASTINGS COVERAGE AREA)
 Click Image To Enlarge Click Image To Enlarge |
2017 NORTH CENTRAL KANSAS
NWS COOPERATIVE OBSERVER PRECIPITATION
(for 6 counties in the NWS Hastings coverage area)
(see bottom tables for winter 2016-2017 and 2017-2018 seasonal snowfall)
The highest reported amount under each month indicated in BLUE, the lowest amount in RED.
According to 30-year data from NCDC 1981-2010, normal annual precipitation across this six-county area generally ranges from 24-27", with the highest amounts favoring the eastern counties of Jewell and Mitchell.
| Station | Jan | Feb | Mar | Apr | May | Jun | July | Aug | Sep | Oct | Nov | Dec | 2017 Total |
| Alton 2SW | 1.57 | 0.07 | 1.56 | 3.69 | 5.46 | 1.88 | 1.59 | 1.83 | 2.09 | 1.32 | 0.16 | 0.10 | 21.32 |
| Beloit | 1.67 | T | 1.88 | 2.46 | 8.17 | 2.69 | 1.11 | 2.57 | 2.72 | 3.12 | 0.20 | 0.08 | 26.67 |
| Burr Oak 1N | 1.42 | 0.30 | 1.49 | 2.87 | 5.99 | 1.83 | 2.05 | 2.30 | 2.44 | 2.60 | 0.12 | 0.21 | 23.62 |
| Cawker City | 2.09 | 0.07 | 1.41 | 2.37 | 5.44 | 1.87 | 2.20 | 2.13 | 1.91 | 1.05 | 0.23 | 0.09 | 20.86 |
| Covert Rural | 1.56 | 0.03 | 1.85 | 4.66 | 6.87 | 0.78 | 1.82 | 1.80 | 1.22 | 1.57 | 0.31 | 0.22 | 22.69 |
| Glen Elder Lake | 1.86 | T | 1.38 | 1.61 | 7.87 | 1.33 | 1.41 | 2.04 | 1.97 | 1.12 | 0.09 | 0.10 | 20.78 |
| Ionia | 1.68 | 0.12 | 1.36 | 3.72 | 6.44 | 1.24 | 2.10 | 3.36 | 1.50 | 1.89 | 0.15 | 0.06 | 23.62 |
| Jewell | 1.48 | 0.16 | 1.42 | 3.19 | 5.57 | 1.72 | 2.26 | 3.23 | 2.71 | 1.99 | 0.16 | 0.13 | 24.02 |
| Kirwin Dam | 1.64 | 0.07 | 1.63 | 2.24 | 8.21 | 1.88 | 2.29 | 2.40 | 2.05 | 2.61 | 0.14 | 0.14 | 25.30 |
| Lebanon | 1.51 | 0.24 | 1.39 | 3.18 | 7.92 | 1.43 | 2.49 | 2.27 | 2.45 | 1.26 | 0.15 | 0.17 | 24.46 |
| Logan | 1.44 | T | 1.61 | 2.32 | 6.05 | 1.02 | 3.70 | 2.61 | 1.27 | 3.08 | 0.13 | 0.11 | 23.34 |
| Lovewell Dam | 1.18 | 0.17 | 1.43 | 1.87 | MSG | 2.08 | 2.43 | 2.53 | 2.39 | 1.50 | 0.10 | 0.20 | MSG |
| Mankato | MSG | MSG | MSG | 4.06 | 4.78 | 1.86 | 1.86 | 2.72 | 1.78 | 1.35 | MSG | MSG | MSG |
| Natoma | 1.50 | 0.02 | 1.81 | 4.04 | 5.96 | 1.17 | 0.98 | 2.78 | 1.88 | 1.54 | 0.26 | 0.12 | 22.06 |
| Phillipsburg | 1.49 | 0.01 | 1.43 | 3.80 | 7.23 | 1.19 | 4.00 | 2.38 | 1.59 | 5.35 | 0.05 | 0.07 | 28.59 |
| Plainville 4WNW | 1.01 | 0.04 | 1.92 | 3.75 | 7.26 | 2.76 | MSG | 2.07 | 2.63 | 0.94 | 0.29 | 0.13 | MSG |
| Smith Center | 1.46 | 0.27 | 1.26 | 3.32 | 7.03 | 1.31 | 3.26 | 2.05 | 2.67 | 1.36 | 0.09 | 0.11 | 24.19 |
| Webster Dam | 1.52 | T | 1.69 | 1.99 | 6.44 | 2.99 | 2.59 | 1.50 | 2.35 | 2.36 | 0.11 | 0.15 | 23.69 |
WINTER 2016-2017 NORTH CENTRAL KANSAS
COOPERATIVE OBSERVER SNOWFALL
The highest reported amount under each month indicated in BLUE, the lowest amount in RED.
| Station | Sep | Oct | Nov | Dec | Jan | Feb | Mar | Apr | May | Season |
| Alton 2SW | 0.0 | 0.0 | 0.0 | 6.5 | 3.0 | 1.0 | 2.0 | 0.0 | T | 12.5 |
| Beloit | 0.0 | 0.0 | 0.0 | 2.0 | 1.0 | T | 0.0 | 0.0 | 0.0 | 3.0 |
| Burr Oak 1N | 0.0 | 0.0 | 0.0 | 2.8 | T | 1.7 | 0.5 | T | 0.2 | 5.2 |
| Cawker City | 0.0 | 0.0 | 0.0 | 1.7 | 1.0 | T | 0.5 | 0.0 | 0.0 | 3.2 |
| Covert Rural | 0.0 | 0.0 | 0.0 | 4.0 | 3.0 | 0.3 | 1.5 | 0.0 | 0.0 | 8.8 |
| Ionia | 0.0 | 0.0 | 0.0 | 4.4 | 0.9 | 0.5 | 0.7 | 0.0 | 0.0 | 6.5 |
| Jewell | 0.0 | 0.0 | 0.0 | 3.9 | 1.0 | 0.2 | 1.0 | 0.0 | 0.0 | 6.1 |
| Kirwin Dam | 0.0 | 0.0 | 0.0 | MSG | MSG | 0.5 | 0.0 | 0.0 | 0.0 | MSG |
| Lebanon | 0.0 | 0.0 | 0.0 | 3.7 | 0.2 | 1.1 | 0.3 | 0.0 | 0.0 | 5.3 |
| Logan | 0.0 | 0.0 | 0.0 | 1.0 | 3.0 | T | 1.0 | 0.0 | 3.0 | 8.0 |
| Lovewell Dam | 0.0 | 0.0 | 0.0 | MSG | T | T | T | 0.0 | 0.0 | MSG |
| Natoma | 0.0 | 0.0 | 0.0 | 3.0 | 2.0 | 0.5 | 1.0 | 0.0 | 0.0 | 6.5 |
| Phillipsburg | 0.0 | 0.0 | 0.0 | 0.7 | 0.9 | 0.2 | 0.0 | 0.0 | 0.5 | 2.3 |
| Plainville 4WNW | 0.0 | 0.0 | 0.0 | 4.2 | 2.0 | T | 1.0 | 0.0 | 2.3 | 9.5 |
| Smith Center | 0.0 | 0.0 | 0.0 | 3.1 | 1.1 | 1.8 | 0.2 | 0.0 | 0.0 | 6.2 |
| Webster Dam | 0.0 | 0.0 | 0.0 | 0.5 | 3.8 | T | 0.0 | 0.0 | 0.0 | 4.3 |
WINTER 2017-2018 NORTH CENTRAL KANSAS
COOPERATIVE OBSERVER SNOWFALL
The highest reported amount under each month indicated in BLUE, the lowest amount in RED.
T* indicated hail was reported during the month.
| Station | Sep | Oct | Nov | Dec | Jan | Feb | Mar | Apr | May | Season |
| Alton 2SW | 0.0 | 0.0 | 1.0 | 1.0 | 3.0 | 5.0 | T | 1.0 | 0.0 | 11.0 |
| Beloit | 0.0 | 0.0 | T | 1.5 | 3.0 | 7.5 | 0.0 | T | 0.0 | 12.0 |
| Burr Oak 1N | 0.0 | 0.0 | 0.2 | 2.6 | 5.7 | 8.6 | T | 3.2 | 0.0 | 20.3 |
| Cawker City | 0.0 | 0.0 | T | 1.0 | 1.0 | 3.9 | 0.0 | 1.7 | 0.0 | 7.6 |
| Covert Rural | 0.0 | 0.0 | 0.0 | 4.0 | 7.5 | 2.5 | 1.0 | 0.0 | 0.0 | 15.0 |
| Glen Elder Lake | 0.0 | 0.0 | T | 1.0 | 1.0 | MSG | 0.0 | MSG | 0.0 | MSG |
| Ionia | 0.0 | 0.0 | T | 1.1 | 1.9 | 6.2 | T | 1.7 | 0.0 | 10.9 |
| Jewell | 0.0 | 0.0 | T | 1.5 | 4.2 | 7.0 | 1.0 | 2.0 | 0.0 | 15.7 |
| Kirwin Dam | 0.0 | 0.0 | T | 1.5 | 3.0 | 6.4 | 0.0 | 0.0 | 0.0 | 10.9 |
| Lebanon | 0.0 | 0.0 | 0.1 | 1.7 | 3.5 | 7.8 | T | 2.5 | 0.0 | 15.6 |
| Logan | T* | T | T | 2.0 | 5.0 | 7.0 | T | 1.0 | 0.0 | 15.0 |
| Lovewell Dam | 0.0 | 0.0 | 0.0 | 2.4 | 1.0 | MSG | 0.0 | MSG | 0.0 | MSG |
| Natoma | 0.0 | 0.0 | 1.0 | 2.5 | 6.0 | 2.0 | 2.0 | 1.0 | 0.0 | 14.5 |
| Phillipsburg | 0.0 | 0.0 | 0.7 | 1.3 | 5.1 | 0.9 | 0.1 | 1.0 | 0.0 | 9.1 |
| Plainville 4WNW | 0.0 | 0.0 | 0.3 | 4.0 | 10.8 | 4.8 | 2.3 | 0.7 | 0.0 | 22.9 |
| Smith Center | 0.0 | 0.0 | 0.2 | 2.0 | 3.5 | 7.6 | T | 2.0 | 0.0 | 15.3 |
| Webster Dam | 0.0 | 0.0 | T | 3.5 | 5.0 | 4.0 | 0.0 | 0.0 | 0.0 | 12.5 |
( )... Partial month total due to some missing data
MSG...Missing due to no data available for month, or data appears unrepresentative
(*Please Note: All climate data presented here are preliminary and have not undergone final quality control by the National Climatic Data Center (NCDC). Therefore, these data are subject to revision. Final and certified climate data can be accessed at: WWW.NCDC.NOAA.GOV)
 |
Media use of NWS Web News Stories is encouraged! Please acknowledge the NWS as the source of any news information accessed from this site. |
|

