
Thunderstorms with severe wind gusts and hail will be possible today across parts of the central Plains, and from the Missouri Valley into the upper Mississippi Valley. Heavy rain associated with the thunderstorms may also produce flash/urban flooding. Critical fire weather conditions expected in the Great Basin and interior Northwest. Dangerous heat continues across the Southwest and Southeast. Read More >
(Click on the links in gray boxes below to quickly jump to information located farther down the page)
| Tri-Cities & Ord Details & Monthly Extremes |
Graphs, Tables, Maps | Drought Monitor Graphics |
Monthly Precipitation & Snowfall Tables & Archive of These Monthly Reviews |
* Please Note: All climate data presented here are preliminary and have not undergone final quality control by the National Climatic Data Center (NCDC). Therefore, these data are subject to revision. Final and certified climate data can be accessed at: WWW.NCDC.NOAA.GOV.
January 2014 Climate And Weather Review For South Central Nebraska
And Portions Of North Central Kansas
...Similar To Dec. 2013: Continued Dry and Lacking Significant Snow...With A Notable “Roller Coaster” Ride in Temperatures...
The following narrative focuses on climate and weather highlights for the month of January 2014 across the NWS Hastings coverage area, encompassing 24 counties in south central and central Nebraska, and 6 counties in north central Kansas. Click HERE for a map of this coverage area. The temperature and precipitation data presented here are largely based on the NWS Cooperative Observer network, along with data from a handful of automated airport sites. All climate averages and "normals" presented here are based on the official NCDC 1981-2010 normals.
- TEMPERATURES...(According to 30-year averages, "normal" January high temperatures range from 35-38° across northern portions of the area generally north of Interstate 80, and from 36-41° across southern portions of the area including North Central Kansas. Low temperatures typically average between 10-15° across the northern half of the area, and 14-18° in southern counties...)
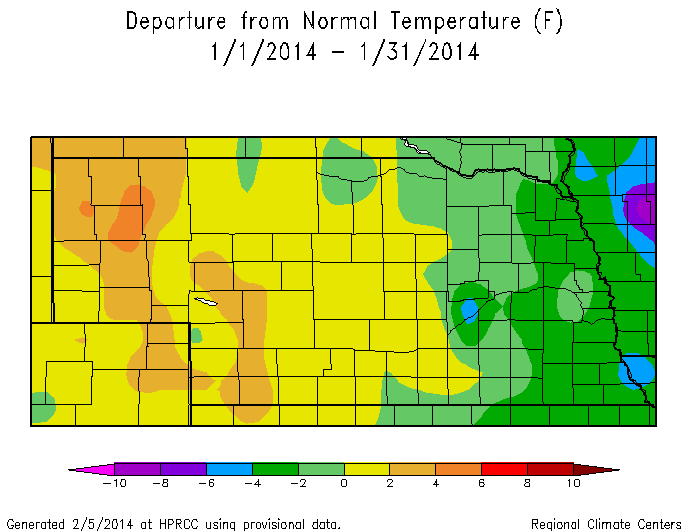
Based on the monthly mean temperature (resulting from averaging together the daily highs and lows), the majority of the NWS Hastings coverage area ended up within 1.5° either side of the 30-year January normal. However, there was a slight west-to-east disparity, with most locations west of Highway 281 averaging slightly above normal and most locations east of Highway 281 slightly below normal. Very similar to temperature trends during December 2013, January 2014 continued to ride a significant temperature "roller coaster", with multiple sharp upward/downward swings. As evidence of this, Hastings and Grand Island featured 12 and 11 days, respectively, with a high temperature at least 15° warmer or colder than the previous day! The most dramatic example of this at both sites occurred between the 26th-27th, as the high temperature plunged from 57 to 16°, a notable 41° drop.
At Hastings airport, where temperature trends were generally representative of much of the 30-county as a whole, 18 days of the month featured an above normal mean temperature, including 11 consecutive days between the 10th-20th. Meanwhile, 12 days had a below normal mean, including 6 of the first 9 days. Breaking down the month into week-long chunks, the overall-warmest week across most of the coverage area in terms of daily high temperatures was centered from the 13th-19th. During these 7 days, Grand Island reached at least 43° each day and the cooperative observer near Alton KS reached at least 46° each day. The 19th was hands-down the warmest day of the month across the entire coverage area, as all places soared into the mid-upper 60s, including daily-record breaking values of 68° at Grand Island and 67° at Hastings. On the colder side of things, nearly all places experienced their coldest week of the month right off the bat between the 1st-7th. Four of the first six days of the month climbed no higher than 24° at Beloit KS, 21° at Hastings and 11° at Osceola. For the majority of the area, the coldest low temperature of the month occurred on the 6th when the mercury plunged somewhere between 5 and 15° below zero in most locations. In the wake of the coldest and warmest stretches of the month, the final one-third of January featured several up-and-down temperature swings.
Per NWS cooperative observers and a few automated airport sites, the 19th was clearly the warmest day of the month across the area, with a few of the highest readings featuring 69° at Beaver City, Ravenna and four miles west-northwest of Plainville KS, and 68° at several locations including Grand Island airport, Aurora airport, Hebron and two miles southwest of Alton KS. On the much-colder side of things, nearly all places recorded their coldest sub-zero readings on the 6th, highlighted by frigid lows of -15° at Gothenburg, -14° at Beaver City and -13° at Holdrege. Among the Nebraska Tri-Cities official temperature stations, Grand Island airport claimed the warmest January reading of 68° on the 19th, while the cooperative observer at the Kearney airport notched the coldest low of -9° on the 6th.
(Please look farther down the page for more information on January 2014 temperatures and extremes, including detailed breakdowns for Grand Island, Hastings, Kearney and Ord...)
- PRECIPITATION/SNOWFALL/FLOODING...(According to 30-year averages, "normal" January precipitation (rainfall and snow liquid equivalent) across most of the 30-county area ranges somewhere between 0.40-inch and 0.70-inch, with the highest amounts favoring eastern areas closest to the Highway 81 corridor such as York, Hebron and Beloit. Normal January snowfall ranges from 5-7 inches across most of South Central Nebraska, and 3-5 inches in North Central Kansas...)
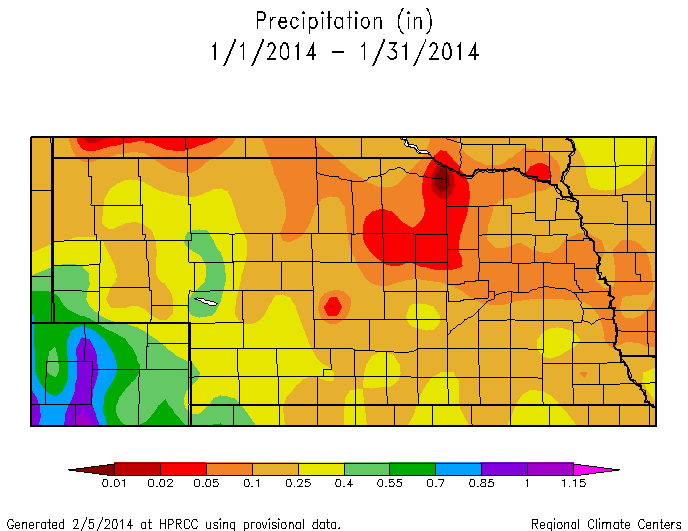
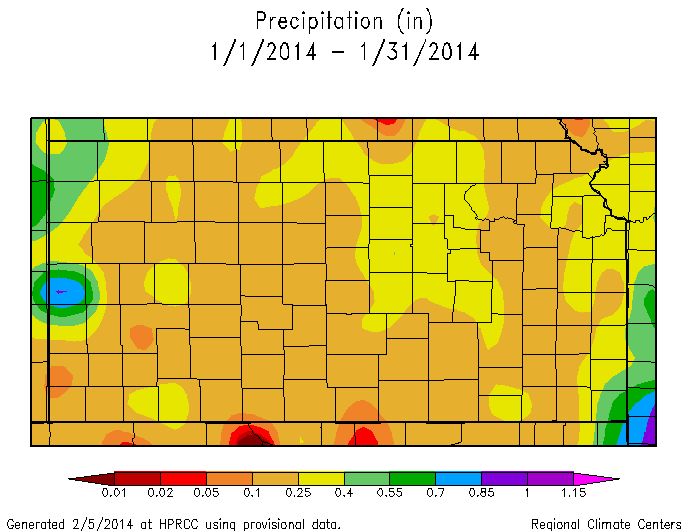
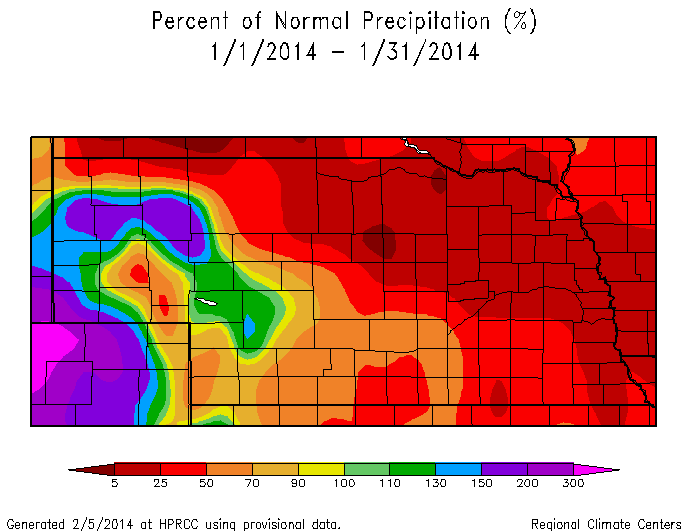
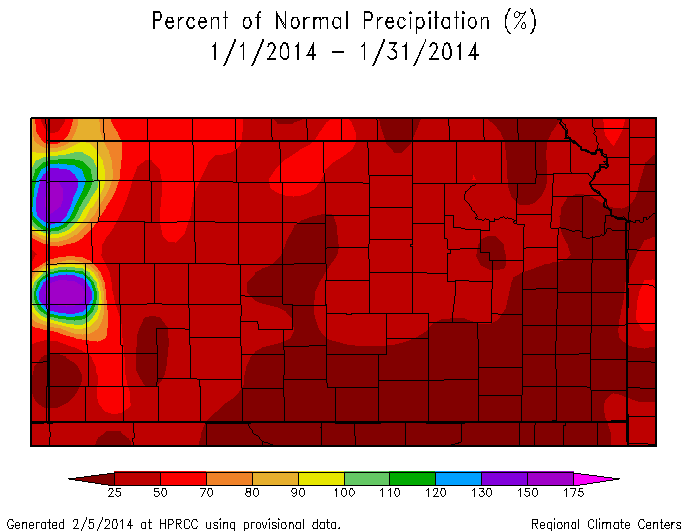
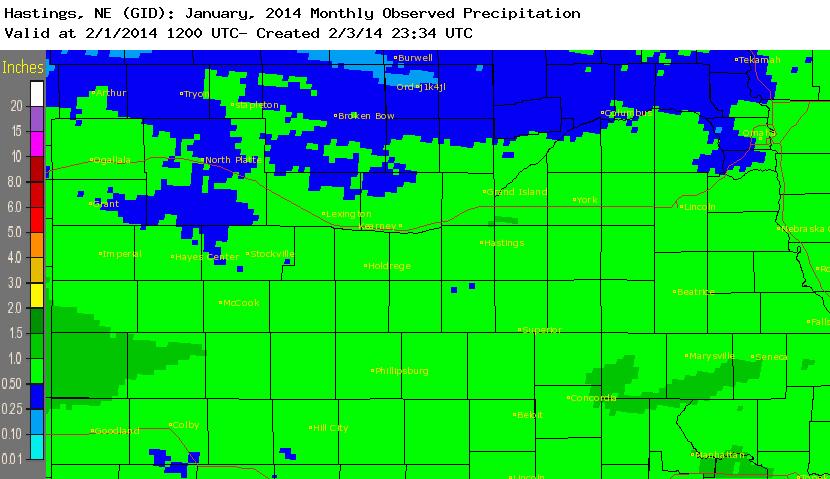
Precipitation trends during January were likely viewed in varying ways depending on one's perspective: For those not a fan of significant snowfall, it was a decent month with most areas observing no more than 5". However, for those more interested in a continued recovery from drought conditions over the past few years, January was another setback as the entire area observed below normal precipitation for the 2nd-consecutive month. In fact, roughly two-thirds of the 30-county area received no more than HALF OF NORMAL JANUARY PRECIPITATION based on 30-year normals. Not only was January another quite-dry month across the area, but it was also a bit unusual in that most places observed the majority of monthly precipitation/snowfall on both the first and last days of the month, with very little in between. Serving as two prime examples of this: (1) At Hastings, Jan. 1st and 31st combined to feature 0.31" of precipitation and 4.6" of snowfall, while the other 29 days of January only totaled 0.04" precipitation and 0.8" of snow...(2) the NWS cooperative observer at Smith Center KS observed a combined 0.24" of precipitation and 6.3" of snowfall on the 1st and 31st, and only 0.11" of precipitation and 0.6" of snow during the rest of the month. Thanks to not only a drier-than-normal December and January, but also a dry final 3 weeks of November, many places had a Top-5 driest 86-day stretch between the dates of Nov. 6-Jan. 30, including Grand Island airport, Kearney, Hastings, Osceola, Hebron, Holdrege, Beloit KS and two miles southwest of Alton KS. More specifically at Grand Island airport, it was the 3rd-driest Nov. 6-Jan. 30 stretch on record with only 0.33", and was the driest since 1980-1981.
Based on reports from around 65 NWS Cooperative Observers and a few automated airport gauges, along with use of radar-derived estimation (which is generally not very useful during the winter), the entire area fell short of normal January precipitation as most locations only totaled somewhere between 0.10-0.32" of liquid-equivalent precipitation. Contrary to what is often the case, there were really no well-defined portions of the 30-county area that stood out as being particularly dry. A few of the lowest Cooperative Observer precipitation totals for January featured 0.01" at Red Cloud, 0.04" at Hubbell, 0.05" at Hebron and 0.06" at Ord airport, Greeley and 3 miles northeast of Shelby. On the somewhat "wetter" side of things were locations including 2 miles northeast of Upland (0.43"), Clay Center and Hastings airport (0.37"), Mankato KS (0.36") and Smith Center KS (0.35"). January precipitation totals at the official Nebraska Tri-Cities airport sites featured 0.37" at Hastings, 0.32" at Grand Island and 0.28" at Kearney.
As for January 2014 snowfall, the majority of the 30-county area measured near-to-slightly-below normal amounts somewhere between 2-5", and as previously outlined, much of this snow fell on the 1st and/or the 31st, with comparably little in between. Per Cooperative Observers, a few of the highest monthly totals occurred at Mankato KS (7.0"), Smith Center KS (6.9"), Kirwin Dam KS and one mile north of Long Island KS (6.0") and 8 miles south of Elwood (5.5"). In contrast, some of the lowest totals were reported at Cawker City KS (0.5"), Greeley (0.8") and Hunter KS and Red Cloud (1.0"). In between these extremes, official Tri-Cities snowfall totaled 5.4" at Hastings, 4.5" at Grand Island and 2.8" at Kearney. Through January 31st, Grand Island had only totaled 6.9" of season-to-date snowfall, under half of the 30-year normal of 15.8".
As for flooding issues, as is often the case during times of significant temperature fluctuations during winter, the local area became prone to at least minor ice jam flooding. Toward the very end of the month, mainly on/after the 28th, the most notable ice jam flooding of the winter-so-far began to affect the north channel of the Platte River in southern Buffalo County, primarily from just downstream of Kearney to areas south of the Interstate 80 Gibbon interchange. This flooding actually worsened during the first few days of February, and even affected some homes in the Sweetwater Avenue area just southeast of Kearney before waters receded by Feb. 3.
(Please look farther down the page for more information on January 2014 precipitation/snowfall and extremes, including rankings of wettest and driest locations, percent-of-normal plots, and a detailed breakdown for Grand Island, Hastings, Kearney and Ord. In addition, the link on the far upper right of this page contains an archive of monthly/annual precipitation and snowfall totals for around 70 locations.)
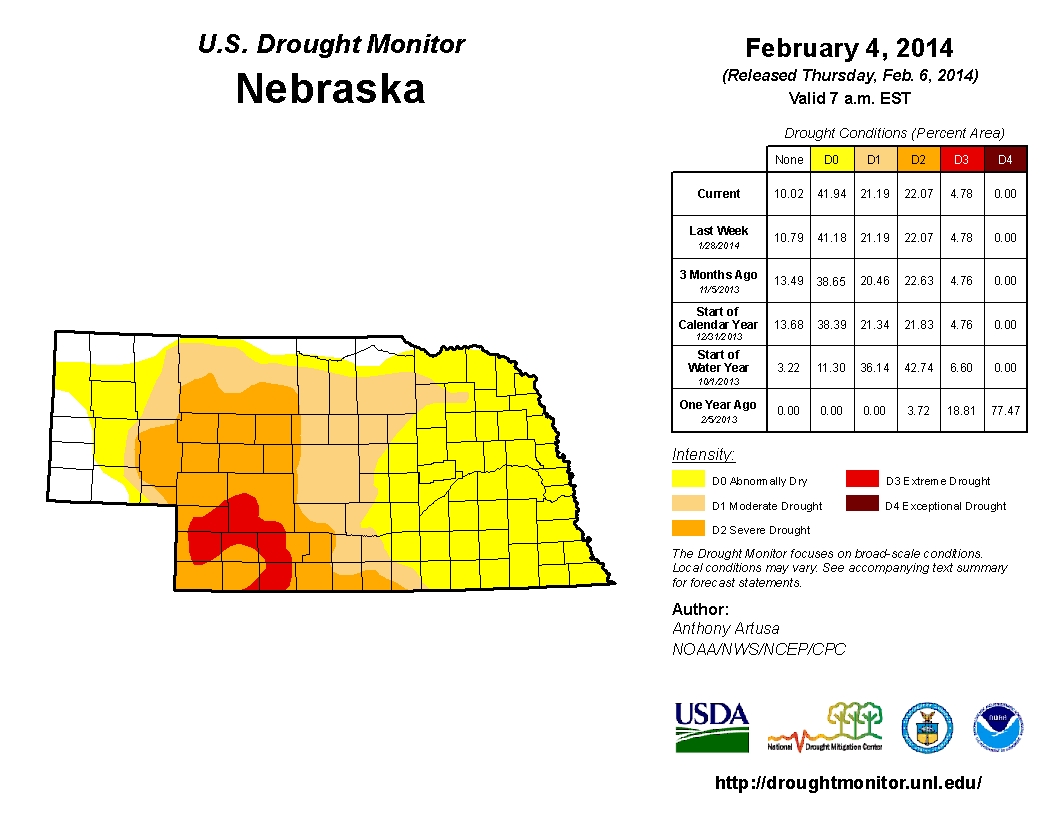
- DROUGHT STATUS (see images at bottom of page)...Given the 2nd-consecutive month of solidly below normal precipitation area-wide, it was inevitable that parts of the area started to suffer a degradation in drought classificiation during January according to the U.S. Drought Monitor. The majority of worsening conditions occurred within the six North Central Kansas counties, where Category D2 Severe Drought expanded eastward from western Phillips and Rooks counties, to now include all of Phillips, Rooks, Smith and Osborne counties, along with western Jewell and Mitchell. Meanwhile, eastern portions of Jewell and Mitchell counties degraded to Category D1 Moderate Drought. As a result, North Central Kansas now contained the most areal coverage of D2-or-worse Drought since mid-summer 2013. Farther north across the 24 Nebraska counties in the NWS Hastings coverage area, there was actually very little change in drought classification during January, thus maintaining a west (worse) to east (better) disparity. The only January change of note involved southeastern Franklin and southwestern Webster counties, which degraded from D1 Moderate to D2 Severe Drought. As a result, these areas joined the pre-existing D2 Drought area that already covered several southwestern counties including all/most of Furnas, Gosper, and Harlan, along with smaller portions of Dawson and Phelps. Meanwhile, a fairly narrow corridor of D1 Moderate Drought continued to border up against the D2 area, and covered the majority of several counties mainly west of Highway 281 including Valley, Sherman, Kearney, Phelps and Webster. Finally, nearly all locations along/east of the Highway 281 corridor in the local area (including 13 entire counties and portions of others) remained in Category D0 Abnormally Dry classification at month's end (considered to be one category better than "true" drought). Looking beyond the borders of the NWS Hastings coverage area, there was hardly any increase in the total areal coverage of D1 Moderate to D3 Extreme Drought across the entire state of Nebraska during January, while Kansas observed a noticeable increase: As of Feb. 4, 48% of Nebraska and 63% of Kansas were assigned D1-or-worse Drought (compared to 48% and 47%, respectively, back on Dec. 31). In both states, there remained a notable west-to-east disparity, with the worst conditions in the west and somewhat better conditions in the east.
- SEVERE THUNDERSTORMS/HIGH WINDS...As was the case in December 2013, there were no thunderstorms within the NWS Hastings coverage area during January 2014, let alone severe storms. However, January was marked by several very windy days...including at least 5 days that featured a fairly widespread coverage of peak gusts 50+ MPH, and in some places 60-70 MPH. Remarkably, 4 of these very windy days occurred EVERY-OTHER DAY during an 8-day period starting on the 14th and lasting through the 20th. The final very windy day of the month arrived on the 26th. At automated airport sites across the area, a few of the peak gusts during the month included 65 MPH at Grand Island on the 20th, 62 MPH at Hastings on the 16th, 63 MPH at Ord on the 16th and 60 MPH at Beloit KS on the 26th. Each of these wind events featured a north-northwest wind direction...and was associated with a strong "clipper" low pressure system passing just east of the region as it dove southward out of Canada. These windy weather systems brought no measurable precipitation to the local area, and as a result, the combination of lacking snow cover, dry vegetation and strong winds helped spark several localized wildfires within the area during the month. For much more information on all of these January wind events, PLEASE REFER TO THE INDIVIDUAL STORY LINKS FOUND NEAR THE TOP OF THIS PAGE.
- Number of Severe Thunderstorm Warning polygons issued by NWS Hastings in January 2014: Zero (same as last January...the last warnings issued in January were back on Jan. 28, 2006)
- Number of Tornado Warning polygons issued by NWS Hastings in January 2014: ZERO (same as last January)
- Number of confirmed tornadoes within the NWS Hastings coverage area in January 2014: ZERO (same as last January)
Click on the link below for January 2014 climate summaries specifically for Grand Island, Hastings, Kearney and Ord
Grand Island - Hastings - Kearney - Ord
|
...JANUARY 2014 TEMPERATURE/RAINFALL EXTREMES FROM ...A FEW OF THE WARMEST HIGH TEMPERATURES DURING JANUARY 2014 |
Various graphs and tables depicting January 2014 climate data for
South Central Nebraska and North Central Kansas:
* Please Note: These data are preliminary and have not undergone final quality control by the National Climatic Data Center (NCDC). Therefore, these data are subject to revision. Final and certified climate data can be accessed at WWW.NCDC.NOAA.GOV
 |
 |
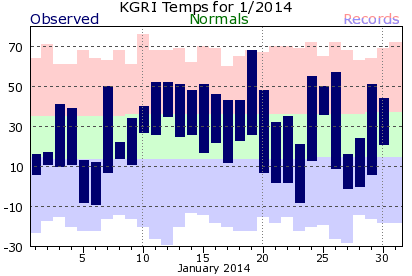
| Grand Island Temperature Summary: Observed daily maximum and minimum temperatures are connected by blue bars. Area between normal maximum and minimum temperatures is shaded green. Red bars connect record high temperatures. Blue bars connect record low temperatures. |
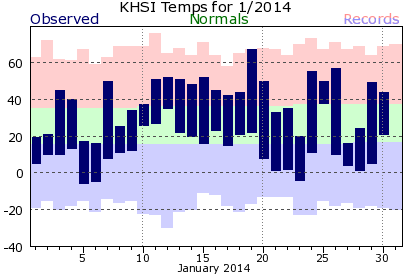
Hastings Temperature Summary: Observed daily maximum and minimum temperatures are connected by blue bars. Area between normal maximum and minimum temperatures is shaded green. Red bars connect record high temperatures. Blue bars connect record low temperatures. |
 |
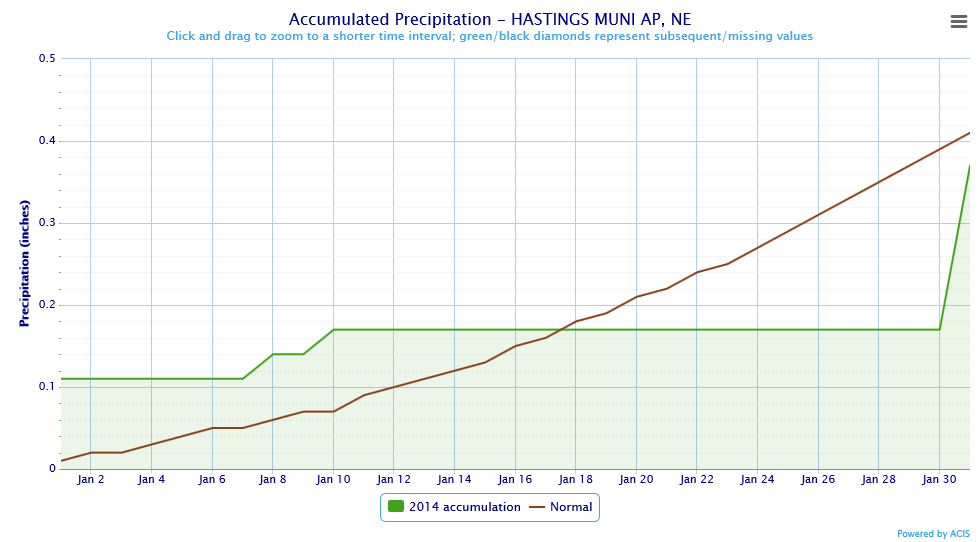 |
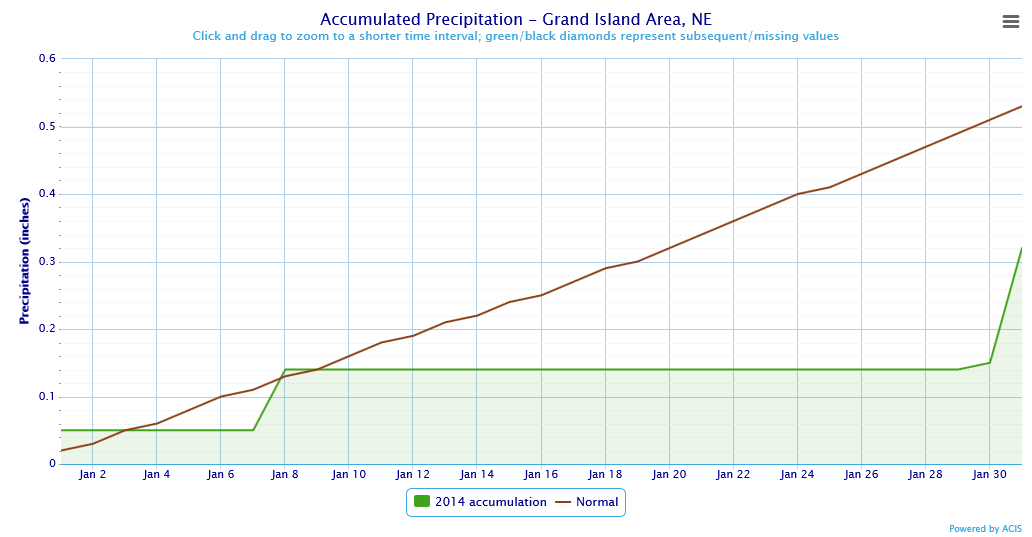
| Grand Island Precipitation Summary: Green line indicates cumulative observed precipitation for January 2014. Brown line indicates "normal" January precipitation based on 30-year data from 1981-2010. | Hastings Precipitation Summary: Green line indicates cumulative observed precipitation for January 2014. Brown line indicates "normal" January precipitation based on 30-year data from 1981-2010. |
| Grand Island (Regional Airport) - Jan. 2013 - Jan. 2014 | |||||||||||||||||||||||||
| Jan. 2013 | Feb. | Mar. | Apr. | May | June | July | Aug. | Sep. | Oct. | Nov. | Dec. | Jan. | |||||||||||||
| Average High (F) | 35.9 | 40.9 | 48.0 | 58.2 | 72.4 | 84.8 | 87.6 | 85.8 | 82.5 | 64.0 | 50.6 | 37.1 | 38.5 | ||||||||||||
| Average Low (F) | 16.8 | 20.5 | 24.2 | 33.9 | 50.6 | 60.4 | 65.0 | 66.0 | 58.0 | 40.4 | 25.5 | 12.6 | 12.7 | ||||||||||||
| Average Temperature (F) | 26.4 | 30.7 | 36.1 | 46.1 | 61.5 | 72.6 | 76.3 | 75.9 | 70.2 | 52.2 | 38.1 | 24.9 | 25.6 | ||||||||||||
| Departure from Normal (F) | +1.3 | +1.6 | -3.3 | -4.5 | +0.3 | +1.3 | +0.1 | +1.9 | +5.1 | 0.0 | 0.0 | -1.8 | +0.5 | ||||||||||||
| Precipitation (inches) | 0.16 | 0.97 | 1.64 | 3.83 | 6.77 | 1.63 | 1.39 | 3.02 | 2.38 | 4.05 | 0.97 | 0.11 | 0.32 | ||||||||||||
| Departure from Normal | -0.37 | +0.29 | -0.16 | +1.30 | +2.36 | -2.67 | -2.01 | -0.10 | +0.15 | +2.19 | -0.20 | -0.52 | -0.21 | ||||||||||||
| Snowfall (inches) | 0.6 | 11.0 | 6.2 | 6.9 | 0.7 | 0.0 | 0.0 | 0.0 | 0.0 | 0.0 | 0.2 | 2.2 | 4.5 | ||||||||||||
| Departure from Normal | -5.9 | +4.7 | +0.8 | +5.4 | +0.7 | 0.0 | 0.0 | 0.0 | -0.1 | -1.0 | -2.9 | -2.9 | -2.0 | ||||||||||||
| Hastings (Municipal Airport) - Jan. 2013 - Jan. 2014 | |||||||||||||||||||||||||
| Jan. 2013 | Feb. | Mar. | Apr. | May | June | July | Aug. | Sep. | Oct. | Nov. | Dec. | Jan. | |||||||||||||
| Average High (F) | 33.8 | 40.1 | 48.0 | 57.3 | 71.6 | 83.1 | 86.1 | 84.6 | 82.3 | 63.4 | 49.9 | 36.3 | 39.0 | ||||||||||||
| Average Low (F) | 15.5 | 19.7 | 24.5 | 33.2 | 49.5 | 60.3 | 64.4 | 65.3 | 57.6 | 40.4 | 25.1 | 12.4 | 12.8 | ||||||||||||
| Average Temperature (F) | 24.7 | 29.9 | 36.3 | 45.3 | 60.5 | 71.7 | 75.2 | 75.0 | 69.9 | 51.9 | 37.5 | 24.3 | 25.9 | ||||||||||||
| Departure from Normal (F) | -1.3 | 0.0 | -3.6 | -5.4 | -0.8 | -0.1 | -1.9 | +0.7 | +4.3 | -0.7 | -1.2 | -3.3 | -0.1 | ||||||||||||
| Precipitation (inches) | 0.32 | 0.90 | 2.25 | 2.66 | 5.67 | 1.24 | 1.77 | 3.25 | 1.26 | 4.75 | 1.00 | 0.14 | 0.37 | ||||||||||||
| Departure from Normal | -0.09 | +0.41 | +0.46 | +0.10 | +1.10 | -2.56 | -1.97 | -0.05 | -1.30 | +2.76 | -0.29 | -0.47 | -0.04 | ||||||||||||
| Snowfall NWS Office (inches) | 2.5 | 10.5 | 7.9 | 3.7 | 0.3 | 0.0 | 0.0 | 0.0 | 0.0 | 0.0 | 0.4 | 5.0 | 5.4 | ||||||||||||
| Departure from Normal | -3.5 | +4.0 | +2.7 | +2.5 | +0.3 | 0.0 | 0.0 | 0.0 | -0.2 | -1.0 | -2.2 | -1.1 | -0.6 | ||||||||||||
| Kearney (Regional Airport) - Jan. 2013 - Jan. 2014 (*Temperature data is from unofficial automated AWOS sensor while precipitation data is from official NWS Cooperative Observer) |
|||||||||||||||||||||||||
| Jan. 2013 | Feb. | Mar. | Apr. | May | June | July | Aug. | Sep. | Oct. | Nov. | Dec. | Jan. | |||||||||||||
| Average High (F)* | 35.6 | 41.3 | 49.5 | 57.3 | 72.7 | 83.8 | 85.5 | 85.7 | 82.8 | 63.0 | 49.9 | 36.9 | 39.0 | ||||||||||||
| Average Low (F)* | 15.4 | 19.0 | 23.9 | 32.4 | 49.4 | 59.5 | 62.5 | 63.9 | 55.9 | 39.5 | 25.2 | 12.6 | 12.6 | ||||||||||||
| Average Temperature (F)* | 25.5 | 30.1 | 36.7 | 44.9 | 61.0 | 71.7 | 74.0 | 74.8 | 69.3 | 51.2 | 37.5 | 24.7 | 25.8 | ||||||||||||
| Departure from Normal (F)* | +0.9 | +2.0 | -1.0 | -3.8 | +1.5 | +1.9 | -0.7 | +2.2 | +5.8 | +0.3 | +0.5 | -1.2 | +1.2 | ||||||||||||
| Precipitation (inches) | 0.14 | 0.74 | 0.62 | 4.37 | 6.54 | 1.44 | 1.98 | 2.19 | 3.77 | 3.73 | 0.72 | 0.10 | 0.28 | ||||||||||||
| Departure from Normal | -0.35 | +0.19 | -1.17 | +2.14 | +2.36 | -2.49 | -1.30 | -0.89 | +1.70 | +1.69 | -0.30 | -0.47 | -0.21 | ||||||||||||
| Snowfall (inches) | 1.2 | 8.5 | 2.3 | 2.5 | Trace | 0.0 | 0.0 | 0.0 | 0.0 | 0.0 | Trace | 2.7 | 2.8 | ||||||||||||
| Departure from Normal | -3.2 | +3.4 | -2.3 | +0.7 | 0.0 | 0.0 | 0.0 | 0.0 | -0.2 | -0.7 | -3.1 | -0.8 | -1.6 | ||||||||||||
| Ord (Evelyn Sharp Field Airport) - Jan. 2013 - Jan. 2014 (*Winter precipitation data may include coop observer reports due to automated airport equipment under-measuring snowfall liquid equivalent) |
|||||||||||||||||||||||||
| Jan. 2013 | Feb. | Mar. | Apr. | May | June | July | Aug. | Sep. | Oct. | Nov. | Dec. | Jan. | |||||||||||||
| Average High (F) | 38.3 | 40.4 | 46.7 | 56.5 | 71.0 | 81.0 | 85.9 | 84.4 | 81.9 | 61.0 | 48.7 | MSG | 38.3 | ||||||||||||
| Average Low (F) | 12.0 | 16.6 | 20.1 | 28.9 | 46.9 | 56.5 | 60.9 | 62.5 | 54.3 | 35.0 | 20.3 | MSG | 9.8 | ||||||||||||
| Average Temperature (F) | 25.2 | 28.5 | 33.4 | 42.7 | 59.0 | 68.8 | 73.4 | 73.5 | 68.1 | 48.0 | 34.5 | MSG | 24.0 | ||||||||||||
| Departure from Normal (F) | +0.6 | +0.7 | -4.3 | -6.1 | -0.3 | -0.4 | -1.0 | +0.5 | +4.5 | -1.6 | -1.8 | MSG | -0.6 | ||||||||||||
| Precipitation (inches)* | 0.14 | 1.48 | 0.61 | 2.51 | 5.40 | 1.93 | 3.59 | 3.77 | 2.80 | 1.62 | 0.50 | Trace | 0.06 | ||||||||||||
| Departure from Normal | -0.23 | +1.04 | -0.84 | -0.08 | +1.59 | -2.19 | +0.62 | +0.61 | +0.36 | -0.31 | -0.57 | -0.59 | -0.31 | ||||||||||||
| Snowfall (Coop Observer) | 0.5 | 8.0 | 4.0 | 7.0 | Trace | 0.0 | 0.0 | 0.0 | 0.0 | 0.0 | 3.5 | 0.5 | 2.5 | ||||||||||||
| Departure from Normal | -6.3 | +2.0 | -1.9 | +4.5 | 0.0 | 0.0 | 0.0 | 0.0 | 0.0 | -1.1 | -1.8 | -6.9 | -4.3 | ||||||||||||
| Smith Center, KS (Cooperative Observer) - Jan. 2013 - Jan. 2014 (*All data from coop observer with daily 24-hour obs taken around 7 AM. As a result, data may vary slightly from true "calendar day" averages) |
|||||||||||||||||||||||||
| Jan. 2013 | Feb. | Mar. | Apr. | May | June | July | Aug. | Sep. | Oct. | Nov. | Dec. | Jan. | |||||||||||||
| Average High (F)* | 37.8 | 43.0 | 50.3 | 60.0 | 76.0 | 88.6 | 89.2 | 88.9 | 86.1 | 68.4 | 52.8 | 38.9 | 41.4 | ||||||||||||
| Average Low (F)* | 14.8 | 18.2 | 23.8 | 32.8 | 49.6 | 59.6 | 64.6 | 64.6 | 58.1 | 40.2 | 25.5 | 13.8 | 12.7 | ||||||||||||
| Average Temperature (F)* | 26.3 | 30.6 | 37.1 | 46.4 | 62.8 | 74.1 | 76.9 | 76.8 | 72.1 | 54.3 | 39.2 | 26.4 | 27.1 | ||||||||||||
| Departure from Normal (F)* | -1.4 | -1.4 | -4.5 | -6.1 | -0.9 | +0.1 | -2.8 | -0.4 | +3.9 | -0.5 | -1.2 | -2.4 | -0.6 | ||||||||||||
| Precipitation (inches) | 0.77 | 1.25 | 2.23 | 1.88 | 3.11 | 2.80 | 4.01 | 3.16 | 1.93 | 0.87 | 1.29 | 0.23 | 0.35 | ||||||||||||
| Departure from Normal | +0.28 | +0.67 | +0.36 | -0.39 | -0.81 | -0.81 | +0.14 | -0.14 | -0.11 | -1.01 | +0.07 | -0.43 | -0.14 | ||||||||||||
| Snowfall (inches) | 7.6 | 16.4 | 10.0 | 0.8 | Trace | 0.0 | 0.0 | 0.0 | 0.0 | 0.0 | Trace | 5.3 | 6.9 | ||||||||||||
| Departure from Normal | +3.9 | +12.3 | +7.4 | +0.2 | 0.0 | 0.0 | 0.0 | 0.0 | -0.2 | -0.4 | -1.8 | +2.1 | +3.2 | ||||||||||||
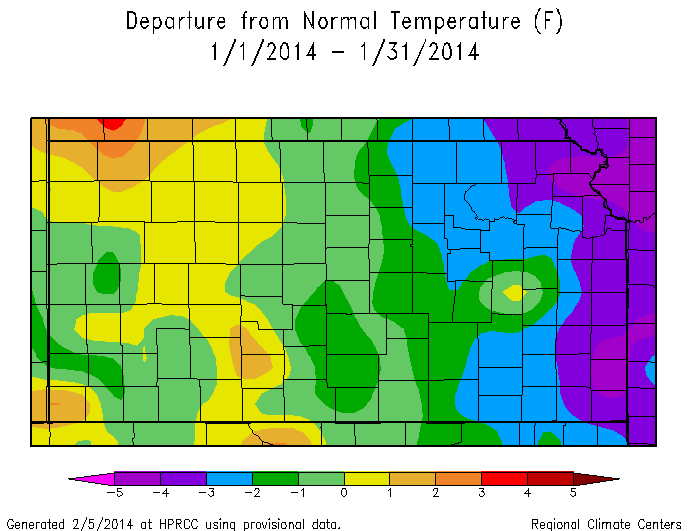
Most of the following images depicting January 2014 Precipitation and Temperatures are courtesy of the High Plains Regional Climate Center:
* Please note: These maps are a "best-approximation" of actual measured values, and data reflected on these maps may not exactly match actual values due to the effects of interpolation and "smoothing" used to create the maps. In addition, some "bullseyes" may be a result of missing data.
Click Images To Enlarge
| Nebraska: January 2014 Measured Precipitation (Inches) |
Kansas: January 2014 Measured Precipitation (Inches) |
 |
 |
| Nebraska: January 2014 Percent of Normal Measured Precip. | Kansas: January 2014 Percent of Normal Measured Precip. |
 |
 |
| NWS Hastings Area: January 2014 Total "Observed" Precipitation Based On AHPS Precipitation Analysis Including Radar Data |
|
 |
While the precipitation images above are based strictly on gauge-measured data, this image on the left utilizes an "Observed" multisensor approach created by River Forecast Centers. Hourly precipitation estimates from WSR-88D NEXRAD radar are compared to ground rainfall gauge reports, and a bias (correction factor) is calculated and applied to the radar field. For much more information on these types of images, and to create your own precipitation maps, please visit the following site: https://www.srh.noaa.gov/ridge2/ |
| Nebraska: January 2014 Temperature Departure from Normal (F) |
Kansas: January 2014 Temperature Departure from Normal (F) |
 |
 |
The following drought category images, current as of February 4, 2014, are courtesy of the U.S. Drought Monitor (see narrative above for more details):
Click Images To Enlarge
 |
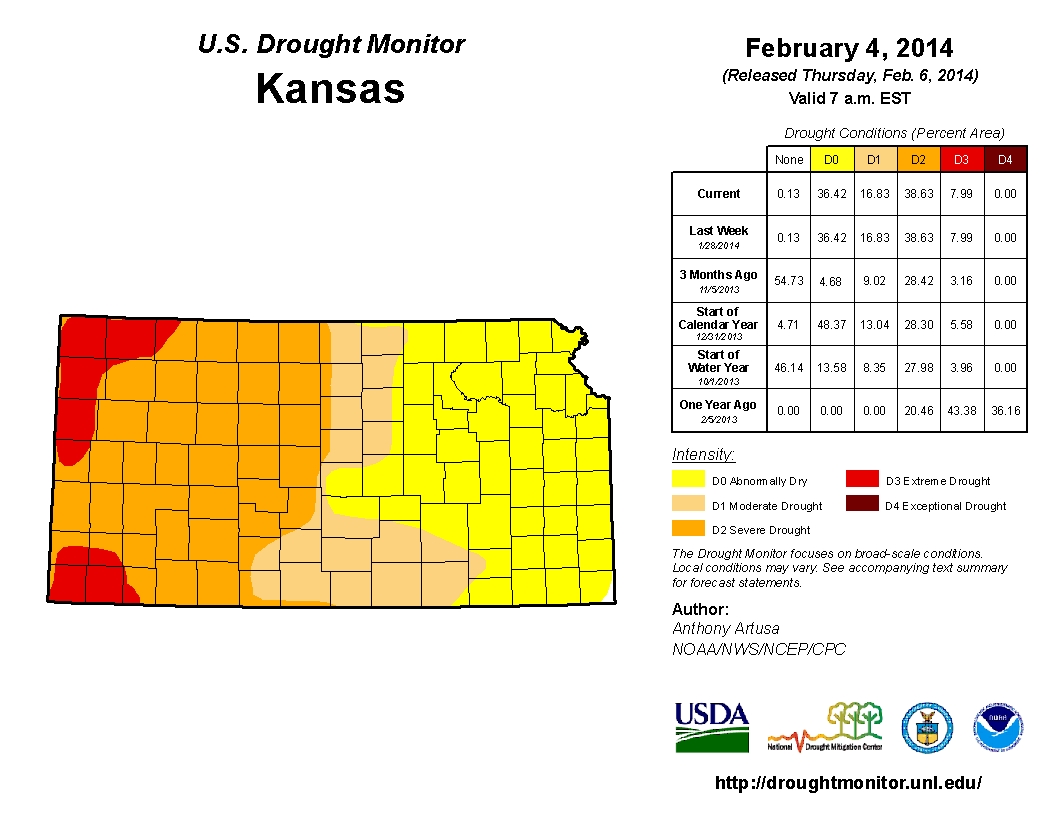 |
| Nebraska - U.S. Drought Monitor as of February 4, 2014 | Kansas - U.S. Drought Monitor as of February 4, 2014 |
For more climate related information, check out the following websites:
| This page was composed by the staff at the National Weather Service in Hastings, Nebraska. |

