
A significant heat wave continues for the Rockies, Northern Plains, and Great Lakes into the Mid-Atlantic, peaking in intensity through midweek and lingering across parts of the Northern Plains and Midwest until this weekend. Excessive rainfall my bring life-threatening and locally catastrophic flash and urban flooding across portions of southwestern Texas through early Friday. Read More >
(Click on the links in gray boxes below to quickly jump to information located farther down the page)
| Tri-Cities & Ord Details & Monthly Extremes |
Graphs, Tables, Maps | Drought Monitor Graphics |
Monthly Precipitation & Snowfall Tables & Archive of These Monthly Reviews |
* Please Note: All climate data presented here are preliminary and have not undergone final quality control by the National Climatic Data Center (NCDC). Therefore, these data are subject to revision. Final and certified climate data can be accessed at: WWW.NCDC.NOAA.GOV.
June 2014 Climate And Weather Review For South Central Nebraska
And Portions Of North Central Kansas
...Top-5 to Top-10 Wettest June On Record Across Much of The Area...Putting a Significant Dent In Long-Term Drought Issues...
The following narrative focuses on climate and weather highlights for the month of June 2014 across the NWS Hastings coverage area, encompassing 24 counties in south central and central Nebraska, and 6 counties in north central Kansas. Click here for a map of this coverage area. The temperature and precipitation data presented here are largely based on the NWS Cooperative Observer network, along with data from a handful of automated airport sites. All climate averages and "normals" presented here are based on the official NCDC 1981-2010 normals.
- TEMPERATURES...(According to 30-year averages, "normal" June high temperatures in South Central Nebraska gradually climb from the upper-70s early in the month to the mid-upper 80s by month's end. In North Central Kansas, highs gradually warm from near 80 to the low-90s. Low temperatures across the area generally climb from the low or mid-50s early in the month to the low or mid-60s by month's end...)
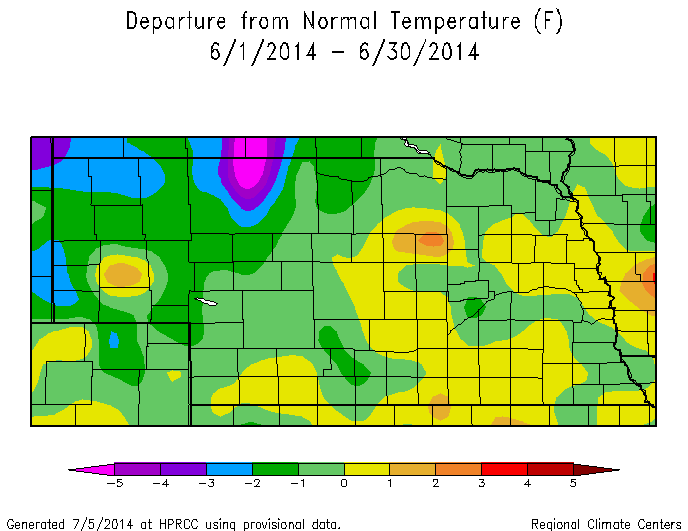
Based on the monthly average temperature (resulting from averaging together the daily highs and lows), temperatures for the month of June 2014 as a whole were actually quite "ordinary", as the vast majority of the NWS Hastings coverage area ended up within 1.0° either side of the 30-year normal. Following below are several temperature highlights/details for the month of June 2014:
Across the 30-county area as a whole, there were no pronounced periods of notably cool or hot weather during June 2014. However, when breaking the month down into week-long chunks, the overall-coolest week was generally centered between the 7th-13th and the overall-warmest week followed shortly thereafter from the 16th-22nd. The month ended with a decent stretch of very "typical" temperatures, as each of the final 10 days of June featured highs in the 80s and lows in the 60s at places such as Grand Island airport. At Hastings airport, where temperature trends were generally representative of much of the 30-county area as a whole, 14 of 30 June days featured an above normal average temperature, 14 were below normal and 2 days matched the daily normal.
During the overall-coolest week centered from the 7th-13th, places such as Hastings airport failed to reach 80° on six of the seven days, and two days only topped out in the 60s. During the overall-warmest week of the month at Hastings centered from the 16th-22nd, four of seven days reached at least 89°.
Per dozens of NWS cooperative observers and a few automated airport sites, the vast majority of the area observed its hottest day on either the 17th and/or 18th. However, compared to many years, this June featured an unusually low number of 100+° readings, even in the typically-hotter southern counties. A few of the hottest readings of the month, all of which occurred on the 17th, featured 100° two miles southwest of Alton KS, 99° at Beaver City, Edison and four miles west-northwest of Plainville KS, and 98° at Smith Center KS and Franklin.
Per dozens of NWS cooperative observers and a few automated airport sites, the coolest low temperatures of the month across nearly the entire 30-county area occurred on the morning of the 13th, highlighted by readings of 37° at Greeley, 42° at Ord airport, 43° three miles north of York and 45° at Red Cloud.
For most of the 30-county area, the coolest afternoon high temperatures of the month occurred on either the 7th or 9th, as readings on at least one of those days were held well-down into the 60s. A few of the coolest monthly highs within various portions of the area included 60° at both Ord airport and Cambridge on the 9th, 66° at Hastings airport on the 7th, and 67° at Beloit KS on the 9th.
Among the official Nebraska Tri-Cities airport temperature stations, the hottest June high temperature at each site featured 96° at Grand Island on the 18th, 95° at Hastings on the 17th and 95° at Kearney on the 17th. The coolest Tri-Cities low temperatures all occurred on the 13th, consisting of 48° at Kearney, 49° at Grand Island and 51° at Hastings.
The most extreme day-to-day change in June high temperatures at Grand Island airport was 21°, consisting of a solid cool-down from 87° to 66° from the 6th-7th.
(Please look farther down the page for more information on June 2014 temperatures and extremes, including detailed breakdowns for Grand Island, Hastings, Kearney and Ord.)
- PRECIPITATION/FLOODING...(According to 30-year averages, "normal" June rainfall across the NWS Hastings coverage area is fairly uniform, with nearly all locations expected to receive somewhere between 3.50-4.50 inches, although the lower half of this range favors counties in North Central Kansas and southwest portions of South Central Nebraska...)
Needless to say, the #1 story across the NWS Hastings coverage area during June 2014 was widespread, soaking rainfall, as a large percentage of the 30-county area observed at least a Top-10, if not a Top-5 wettest June on record based on long term records reaching back around 100 or more years. This was a stark turnaround from the prior month of May, when the vast majority of the area measured below normal rainfall. Although some areas likely received a bit too much rain during June, it was an overall very-beneficial change in fortunes, as many (but not all) counties were able to largely shake free of lingering longer-term drought impacts that had been plaguing the region for the past two years since summer 2012. Following below are several precipitation highlights/details for the month of June 2014:
Based on reports from around 65 NWS Cooperative Observers and a few automated airport gauges, and also incorporating radar-derived estimation, literally the ENTIRE 30-county area observed above normal rainfall during June 2014, a reality that hadn't happen in quite some time. More significantly, at least 55% of the area measured AT LEAST TWICE NORMAL June rainfall (meaning generally more than 8.00")! Although very limited in nature, a very small fraction of the area even flirted with or slightly exceeded THREE TIMES NORMAL June rainfall.
Among the official Nebraska Tri-Cities airport precipitation sites, Grand Island led the way with 9.65”, followed by Hastings (8.69”) and Kearney (8.53”). At Grand Island, this was the 3rd-wettest June on record out of 119 years, while both Hastings and Kearney recorded their 5th-wettest June out of 119 years. (Please refer to the web story linked at the top of this page for more details).
Although very few locations actually recorded their outright-wettest month of June on record (for those sites with 50+ years of history), one place that did was the NWS cooperative observer site at Cambridge in Furnas County. There, the June 2014 total of 10.55" was THE WETTEST out of 104 years, and shattered the previous mark of 9.49" set in 1975.
Although still solidly above normal, the overall-lowest monthly rainfall totals generally only in the 5.00-6.50" range were heavily concentrated in the far eastern counties of the Nebraska coverage area, along the Highway 81 corridor from Polk County southward through Thayer County.
During June, the majority (generally two-thirds) of the 30-county area tallied much-above normal rainfall, roughly somewhere between 6.80-9.40". As for monthly precipitation extremes, a few of the very highest June totals from the NeRAIN observation network featured 12.26" at Wilcox, 12.23" two miles west of Loup City and 11.95" five miles southeast of Cambridge. Per NWS cooperative observers, a few of the highest amounts were 10.55" at Cambridge, 10.20" two miles northeast of Upland, and 10.19" six miles north-northwest of Oxford. (please refer to the extremes section below for a longer list of highest/lowest rainfall amounts)
On the comparably "drier" side of things during June, if you want to call it that, a few of the lowest June precipitation totals within the area consisted of 4.69" seven miles southeast of Stromsburg (NeRAIN observer), 5.01" three miles west of Gresham (NWS observer) and 5.30" at Bradshaw (NWS observer).
Flooding: Given the significant amounts of rain during the month, it goes without saying that there were several instances of mainly minor, short-term flooding issues...primarily consisting of flooding of small creeks and stream along with generally shallow amounts of water covering county roads for up to several hours. These sort of situations cropped up within various portions of the area on various days during the month. Fortunately though, because most heavy rain events were spaced out across the area in both locations and time (meaning that most places had at least a few days to dry out before the next rain event), widespread, significant flooding was held to a relative minimum, including flooding of larger streams and rivers. Very few official gauges along creeks and rivers within the 30-county area breached minor flood stage during the month. One gauge that did reach minor flood stage was along the South Fork Solomon River near Damar KS on the 9th, primarily due to upstream rain that fell just west of the NWS Hastings coverage area. In addition, for several days mainly between the 10th-15th, minor flooding occurred along the Platte River in western Dawson County primarily affecting the Gothenburg area. Again though, this flooding had little to do with heavy rain over the local area, but was instead driven by the combined effects of heavy rainfall upstream over western Nebraska and especially elevated flows from Rocky Mountain snow melt.
(Please look farther down the page for more information on June 2014 precipitation/snowfall and extremes, including rankings of wettest and driest locations, percent-of-normal plots, and a detailed breakdown for Grand Island, Hastings, Kearney and Ord. In addition, the link on the far upper right of this page contains an archive of monthly/annual precipitation and snowfall totals for around 70 locations.)
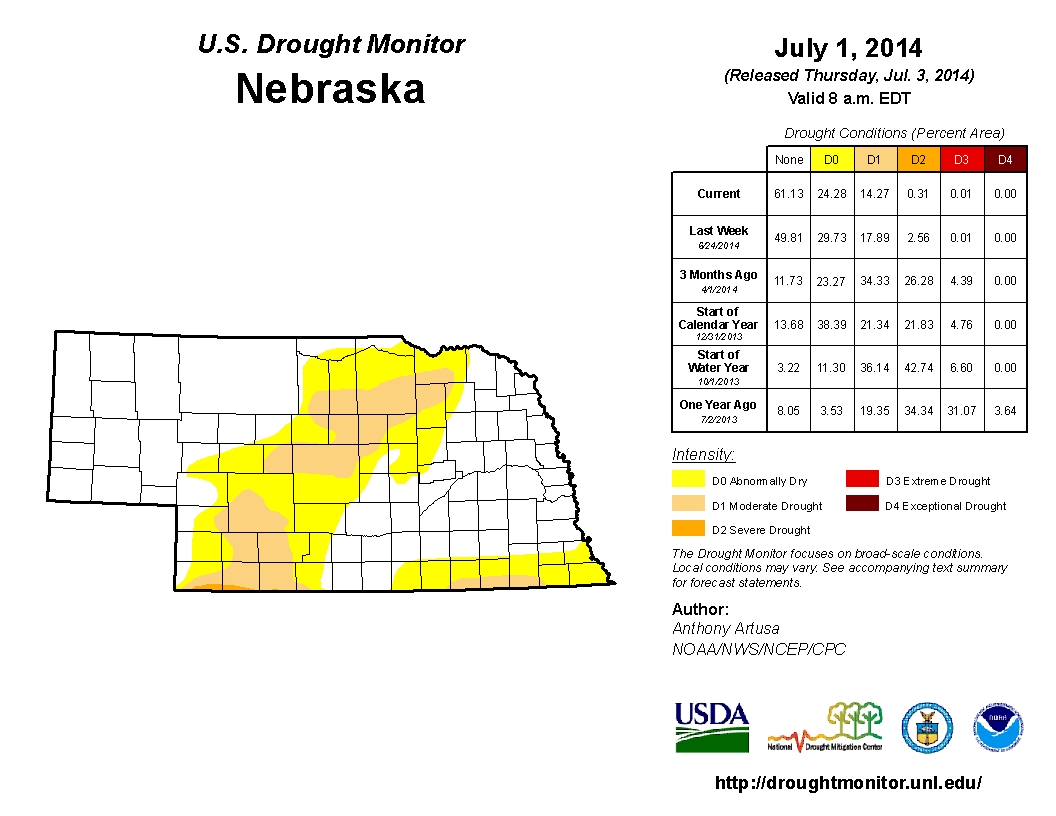
- DROUGHT STATUS (see images at bottom of page)...Needless to say, the widespread slightly-to-much above normal rainfall across the entire 30-county NWS Hastings coverage area was the best news regarding the long-term drought situation in quite some time. Although drought was certainly not "wiped out" for the entire area, THE PERCENTAGE OF COUNTIES IN SOUTH CENTRAL NEBRASKA DEEMED TO BE DROUGHT-FREE AT MONTH'S END WAS THE LARGEST IN OVER 2 YEARS, SINCE EARLY-JUNE 2012 when the ongoing drought situation initially took hold! Along these same lines, this marked the FIRST TIME SINCE JUNE 2012 THAT NO PORTION OF THE AREA WAS ASSIGNED CATEGORY D2 SEVERE-OR-WORSE DROUGHT! According to weekly issuances of the U.S. Drought Monitor, the majority of the 30-county area observed a one-category improvement in drought conditions over the course of the month, with limited areas improving by two categories.
Going into more detail, and starting with the 24-county Nebraska portion of the area: By month's end, roughly two-thirds of the area was deemed void of all drought conditions per the U.S. Drought Monitor, including the heart of South Central Nebraska including the Tri Cities. Only a very small percentage of the area remained in category D1 Moderate Drought, namely parts of northwestern Valley County, southern Thayer County and far southwestern Furnas County. Meanwhile, portions of 11 counties held onto at least limited areas of category D0 Abnormally Dry conditions (considered to be one category better than “true” drought). The greatest coverage of D0 lingered within the following counties: Furnas, Gosper, Dawson, Greeley, Webster, Nuckolls and Thayer. Farther south within the six North Central Kansas counties, although drought conditions remained a bit worse-off, nearly all areas improved by one-category during June. As a result, the majority of the area ended the month in category D1 Moderate Drought. On the best-off side of things, much of northwestern Phillips County, along with the extreme northern fringes of Smith and Jewell counties improved to category D0 Abnormally Dry.
Looking beyond the borders of the NWS Hastings coverage area to account for the entire states of Nebraska and Kansas, Nebraska observed a significant improvement in the cumulative areal coverage of D1 Moderate-or-worse drought during June, while the state of Kansas as a whole observed only a slight decrease in the overall coverage of Moderate-or-worse drought: As of July 1st, only 15% of Nebraska and 86% of Kansas was assigned D1 Moderate-or-worse Drought (compared to 62% and 99%, respectively, back on May 27th).
- SEVERE THUNDERSTORMS/HIGH WINDS (for all official/finalized storm reports please refer to NCDC Storm Data)...Along with the benefit of significant June rainfall came an inevitably above normal amount of severe weather. In fact, NWS Hastings issued Severe Thunderstorm and/or Tornado Warnings on 15 of the 30 DAYS during June! Although there were many dozens of reports of large hail and damaging winds across the area, fortunately there was a relatively small number of confirmed tornadoes (only 8 total, the two strongest of which were only rated EF-1). Although there were far too many severe weather events during June 2014 to provide significant detail in this short narrative, PLEASE refer to the web story links at the top of this page for an in-depth summary of the 3 most widespread/significant severe weather events of the month (which occurred on the 3rd, 14th and 20th). Here are a few of the most noteworthy June 2014 severe weather tidbits, in brief:
The two strongest tornadoes of the month (both rated EF-1) occurred near Hampton NE in Hamilton County on the evening of the 3rd and near Webster State Park KS in Rooks County on the afternoon of the 14th.
Much of the city of Grand Island was pounded with large hail ranging from quarter all the way up to baseball size during the early evening of the 20th. A hail stone up to 3" in diameter was also reported 2 miles northwest of Rockville.
Hastings recorded THREE peak thunderstorm winds gusts ranging from 67-79 MPH during the month, occurring on the 3rd, 14th and 20th. The events on the 14th and 20th resulted in a considerable amount of tree damage. In addition on the 14th, a hail stone up to 4.25" in diameter was measured by a NWS employee at his residence 3 miles southeast of Hastings.
For the majority of the 30-county area, the single most significant severe weather event of the month occurred on the night of the 14th, as widespread straight-line wind damage resulted from a fast-moving north-to-south-oriented line of severe storms that raced from west-to-east across nearly all counties along and south of Interstate 80. This severe squall line produced widespread gusts into the 60-90+ MPH range, uprooting or damaging countless trees across the region and also damaging several structures (especially outbuildings, grain bins, power poles etc.). Automated airport sensors at Phillipsburg KS and Hastings measured peak wind gusts of 86 MPH and 79 MPH, respectively, in association with this severe squall line.
- Number of Severe Thunderstorm Warning polygons issued by NWS Hastings in June 2014: 150 (85 more than June 2013)
- Number of Tornado Warning polygons issued by NWS Hastings in June 2014: 16 (15 more than June 2013)
- Number of confirmed tornadoes within the NWS Hastings coverage area in June 2014: 8 (6 EF-0 & 2 EF-1) (8 more than June 2013)
Click on the link below for June 2014 climate summaries specifically for Grand Island, Hastings, Kearney and Ord
Grand Island - Hastings - Kearney - Ord
|
...A FEW OF THE HOTTEST HIGH TEMPERATURES DURING JUNE 2014 |
Various graphs and tables depicting June 2014 climate data for
South Central Nebraska and North Central Kansas:
* Please Note: These data are preliminary and have not undergone final quality control by the National Climatic Data Center (NCDC). Therefore, these data are subject to revision. Final and certified climate data can be accessed at WWW.NCDC.NOAA.GOV
 |
 |
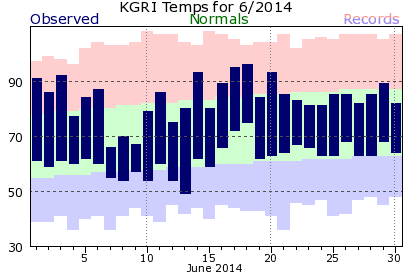
| Grand Island Temperature Summary: Observed daily maximum and minimum temperatures are connected by blue bars. Area between normal maximum and minimum temperatures is shaded green. Red bars connect record high temperatures. Blue bars connect record low temperatures. |
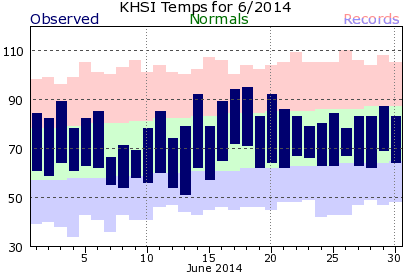
Hastings Temperature Summary: Observed daily maximum and minimum temperatures are connected by blue bars. Area between normal maximum and minimum temperatures is shaded green. Red bars connect record high temperatures. Blue bars connect record low temperatures. |
 |
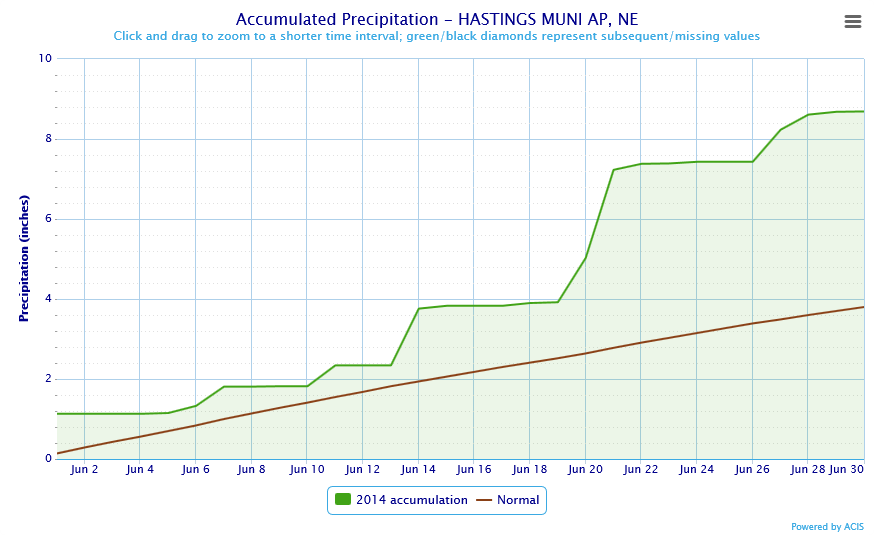 |
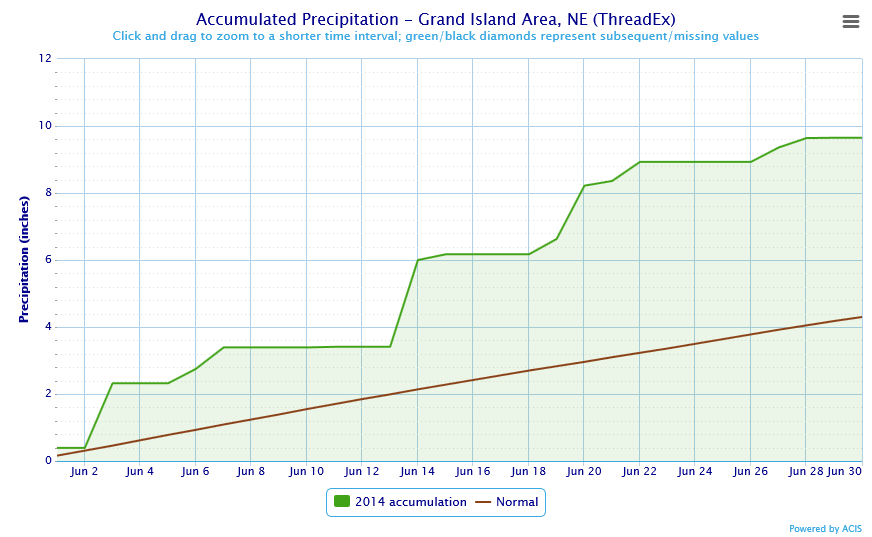
| Grand Island Precipitation Summary: Green line indicates cumulative observed precipitation for June 2014. Brown line indicates "normal" March precipitation based on 30-year data from 1981-2010. | Hastings Precipitation Summary: Green line indicates cumulative observed precipitation for June 2014. Brown line indicates "normal" March precipitation based on 30-year data from 1981-2010. |
| Grand Island (Regional Airport) - June 2013 - June 2014 | |||||||||||||||||||||||||
| June 2014 | July | Aug. | Sep. | Oct. | Nov. | Dec. | Jan. | Feb. | Mar. | Apr. | May | June | |||||||||||||
| Average High (F) | 84.8 | 87.6 | 85.8 | 82.5 | 64.0 | 50.6 | 37.1 | 38.5 | 33.5 | 51.3 | 64.2 | 76.3 | 83.6 | ||||||||||||
| Average Low (F) | 60.4 | 65.0 | 66.0 | 58.0 | 40.4 | 25.5 | 12.6 | 12.7 | 13.4 | 23.3 | 39.0 | 49.6 | 61.8 | ||||||||||||
| Average Temperature (F) | 72.6 | 76.3 | 75.9 | 70.2 | 52.2 | 38.1 | 24.9 | 25.6 | 23.4 | 37.2 | 51.6 | 62.9 | 72.7 | ||||||||||||
| Departure from Normal (F) | +1.3 | +0.1 | +1.9 | +5.1 | 0.0 | 0.0 | -1.8 | +0.5 | -5.7 | -2.2 | +1.0 | +1.7 | +1.4 | ||||||||||||
| Precipitation (inches) | 1.63 | 1.39 | 3.02 | 2.38 | 4.05 | 0.97 | 0.11 | 0.32 | 0.33 | 0.19 | 2.91 | 0.74 | 9.65 | ||||||||||||
| Departure from Normal | -2.67 | -2.01 | -0.10 | +0.15 | +2.19 | -0.20 | -0.52 | -0.21 | -0.35 | -1.61 | +0.38 | -3.67 | +5.35 | ||||||||||||
| Snowfall (inches) | 0.0 | 0.0 | 0.0 | 0.0 | 0.0 | 0.2 | 2.2 | 4.5 | 6.6 | 1.2 | 1.7 | 0.0 | 0.0 | ||||||||||||
| Departure from Normal | 0.0 | 0.0 | 0.0 | -0.1 | -1.0 | -2.9 | -2.9 | -2.0 | +0.3 | -4.2 | +0.2 | 0.0 | 0.0 | ||||||||||||
| Hastings (Municipal Airport) - June 2013 - June 2014 | |||||||||||||||||||||||||
| June 2014 | July | Aug. | Sep. | Oct. | Nov. | Dec. | Jan. | Feb. | Mar. | Apr. | May | June | |||||||||||||
| Average High (F) | 83.1 | 86.1 | 84.6 | 82.3 | 63.4 | 49.9 | 36.3 | 39.0 | 33.6 | 51.5 | 63.9 | 75.2 | 82.4 | ||||||||||||
| Average Low (F) | 60.3 | 64.4 | 65.3 | 57.6 | 40.4 | 25.1 | 12.4 | 12.8 | 13.2 | 22.5 | 39.2 | 50.3 | 61.9 | ||||||||||||
| Average Temperature (F) | 71.7 | 75.2 | 75.0 | 69.9 | 51.9 | 37.5 | 24.3 | 25.9 | 23.4 | 37.0 | 51.6 | 62.7 | 72.2 | ||||||||||||
| Departure from Normal (F) | -0.1 | -1.9 | +0.7 | +4.3 | -0.7 | -1.2 | -3.3 | -0.1 | -6.5 | -2.9 | +0.9 | +1.4 | +0.4 | ||||||||||||
| Precipitation (inches) | 1.24 | 1.77 | 3.25 | 1.26 | 4.75 | 1.00 | 0.14 | 0.37 | 0.34 | 0.15 | 3.93 | 2.15 | 8.69 | ||||||||||||
| Departure from Normal | -2.56 | -1.97 | -0.05 | -1.30 | +2.76 | -0.29 | -0.47 | -0.04 | -0.15 | -1.64 | +1.37 | -2.42 | +4.89 | ||||||||||||
| Snowfall NWS Office (inches) | 0.0 | 0.0 | 0.0 | 0.0 | 0.0 | 0.4 | 5.0 | 5.4 | 7.5 | 1.2 | 2.2 | 0.0 | 0.0 | ||||||||||||
| Departure from Normal | 0.0 | 0.0 | 0.0 | -0.2 | -1.0 | -2.2 | -1.1 | -0.6 | +1.0 | -4.0 | +1.0 | 0.0 | 0.0 | ||||||||||||
| Kearney (Regional Airport) - June 2013 - June 2014 (*All data from NWS coop observer with daily 24-hour obs taken around 7 AM. As a result, data may vary slightly from true "calendar day" averages) |
|||||||||||||||||||||||||
| June 2014 | July | Aug. | Sep. | Oct. | Nov. | Dec. | Jan. | Feb. | Mar. | Apr. | May | June | |||||||||||||
| Average High (F)* | 83.8 | 85.5 | 85.7 | 82.8 | 63.0 | 49.9 | 36.9 | 39.0 | 33.2 | 49.1 | 62.0 | 73.5 | 82.0 | ||||||||||||
| Average Low (F)* | 59.5 | 62.5 | 63.9 | 55.9 | 39.5 | 25.2 | 12.6 | 12.6 | 13.2 | 19.7 | 35.7 | 46.1 | 59.7 | ||||||||||||
| Average Temperature (F)* | 71.7 | 74.0 | 74.8 | 69.3 | 51.2 | 37.5 | 24.7 | 25.8 | 23.2 | 34.4 | 48.8 | 59.8 | 70.9 | ||||||||||||
| Departure from Normal (F)* | +1.9 | -0.7 | +2.2 | +5.8 | +0.3 | +0.5 | -1.2 | +1.2 | -4.9 | -3.3 | +0.1 | +0.3 | +1.1 | ||||||||||||
| Precipitation (inches) | 1.44 | 1.98 | 2.19 | 3.77 | 3.73 | 0.72 | 0.10 | 0.28 | 0.36 | 0.11 | 3.35 | 0.71 | 8.53 | ||||||||||||
| Departure from Normal | -2.49 | -1.30 | -0.89 | +1.70 | +1.69 | -0.30 | -0.47 | -0.21 | -0.19 | -1.68 | +1.12 | -3.47 | +4.60 | ||||||||||||
| Snowfall (inches) | 0.0 | 0.0 | 0.0 | 0.0 | 0.0 | Trace | 2.7 | 2.8 | 5.8 | 1.3 | 0.7 | 0.0 | 0.0 | ||||||||||||
| Departure from Normal | 0.0 | 0.0 | 0.0 | -0.2 | -0.7 | -3.1 | -0.8 | -1.6 | +0.7 | -3.3 | -1.1 | 0.0 | 0.0 | ||||||||||||
| Ord (Evelyn Sharp Field Airport) - June 2013 - June 2014 (*Winter precipitation data may include coop observer reports due to automated airport equipment under-measuring snowfall liquid equivalent) |
|||||||||||||||||||||||||
| June 2014 | July | Aug. | Sep. | Oct. | Nov. | Dec. | Jan. | Feb. | Mar. | Apr. | May | June | |||||||||||||
| Average High (F) | 81.0 | 85.9 | 84.4 | 81.9 | 61.0 | 48.7 | MSG | 38.3 | 33.1 | 49.8 | 62.7 | 73.1 | 80.3 | ||||||||||||
| Average Low (F) | 56.5 | 60.9 | 62.5 | 54.3 | 35.0 | 20.3 | MSG | 9.8 | 7.8 | 18.6 | 33.7 | 44.4 | 56.7 | ||||||||||||
| Average Temperature (F) | 68.8 | 73.4 | 73.5 | 68.1 | 48.0 | 34.5 | MSG | 24.0 | 20.4 | 34.2 | 48.2 | 58.7 | 68.5 | ||||||||||||
| Departure from Normal (F) | -0.4 | -1.0 | +0.5 | +4.5 | -1.6 | -1.8 | MSG | -0.6 | -7.4 | -3.5 | -0.6 | -0.6 | -0.7 | ||||||||||||
| Precipitation (inches)* | 1.93 | 3.59 | 3.77 | 2.80 | 1.62 | 0.50 | Trace | 0.06 | 0.19 | 0.20 | 1.26 | 0.51 | 8.08 | ||||||||||||
| Departure from Normal | -2.19 | +0.62 | +0.61 | +0.36 | -0.31 | -0.57 | -0.59 | -0.31 | -0.25 | -1.25 | -1.33 | -3.30 | +3.96 | ||||||||||||
| Snowfall (Coop Observer) | 0.0 | 0.0 | 0.0 | 0.0 | 0.0 | 3.5 | 0.5 | 2.5 | 5.5 | 4.0 | 2.5 | 0.0 | 0.0 | ||||||||||||
| Departure from Normal | 0.0 | 0.0 | 0.0 | 0.0 | -1.1 | -1.8 | -6.9 | -4.3 | -0.5 | -1.9 | 0.0 | 0.0 | 0.0 | ||||||||||||
| Smith Center, KS (Cooperative Observer) - June 2013 - June 2014 (*All data from NWS coop observer with daily 24-hour obs taken around 7 AM. As a result, data may vary slightly from true "calendar day" averages) |
|||||||||||||||||||||||||
| June 2014 | July | Aug. | Sep. | Oct. | Nov. | Dec. | Jan. | Feb. | Mar. | Apr. | May | June | |||||||||||||
| Average High (F)* | 88.6 | 89.2 | 88.9 | 86.1 | 68.4 | 52.8 | 38.9 | 41.4 | 36.1 | 52.8 | 66.9 | 77.4 | 85.4 | ||||||||||||
| Average Low (F)* | 59.6 | 64.6 | 64.6 | 58.1 | 40.2 | 25.5 | 13.8 | 12.7 | 13.3 | 21.9 | 37.7 | 48.3 | 61.7 | ||||||||||||
| Average Temperature (F)* | 74.1 | 76.9 | 76.8 | 72.1 | 54.3 | 39.2 | 26.4 | 27.1 | 24.7 | 37.4 | 52.3 | 62.8 | 73.6 | ||||||||||||
| Departure from Normal (F)* | +0.1 | -2.8 | -0.4 | +3.9 | -0.5 | -1.2 | -2.4 | -0.6 | -7.3 | -4.2 | -0.2 | -0.9 | -0.4 | ||||||||||||
| Precipitation (inches) | 2.80 | 4.01 | 3.16 | 1.93 | 0.87 | 1.29 | 0.23 | 0.35 | 0.84 | 0.12 | 1.93 | 2.70 | 8.59 | ||||||||||||
| Departure from Normal | -0.81 | +0.14 | -0.14 | -0.11 | -1.01 | +0.07 | -0.43 | -0.14 | +0.26 | -1.75 | -0.34 | -1.22 | +4.98 | ||||||||||||
| Snowfall (inches) | 0.0 | 0.0 | 0.0 | 0.0 | 0.0 | Trace | 5.3 | 6.9 | 14.8 | 2.4 | 0.7 | 0.0 | 0.0 | ||||||||||||
| Departure from Normal | 0.0 | 0.0 | 0.0 | -0.2 | -0.4 | -1.8 | +2.1 | +3.2 | +10.7 | -0.2 | +0.1 | 0.0 | 0.0 | ||||||||||||
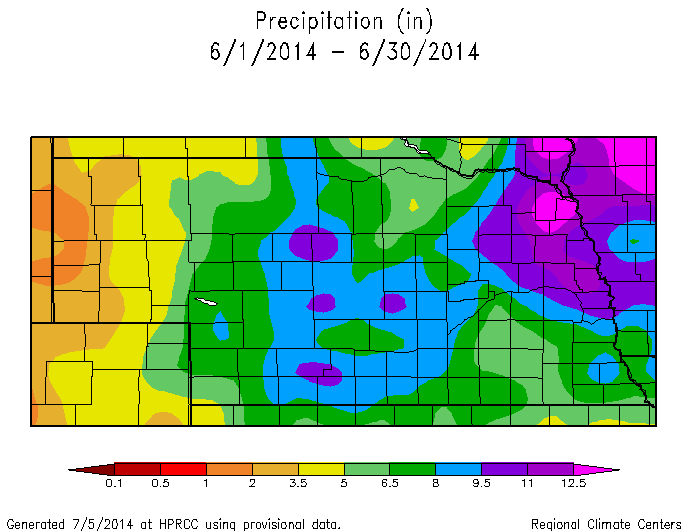
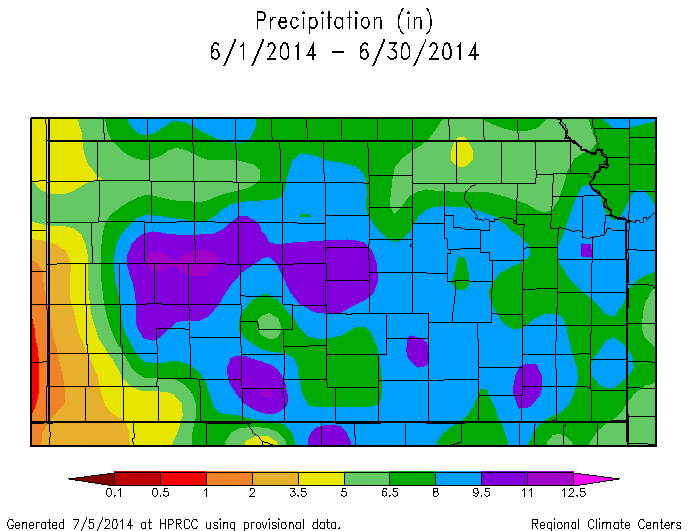
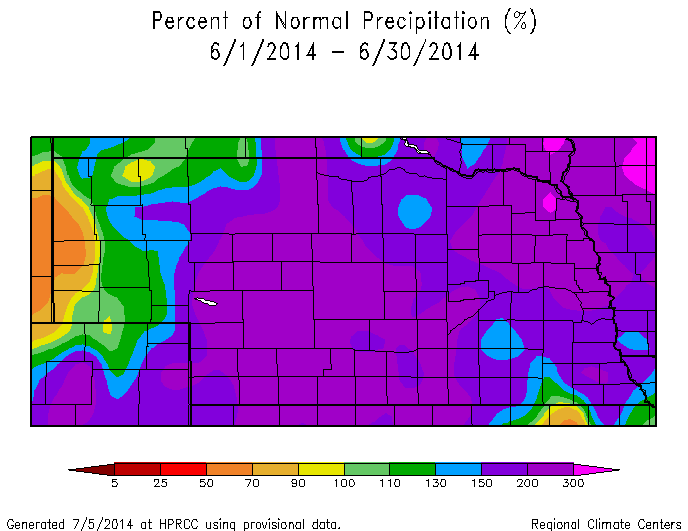
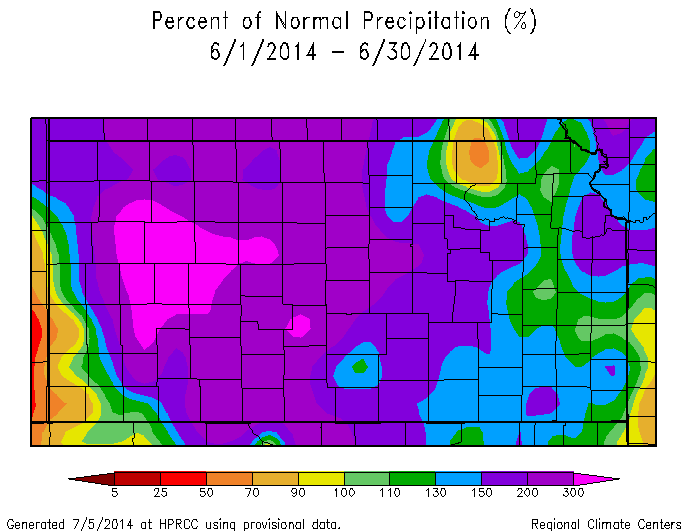
Most of the following images depicting June 2014 Precipitation and Temperatures are courtesy of the High Plains Regional Climate Center:
* Please note: These maps are a "best-approximation" of actual measured values, and data reflected on these maps may not exactly match actual values due to the effects of interpolation and "smoothing" used to create the maps. In addition, some "bullseyes" may be a result of missing data.
Click Images To Enlarge
| Nebraska: June 2014 Measured Precipitation (Inches) |
Kansas: June 2014 Measured Precipitation (Inches) |
 |
 |
| Nebraska: June 2014 Percent of Normal Measured Precip. |
Kansas: June 2014 Percent of Normal Measured Precip. |
 |
 |
| NWS Hastings Area: June 2014 Total "Observed" Precipitation Based On AHPS Precipitation Analysis Including Radar Data |
|
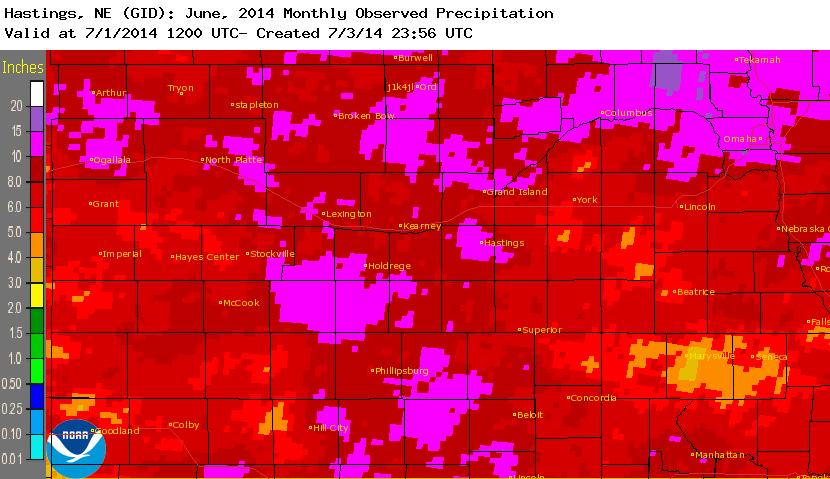 |
While the precipitation images above are based strictly on gauge-measured data, this image on the left utilizes an "Observed" multisensor approach created by River Forecast Centers. Hourly precipitation estimates from WSR-88D NEXRAD radar are compared to ground rainfall gauge reports, and a bias (correction factor) is calculated and applied to the radar field. For much more information on these types of images, and to create your own precipitation maps, please visit the following site: https://www.srh.noaa.gov/ridge2/ |
| Nebraska: June 2014 Temperature Departure from Normal (F) |
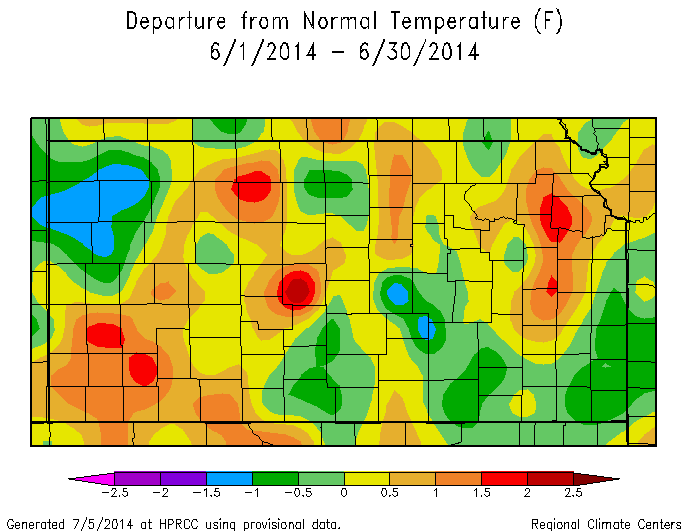
Kansas: June 2014 Temperature Departure from Normal (F) |
 |
 |
The following drought category images, current as of July 1, 2014, are courtesy of the U.S. Drought Monitor (see narrative above for more details):
Click Images To Enlarge
 |
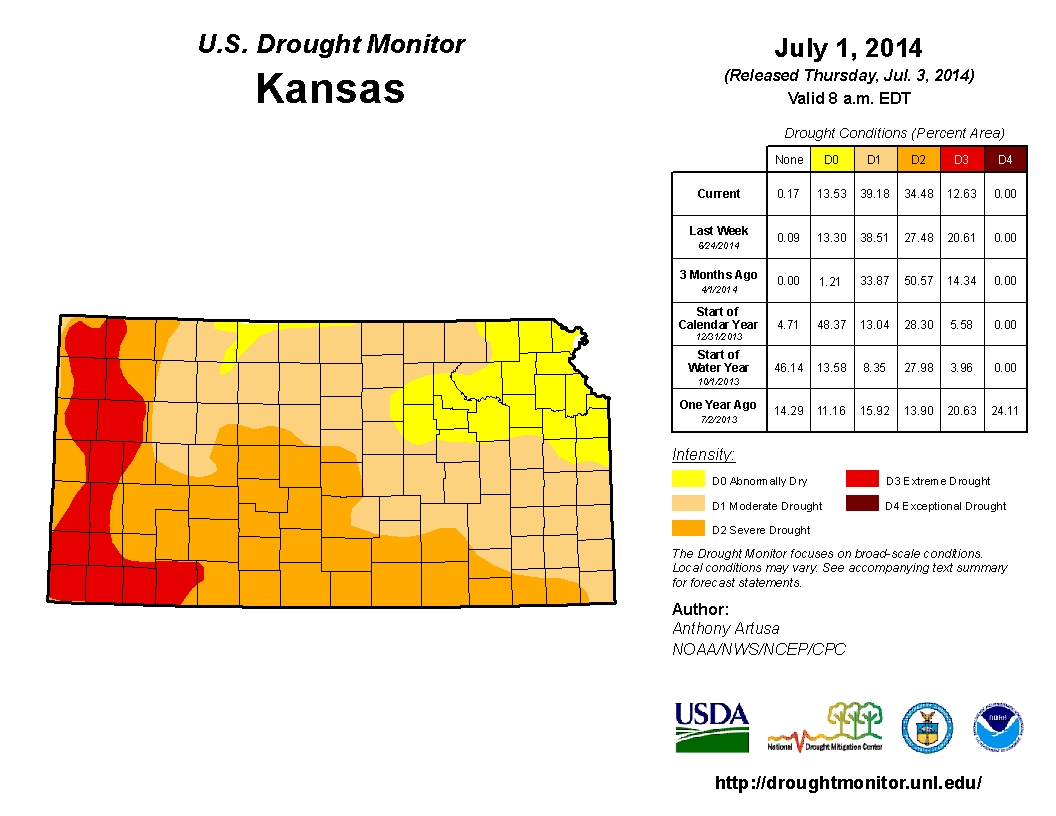 |
| Nebraska - U.S. Drought Monitor as of July 1, 2014 | Kansas - U.S. Drought Monitor as of July 1, 2014 |
For more climate related information, check out the following websites:
| This page was composed by the staff at the National Weather Service in Hastings, Nebraska. |

