
A significant heat wave continues for the Rockies, Northern Plains, and Great Lakes into the Mid-Atlantic, peaking in intensity through midweek and lingering across parts of the Northern Plains and Midwest until this weekend. Excessive rainfall my bring life-threatening and locally catastrophic flash and urban flooding across portions of southwestern Texas through early Friday. Read More >
(Click on the links in gray boxes below to quickly jump to information located farther down the page)
| Tri-Cities & Ord Details & Monthly Extremes |
Graphs, Tables, Maps | Drought Monitor Graphics |
Monthly Precipitation & Snowfall Tables & Archive of These Monthly Reviews |
* Please Note: All climate data presented here are preliminary and have not undergone final quality control by the National Climatic Data Center (NCDC). Therefore, these data are subject to revision. Final and certified climate data can be accessed at: WWW.NCDC.NOAA.GOV.
March 2014 Climate And Weather Review For South Central Nebraska
And Portions Of North Central Kansas
...One of the Driest Marches on Record…With Temperatures Finishing Generally 2-4° Below Normal Following a Record-Cold Start...
The following narrative focuses on climate and weather highlights for the month of March 2014 across the NWS Hastings coverage area, encompassing 24 counties in south central and central Nebraska, and 6 counties in north central Kansas. Click here for a map of this coverage area. The temperature and precipitation data presented here are largely based on the NWS Cooperative Observer network, along with data from a handful of automated airport sites. All climate averages and "normals" presented here are based on the official NCDC 1981-2010 normals.
- TEMPERATURES...(According to 30-year averages, "normal" March high temperatures in South Central Nebraska gradually climb from the low or mid-40s early in the month to the upper 50s by month's end. In North Central Kansas, highs gradually warm from around 50 to around 60. Low temperatures across the area generally climb from the low-20s early in the month to the low-30s late...)
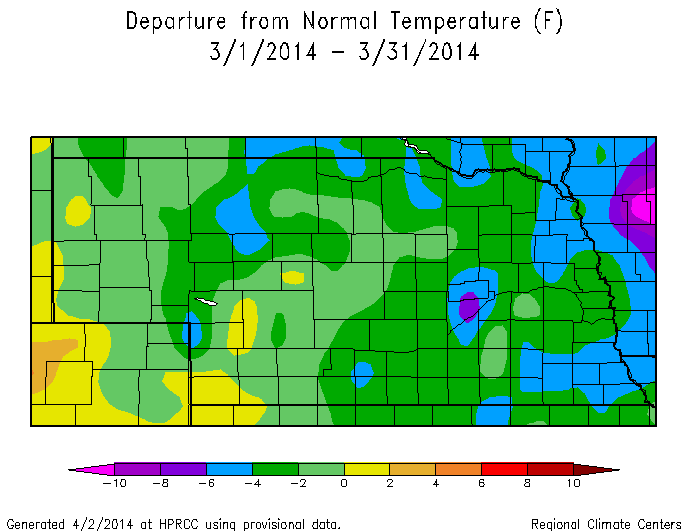
Based on the monthly average temperature (resulting from averaging together the daily highs and lows), the majority of the NWS Hastings coverage area averaged slightly on the cold side, generally finishing 2-4° below normal. In most places, daily low temperatures contributed a greater weight toward the overall below normal average than daily high temperatures did. For places such as Hastings and Smith Center KS, March actually marked the SIXTH-CONSECUTIVE month of at least slightly below normal temperatures.
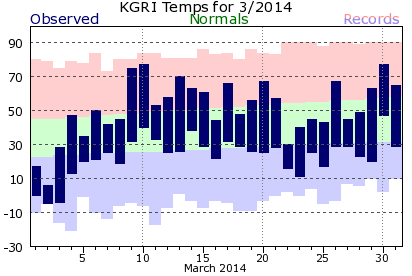
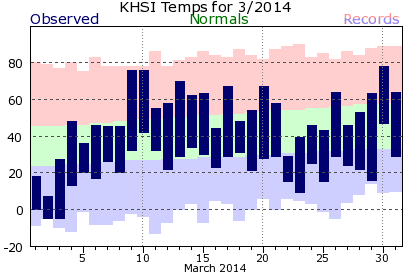
By far the most notable temperature news of the month was the brutally cold start on the 1st-2nd. In fact, at both Grand Island and Hastings the first two days resulted in the COLDEST START TO MARCH ON RECORD, per records dating back 107-118 years. More specifically, Grand Island and Hastings started the month with daily high temperatures of 17°/6° and 18°/7°, respectively. The single-digit highs on the 2nd set a new daily record at both sites, while the daily low of -5° at both sites on the 2nd tied the previous record. More impressively, the incredibly cold highs on the 2nd were actually the SECOND-COLDEST HIGH TEMPERATURES RECORDED ON ANY DAY IN MARCH at Grand Island and Hastings! This brutally cold air at the beginning of the month was certainly not confined to Nebraska portions of the area, as even Beloit KS started the month with highs of only 16°/7°.
At Hastings airport, where temperature trends were generally representative of much of the 30-county as a whole, 17 of the 31 March days featured a below normal average temperature, including seven of the first eight days. However, in the aftermath of the very cold start to the month, 13 days ended up featuring an above normal average temperature, including seven days in a row from the 9th-15th. In fact, 11 days during the month reached highs of at least 62° in Hastings. The most extreme day-to-day change in high temperatures at Hastings was 31°, consisting of a notable warm up from a high of 45° on the 8th to 76° on the 9th.
Per dozens of NWS cooperative observers and a few automated airport sites, the warmest high temperatures of the month primarily occurred on one of three days (the 9th, 10th or 30th). A few of the overall warmest highs of the month within the 30-county area featured 82° at Beaver City (on the 9th), 81° at Webster Dam KS (on the 10th) and 80° at both Smith Center KS and two miles southwest of Alton KS (on the 10th). In stark contrast, the coldest lows of the month occurred on either the 2nd or 3rd (or both) across nearly the entire area, highlighted by readings of -13° two miles west of Genoa, -10° three miles north of York and -9° at Greeley, Ord airport and Osceola. Among the official Nebraska Tri-Cities airport temperature stations, Hastings notched the warmest March temperature of 78° on the 30th, while the NWS cooperative observer at the Kearney airport recorded the coldest low of -6° on the 2nd.
(Please look farther down the page for more information on March 2014 temperatures and extremes, including detailed breakdowns for Grand Island, Hastings, Kearney and Ord.)
- PRECIPITATION/SNOWFALL/FLOODING...(According to 30-year averages, "normal" March precipitation (rainfall and snow liquid equivalent) across most of the 30-county area ranges somewhere between 1.60 and 2.10 inches, with the highest amounts favoring eastern areas closest to the Highway 81 corridor such as York, Hebron and Beloit. However, far western areas such as Cambridge and Gothenburg average a bit lower, generally between 1.20 and 1.50 inches. Normal March snowfall ranges from 4-6 inches across most of South Central Nebraska, and 2-3 inches in North Central Kansas...)
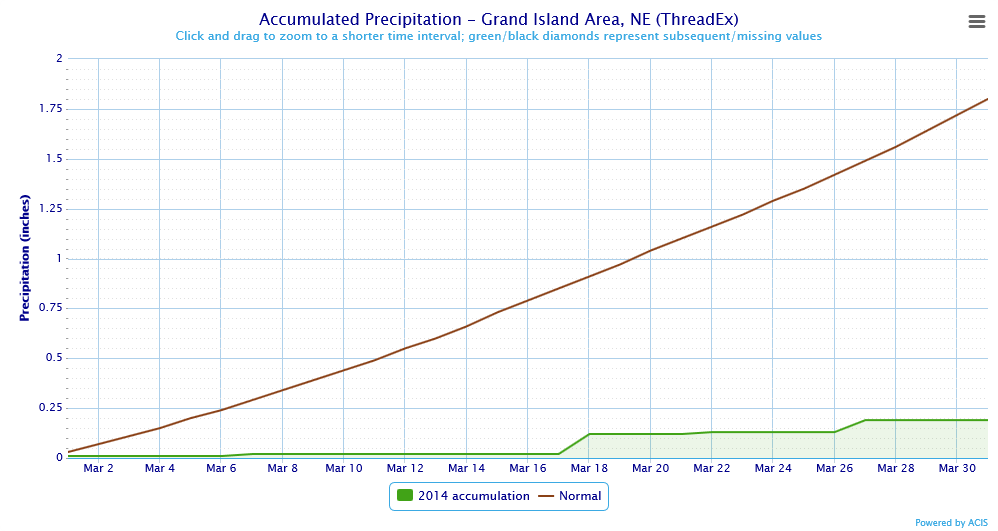
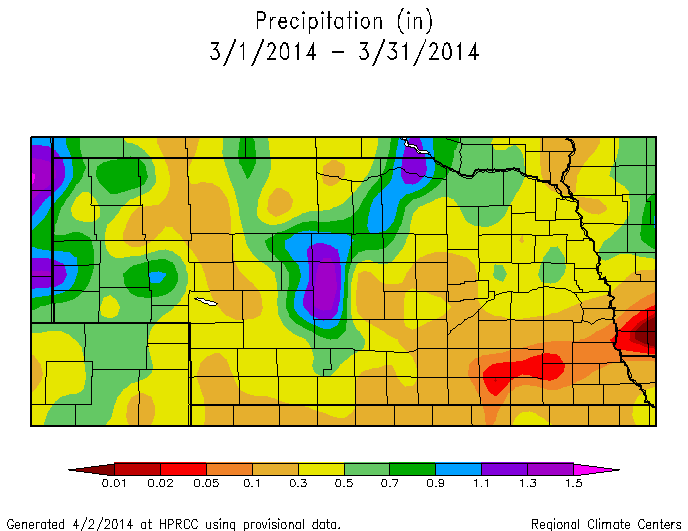
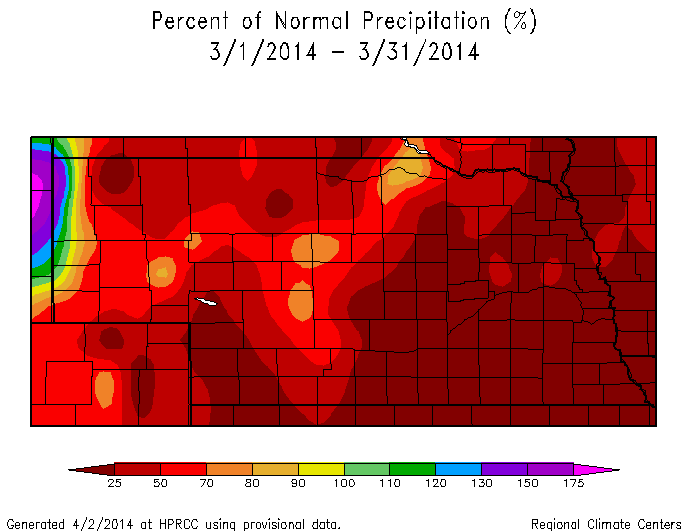
For much of the 30-county NWS Hastings area, March was at least the 5th consecutive month of below normal precipitation, but compared to 30-year normals it was hands-down the DRIEST OF ALL MONTHS during the recent dry-stretch. As evidence of this, roughly 90% of the area received LESS THAN ONE-FOURTH of normal March precipitation (assuming roughly 1.85" as being "normal" March precipitation for the area as a whole). Not surprisingly, many places endured one of their Top-10 driest months of March on record, including Grand Island airport with its 9th-driest March on record out of 117 years with only 0.19", and Hastings airport which also had its 9th-driest March on record out of 115 years with merely 0.15". More impressively, Red Cloud tied with a handful of previous years (most recently 2009) for the outright-driest March on record out of 118 years with only a paltry Trace of liquid precipitation. There was one localized exception within the area that received around one-half to as much as two-thirds of normal March precipitation, and that was primarily within far western counties in South Central Nebraska such as Dawson, Gosper and Furnas. There, much of the monthly precipitation fell on the 18th and/or 22nd in the form of several inches of snow.
Based on reports from around 65 NWS Cooperative Observers and a few automated airport gauges, and also incorporating radar-derived estimation, the majority (roughly two-thirds) of the 30-county area only totaled between 0.10"-0.40" of precipitation for the month, including stations in or near Grand Island, Hastings, Kearney, Ord, Aurora, York, Franklin, Smith Center KS and Phillipsburg KS. Turning to monthly extremes, and starting with the "driest of the dry", a few of the paltriest March precipitation totals featured 0.02" at Hunter KS, 0.03" at Hebron, 0.05" at Hubbell and 0.06" six miles east-southeast of Clay Center and at Webster Dam KS. On the comparably "wetter" side of things, by far the highest Cooperative Observer total of the month was Gothenburg with 1.30", followed by Cambridge (0.81"), eight miles south of Elwood (0.73"), Wilsonville (0.71") and Cozad (0.63"). Among the official Nebraska Tri-Cities airport precipitation sites, March totals were quite uniform, consisting of 0.19" at Grand Island, 0.15" at Hastings and 0.11" at Kearney.
As for March 2014 snowfall, and based exclusively on the Cooperative Observer network, the majority of the 30-county area measured below-normal to near-normal amounts between 1-4". As mentioned above, a major exception to these prevailing low snow totals occurred in far western portions of the area, where much of the western half of Dawson County, along with portions of Gosper and Furnas counties totaled March snowfall in the 6-11" range, including 10.9" at Cambridge, 9.5" at Wilsonville and 8.0" at Cozad. For the western Dawson County area, most March snow fell in association with a narrow, north-south oriented band of heavy snow on the 18th, while for Gosper and Furnas counties several inches of snow fell on both the 18th and 22nd. Official Nebraska Tri-Cities snowfall totals for March included 1.3” at Kearney and 1.2" at Grand Island and Hastings. Through March 31st, Grand Island’s season-to-date snowfall of 14.7” was a considerable 12.8" below the 30-year normal of 27.5". This marked Grand Island's least amount of season-to-date snowfall through March 31st since the winter of 2006-2007, which only had 11.3".
Turning to flooding issues during March, as often occurs during periods of fluctuating late-winter/early-spring temperatures, there were at least a few known-cases of ice jam flooding on area rivers. Most significantly, for the second time in roughly three weeks, generally minor ice jam flooding again flared up along the Platte River near the Highway 281/Interstate 80 interchange just south of Grand Island on March 9-10. Although water at least a few inches deep flowed into the parking lots of a few businesses, no flood damage was reported.
(Please look farther down the page for more information on March 2014 precipitation/snowfall and extremes, including rankings of wettest and driest locations, percent-of-normal plots, and a detailed breakdown for Grand Island, Hastings, Kearney and Ord. In addition, the link on the far upper right of this page contains an archive of monthly/annual precipitation and snowfall totals for around 70 locations.)
- DROUGHT STATUS (see images at bottom of page)...Thanks to a VERY DRY MARCH within the vast majority of the 30-county area, following on the heels of a notably dry winter in most places, things started taking a bit more noticeable turn for the worse during March according to the weekly U.S. Drought Monitor, especially within the 24 Nebraska counties. More specifically within Nebraska portions of the coverage area, several counties saw a 1-category degradation in drought classification. By month's end, roughly 75% of the Nebraska coverage area was in either category D1 Moderate Drought or D2 Severe Drought. The D1 Moderate Drought area included nearly all areas west of Highway 281 along with much of Nance and Merrick counties and portions of Nuckolls, Thayer and Polk counties. Meanwhile, worse D2 Severe Drought continued to plague all or parts of western counties such as Furnas, Gosper, Dawson, southern Harlan and western Phelps. Farther east, the four entire counties of Hamilton, York, Clay and Fillmore, along with at least small portions of several bordering counties, continued to fare a bit better with D0 Abnormally Dry classification (considered to be one category better than “true” drought). To the south within the six North Central Kansas counties, there was actually very little change in drought classification during the month, but most of this area was already in D2 Severe Drought anyway when March began, including all of Phillips, Rooks and Osborne counties, most of Smith County and small portions of Jewell and Mitchell counties. However, the majority of Jewell and Mitchell counties remained in D1 Moderate Drought.
Looking beyond the borders of the NWS Hastings coverage area to account for the entire states of Nebraska and Kansas, there were noticeable increases in the cumulative areal coverage of D1 Moderate to D3 Extreme Drought during March: As of April 1st, 64% of Nebraska and 99% of Kansas was assigned D1-or-worse Drought (compared to 51% and 65%, respectively, back on March 4th). In both states, there remained a west-to-east disparity, with the worst conditions primarily focused in the western halves.
- SEVERE THUNDERSTORMS/HIGH WINDS...During March 2014, the vast majority of the NWS Hastings coverage area observed no thunderstorms whatsoever, let alone severe storms. As for non-thunderstorm related strong winds from passing weather systems, there were no major events during the months with widespread damaging winds of 60+ MPH. However, several days during the month featured strong winds that locally gusted to 50+ MPH within the area, including the 11th, 18th, 26th and 31st. Although not considered "official" observation equipment, one of the highest measured gusts of the month was 62 MPH from a home weather station near Wood River on the 26th. Among the official NWS observation sites at airports, a few of the peak March gusts included 53 MPH at Ord on the 31st, 51 MPH at Hastings on the 11th, and 49 MPH at Grand Island on the 11th, 26th and 31st.
- Number of Severe Thunderstorm Warning polygons issued by NWS Hastings in March 2014: ZERO (5 less than March 2013)
- Number of Tornado Warning polygons issued by NWS Hastings in March 2014: ZERO (same as March 2013)
- Number of confirmed tornadoes within the NWS Hastings coverage area in March 2014: ZERO (1 less than March 2013)
Click on the link below for March 2014 climate summaries specifically for Grand Island, Hastings, Kearney and Ord
Grand Island - Hastings - Kearney - Ord
|
...MARCH 2014 TEMPERATURE/RAINFALL/SNOWFALL EXTREMES FROM ...A FEW OF THE WARMEST HIGH TEMPERATURES DURING MARCH 2014 |
Various graphs and tables depicting March 2014 climate data for
South Central Nebraska and North Central Kansas:
* Please Note: These data are preliminary and have not undergone final quality control by the National Climatic Data Center (NCDC). Therefore, these data are subject to revision. Final and certified climate data can be accessed at WWW.NCDC.NOAA.GOV
 |
 |
| Grand Island Temperature Summary: Observed daily maximum and minimum temperatures are connected by blue bars. Area between normal maximum and minimum temperatures is shaded green. Red bars connect record high temperatures. Blue bars connect record low temperatures. |
Hastings Temperature Summary: Observed daily maximum and minimum temperatures are connected by blue bars. Area between normal maximum and minimum temperatures is shaded green. Red bars connect record high temperatures. Blue bars connect record low temperatures. |
 |
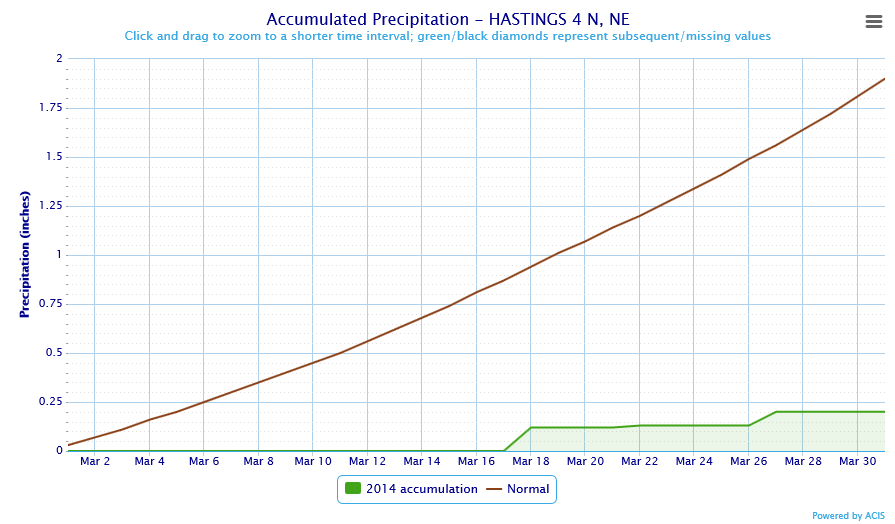 |
| Grand Island Precipitation Summary: Green line indicates cumulative observed precipitation for March 2014. Brown line indicates "normal" March precipitation based on 30-year data from 1981-2010. | Hastings Precipitation Summary: Green line indicates cumulative observed precipitation for March 2014. Brown line indicates "normal" March precipitation based on 30-year data from 1981-2010. |
| Grand Island (Regional Airport) - March 2013 - March 2014 | |||||||||||||||||||||||||
| Mar. 2013 | Apr. | May | June | July | Aug. | Sep. | Oct. | Nov. | Dec. | Jan. | Feb. | Mar. | |||||||||||||
| Average High (F) | 48.0 | 58.2 | 72.4 | 84.8 | 87.6 | 85.8 | 82.5 | 64.0 | 50.6 | 37.1 | 38.5 | 33.5 | 51.3 | ||||||||||||
| Average Low (F) | 24.2 | 33.9 | 50.6 | 60.4 | 65.0 | 66.0 | 58.0 | 40.4 | 25.5 | 12.6 | 12.7 | 13.4 | 23.3 | ||||||||||||
| Average Temperature (F) | 36.1 | 46.1 | 61.5 | 72.6 | 76.3 | 75.9 | 70.2 | 52.2 | 38.1 | 24.9 | 25.6 | 23.4 | 37.2 | ||||||||||||
| Departure from Normal (F) | -3.3 | -4.5 | +0.3 | +1.3 | +0.1 | +1.9 | +5.1 | 0.0 | 0.0 | -1.8 | +0.5 | -5.7 | -2.2 | ||||||||||||
| Precipitation (inches) | 1.64 | 3.83 | 6.77 | 1.63 | 1.39 | 3.02 | 2.38 | 4.05 | 0.97 | 0.11 | 0.32 | 0.33 | 0.19 | ||||||||||||
| Departure from Normal | -0.16 | +1.30 | +2.36 | -2.67 | -2.01 | -0.10 | +0.15 | +2.19 | -0.20 | -0.52 | -0.21 | -0.35 | -1.61 | ||||||||||||
| Snowfall (inches) | 6.2 | 6.9 | 0.7 | 0.0 | 0.0 | 0.0 | 0.0 | 0.0 | 0.2 | 2.2 | 4.5 | 6.6 | 1.2 | ||||||||||||
| Departure from Normal | +0.8 | +5.4 | +0.7 | 0.0 | 0.0 | 0.0 | -0.1 | -1.0 | -2.9 | -2.9 | -2.0 | +0.3 | -4.2 | ||||||||||||
| Hastings (Municipal Airport) - March 2013 - March 2014 | |||||||||||||||||||||||||
| Mar. 2013 | Apr. | May | June | July | Aug. | Sep. | Oct. | Nov. | Dec. | Jan. | Feb. | Mar. | |||||||||||||
| Average High (F) | 48.0 | 57.3 | 71.6 | 83.1 | 86.1 | 84.6 | 82.3 | 63.4 | 49.9 | 36.3 | 39.0 | 33.6 | 51.5 | ||||||||||||
| Average Low (F) | 24.5 | 33.2 | 49.5 | 60.3 | 64.4 | 65.3 | 57.6 | 40.4 | 25.1 | 12.4 | 12.8 | 13.2 | 22.5 | ||||||||||||
| Average Temperature (F) | 36.3 | 45.3 | 60.5 | 71.7 | 75.2 | 75.0 | 69.9 | 51.9 | 37.5 | 24.3 | 25.9 | 23.4 | 37.0 | ||||||||||||
| Departure from Normal (F) | -3.6 | -5.4 | -0.8 | -0.1 | -1.9 | +0.7 | +4.3 | -0.7 | -1.2 | -3.3 | -0.1 | -6.5 | -2.9 | ||||||||||||
| Precipitation (inches) | 2.25 | 2.66 | 5.67 | 1.24 | 1.77 | 3.25 | 1.26 | 4.75 | 1.00 | 0.14 | 0.37 | 0.34 | 0.15 | ||||||||||||
| Departure from Normal | +0.46 | +0.10 | +1.10 | -2.56 | -1.97 | -0.05 | -1.30 | +2.76 | -0.29 | -0.47 | -0.04 | -0.15 | -1.64 | ||||||||||||
| Snowfall NWS Office (inches) | 7.9 | 3.7 | 0.3 | 0.0 | 0.0 | 0.0 | 0.0 | 0.0 | 0.4 | 5.0 | 5.4 | 7.5 | 1.2 | ||||||||||||
| Departure from Normal | +2.7 | +2.5 | +0.3 | 0.0 | 0.0 | 0.0 | -0.2 | -1.0 | -2.2 | -1.1 | -0.6 | +1.0 | -4.0 | ||||||||||||
| Kearney (Regional Airport) - March 2013 - March 2014 (*All data from NWS coop observer with daily 24-hour obs taken around 7 AM. As a result, data may vary slightly from true "calendar day" averages) |
|||||||||||||||||||||||||
| Mar. 2013 | Apr. | May | June | July | Aug. | Sep. | Oct. | Nov. | Dec. | Jan. | Feb. | Mar. | |||||||||||||
| Average High (F)* | 49.5 | 57.3 | 72.7 | 83.8 | 85.5 | 85.7 | 82.8 | 63.0 | 49.9 | 36.9 | 39.0 | 33.2 | 49.1 | ||||||||||||
| Average Low (F)* | 23.9 | 32.4 | 49.4 | 59.5 | 62.5 | 63.9 | 55.9 | 39.5 | 25.2 | 12.6 | 12.6 | 13.2 | 19.7 | ||||||||||||
| Average Temperature (F)* | 36.7 | 44.9 | 61.0 | 71.7 | 74.0 | 74.8 | 69.3 | 51.2 | 37.5 | 24.7 | 25.8 | 23.2 | 34.4 | ||||||||||||
| Departure from Normal (F)* | -1.0 | -3.8 | +1.5 | +1.9 | -0.7 | +2.2 | +5.8 | +0.3 | +0.5 | -1.2 | +1.2 | -4.9 | -3.3 | ||||||||||||
| Precipitation (inches) | 0.62 | 4.37 | 6.54 | 1.44 | 1.98 | 2.19 | 3.77 | 3.73 | 0.72 | 0.10 | 0.28 | 0.36 | 0.11 | ||||||||||||
| Departure from Normal | -1.17 | +2.14 | +2.36 | -2.49 | -1.30 | -0.89 | +1.70 | +1.69 | -0.30 | -0.47 | -0.21 | -0.19 | -1.68 | ||||||||||||
| Snowfall (inches) | 2.3 | 2.5 | Trace | 0.0 | 0.0 | 0.0 | 0.0 | 0.0 | Trace | 2.7 | 2.8 | 5.8 | 1.3 | ||||||||||||
| Departure from Normal | -2.3 | +0.7 | 0.0 | 0.0 | 0.0 | 0.0 | -0.2 | -0.7 | -3.1 | -0.8 | -1.6 | +0.7 | -3.3 | ||||||||||||
| Ord (Evelyn Sharp Field Airport) - March 2013 - March 2014 (*Winter precipitation data may include coop observer reports due to automated airport equipment under-measuring snowfall liquid equivalent) |
|||||||||||||||||||||||||
| Mar. 2013 | Apr. | May | June | July | Aug. | Sep. | Oct. | Nov. | Dec. | Jan. | Feb. | Mar. | |||||||||||||
| Average High (F) | 46.7 | 56.5 | 71.0 | 81.0 | 85.9 | 84.4 | 81.9 | 61.0 | 48.7 | MSG | 38.3 | 33.1 | 49.8 | ||||||||||||
| Average Low (F) | 20.1 | 28.9 | 46.9 | 56.5 | 60.9 | 62.5 | 54.3 | 35.0 | 20.3 | MSG | 9.8 | 7.8 | 18.6 | ||||||||||||
| Average Temperature (F) | 33.4 | 42.7 | 59.0 | 68.8 | 73.4 | 73.5 | 68.1 | 48.0 | 34.5 | MSG | 24.0 | 20.4 | 34.2 | ||||||||||||
| Departure from Normal (F) | -4.3 | -6.1 | -0.3 | -0.4 | -1.0 | +0.5 | +4.5 | -1.6 | -1.8 | MSG | -0.6 | -7.4 | -3.5 | ||||||||||||
| Precipitation (inches)* | 0.61 | 2.51 | 5.40 | 1.93 | 3.59 | 3.77 | 2.80 | 1.62 | 0.50 | Trace | 0.06 | 0.19 | 0.20 | ||||||||||||
| Departure from Normal | -0.84 | -0.08 | +1.59 | -2.19 | +0.62 | +0.61 | +0.36 | -0.31 | -0.57 | -0.59 | -0.31 | -0.25 | -1.25 | ||||||||||||
| Snowfall (Coop Observer) | 4.0 | 7.0 | Trace | 0.0 | 0.0 | 0.0 | 0.0 | 0.0 | 3.5 | 0.5 | 2.5 | 5.5 | 4.0 | ||||||||||||
| Departure from Normal | -1.9 | +4.5 | 0.0 | 0.0 | 0.0 | 0.0 | 0.0 | -1.1 | -1.8 | -6.9 | -4.3 | -0.5 | -1.9 | ||||||||||||
| Smith Center, KS (Cooperative Observer) - March 2013 - March 2014 (*All data from NWS coop observer with daily 24-hour obs taken around 7 AM. As a result, data may vary slightly from true "calendar day" averages) |
|||||||||||||||||||||||||
| Mar. 2013 | Apr. | May | June | July | Aug. | Sep. | Oct. | Nov. | Dec. | Jan. | Feb. | Mar. | |||||||||||||
| Average High (F)* | 50.3 | 60.0 | 76.0 | 88.6 | 89.2 | 88.9 | 86.1 | 68.4 | 52.8 | 38.9 | 41.4 | 36.1 | 52.8 | ||||||||||||
| Average Low (F)* | 23.8 | 32.8 | 49.6 | 59.6 | 64.6 | 64.6 | 58.1 | 40.2 | 25.5 | 13.8 | 12.7 | 13.3 | 21.9 | ||||||||||||
| Average Temperature (F)* | 37.1 | 46.4 | 62.8 | 74.1 | 76.9 | 76.8 | 72.1 | 54.3 | 39.2 | 26.4 | 27.1 | 24.7 | 37.4 | ||||||||||||
| Departure from Normal (F)* | -4.5 | -6.1 | -0.9 | +0.1 | -2.8 | -0.4 | +3.9 | -0.5 | -1.2 | -2.4 | -0.6 | -7.3 | -4.2 | ||||||||||||
| Precipitation (inches) | 2.23 | 1.88 | 3.11 | 2.80 | 4.01 | 3.16 | 1.93 | 0.87 | 1.29 | 0.23 | 0.35 | 0.84 | 0.12 | ||||||||||||
| Departure from Normal | +0.36 | -0.39 | -0.81 | -0.81 | +0.14 | -0.14 | -0.11 | -1.01 | +0.07 | -0.43 | -0.14 | +0.26 | -1.75 | ||||||||||||
| Snowfall (inches) | 10.0 | 0.8 | Trace | 0.0 | 0.0 | 0.0 | 0.0 | 0.0 | Trace | 5.3 | 6.9 | 14.8 | 2.4 | ||||||||||||
| Departure from Normal | +7.4 | +0.2 | 0.0 | 0.0 | 0.0 | 0.0 | -0.2 | -0.4 | -1.8 | +2.1 | +3.2 | +10.7 | -0.2 | ||||||||||||
Most of the following images depicting March 2014 Precipitation and Temperatures are courtesy of the High Plains Regional Climate Center:
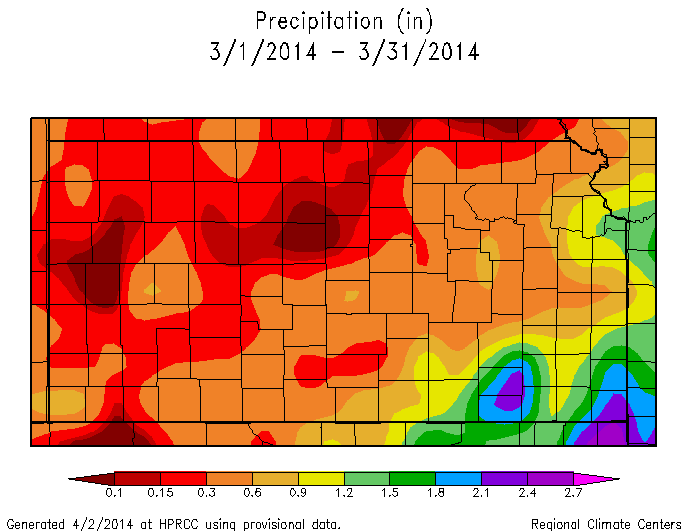
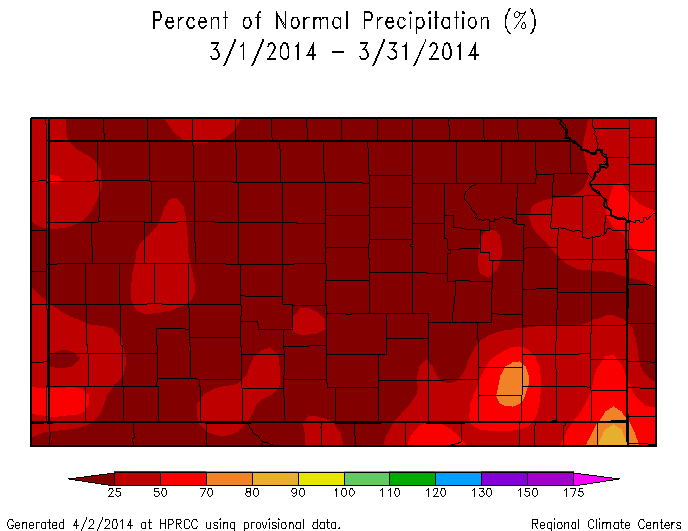
* Please note: These maps are a "best-approximation" of actual measured values, and data reflected on these maps may not exactly match actual values due to the effects of interpolation and "smoothing" used to create the maps. In addition, some "bullseyes" may be a result of missing data.
Click Images To Enlarge
| Nebraska: March 2014 Measured Precipitation (Inches) |
Kansas: March 2014 Measured Precipitation (Inches) |
 |
 |
| Nebraska: March 2014 Percent of Normal Measured Precip. |
Kansas: March 2014 Percent of Normal Measured Precip. |
 |
 |
| NWS Hastings Area: March 2014 Total "Observed" Precipitation Based On AHPS Precipitation Analysis Including Radar Data |
|
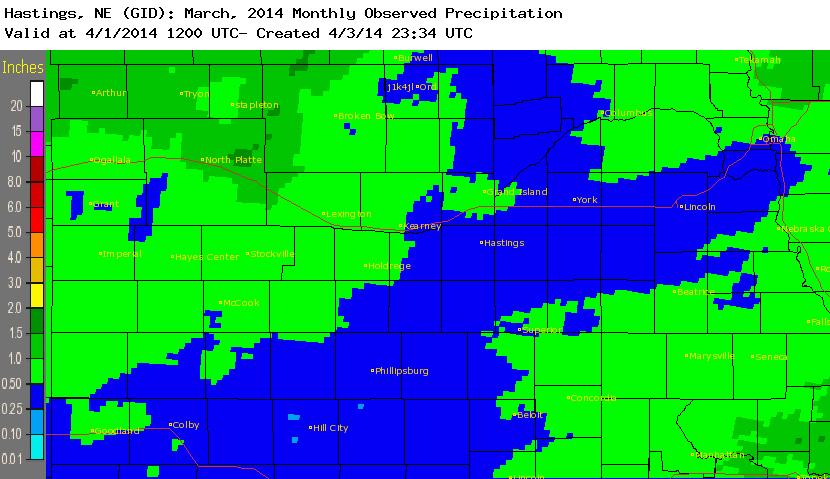 |
While the precipitation images above are based strictly on gauge-measured data, this image on the left utilizes an "Observed" multisensor approach created by River Forecast Centers. Hourly precipitation estimates from WSR-88D NEXRAD radar are compared to ground rainfall gauge reports, and a bias (correction factor) is calculated and applied to the radar field. For much more information on these types of images, and to create your own precipitation maps, please visit the following site: https://www.srh.noaa.gov/ridge2/ |
| Nebraska: March 2014 Temperature Departure from Normal (F) |
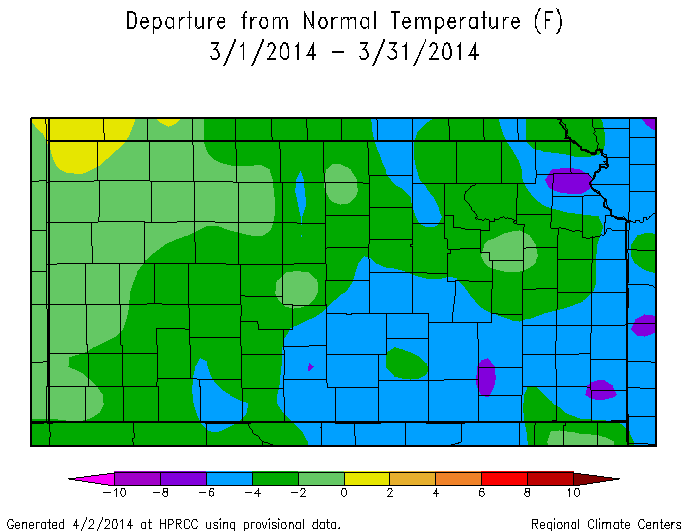
Kansas: March 2014 Temperature Departure from Normal (F) |
 |
 |
The following drought category images, current as of April 1, 2014, are courtesy of the U.S. Drought Monitor (see narrative above for more details):
Click Images To Enlarge
 |
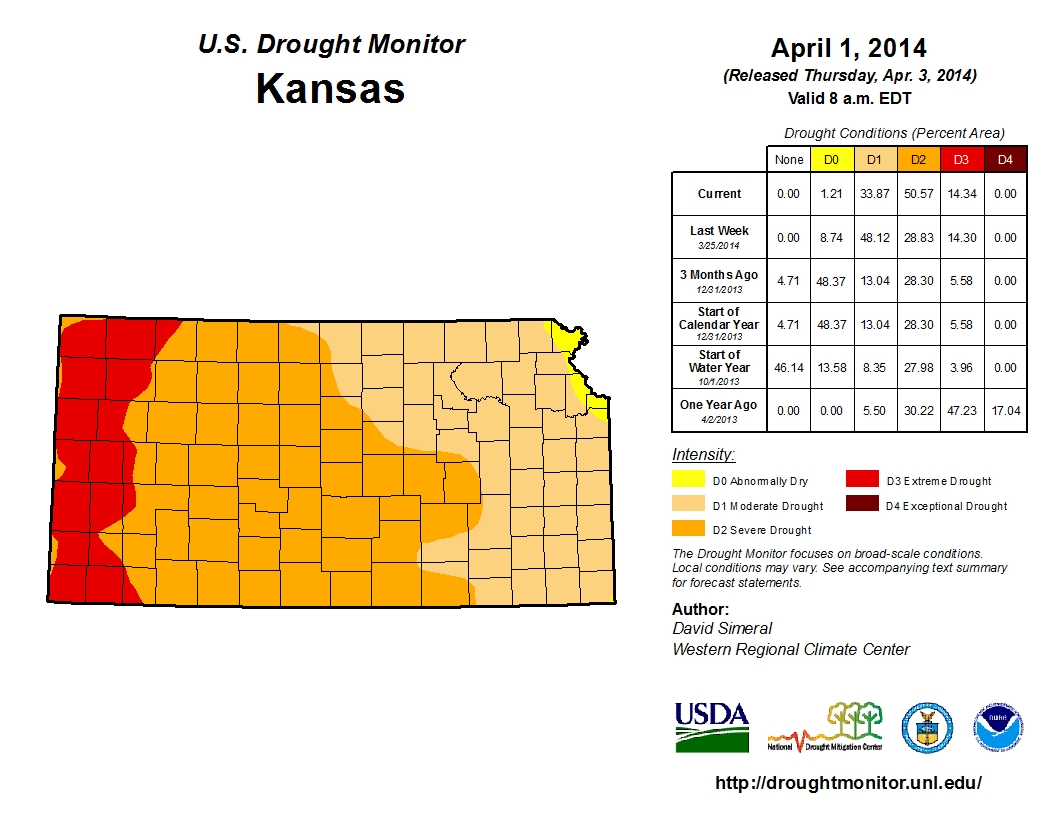 |
| Nebraska - U.S. Drought Monitor as of April 1, 2014 | Kansas - U.S. Drought Monitor as of April 1, 2014 |
For more climate related information, check out the following websites:
| This page was composed by the staff at the National Weather Service in Hastings, Nebraska. |

