
Numerous severe thunderstorms are expected across a broad region from the Ohio Valley to the Mid-Atlantic and Northeast States today into tonight. Swaths of damaging wind gusts are expected and some tornadoes are possible. Bertha is expected to bring tropical storm conditions to portions of the Gulf Coast from the Florida Panhandle westward to southeastern Louisiana later today and Wednesday. Read More >
On weather.gov/gjt, you can access various climate records for several locations across eastern Utah and western Colorado. Here’s a complete, easy-to-follow guide on how to access and utilize the wide range of climate related products on the NWS Grand Junction website.
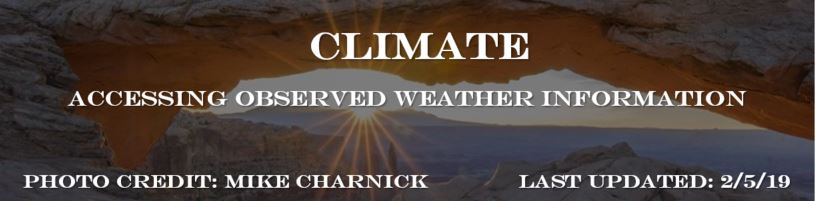
Daily, Monthly, Seasonal, Annual and other Climate Summaries:
To search for the daily, monthly, seasonal, and annual climate summaries, as well as some regional and state summaries, you will need to access the “Local Climate” section under the “Climate and Past Weather” tab:
From here, you can choose from a selection of climate products across the region. The daily, monthly, seasonal, and annual summaries are great for seeing the respective high/low temperatures or total precipitation and comparing all those values to the average. By clicking the other tabs, you can learn more about where we have our official climate stations or learn how to access the Climate Prediction Center’s forecasts for either the two-week, monthly or seasonal time period. Additionally, you can gain access to a wide variety of climate resources including NOAA’s El Nino and La Nina pages or simply other regional climate centers for the United States.
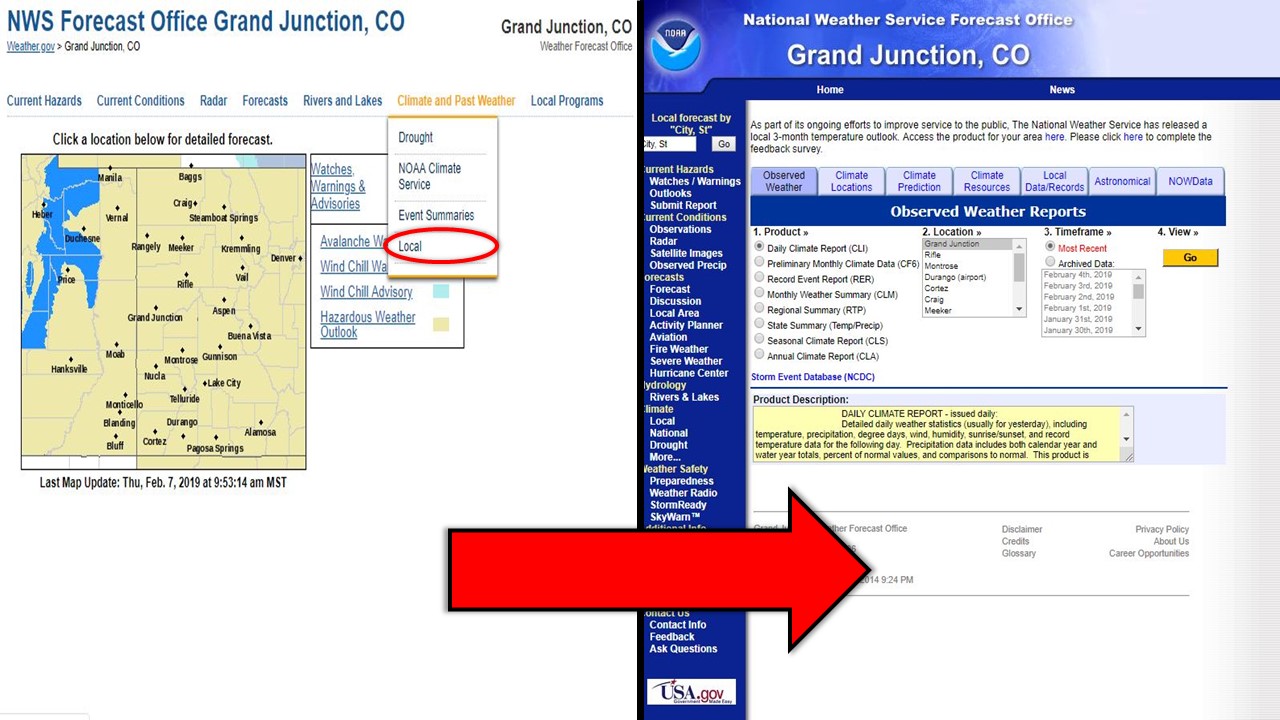
NOWData:
NOWData, also known as NOAA Online Weather Data, provides up-to-date information based on archived AND preliminary data holdings by NOAA across eastern Utah and western Colorado. You can access NOWData by clicking the far right tab after you select “Local” climate from the “Climate and Past Weather” drop down menu.
There are many datasets available using the NOWData page. Here’s a walkthrough for accessing some of the most widely-used data:
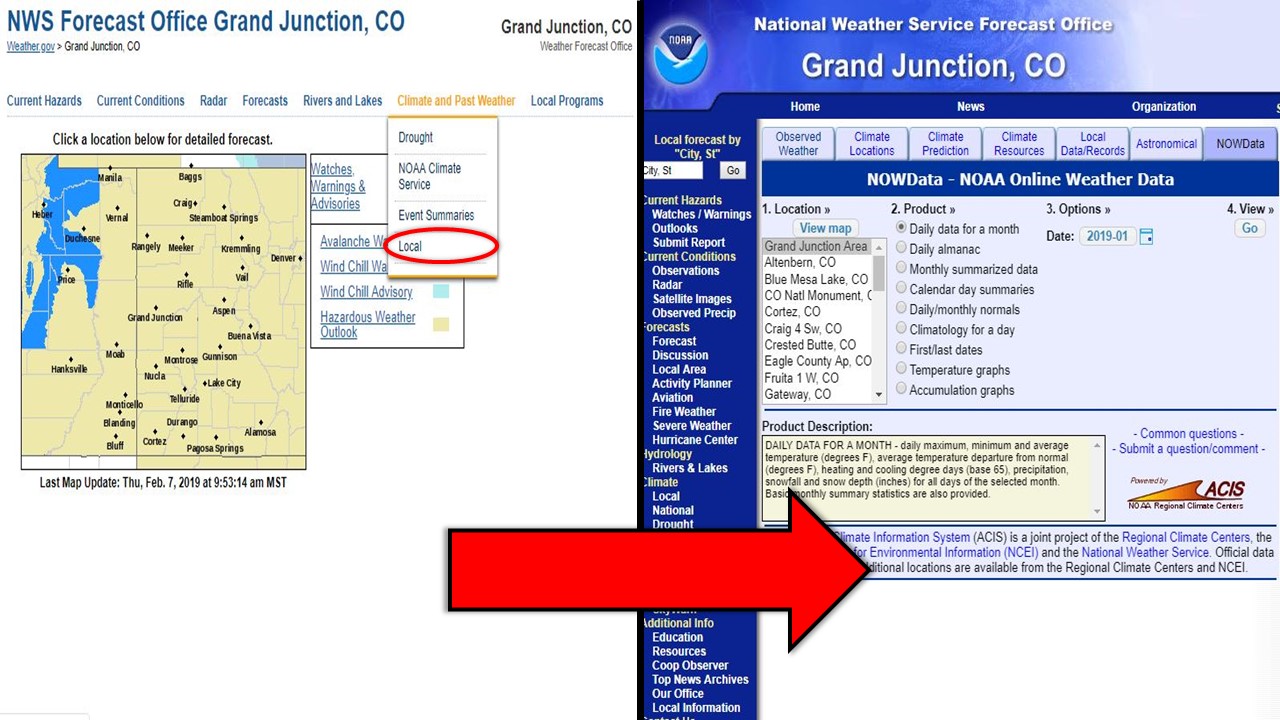
Drought:
From the same “Climate and Past Weather” tab on the NWS Grand Junction homepage, you can also access the latest information on the drought. Just click “Drought” and you’ll be redirected to the National Integrated Drought Information System (NIDIS) website.
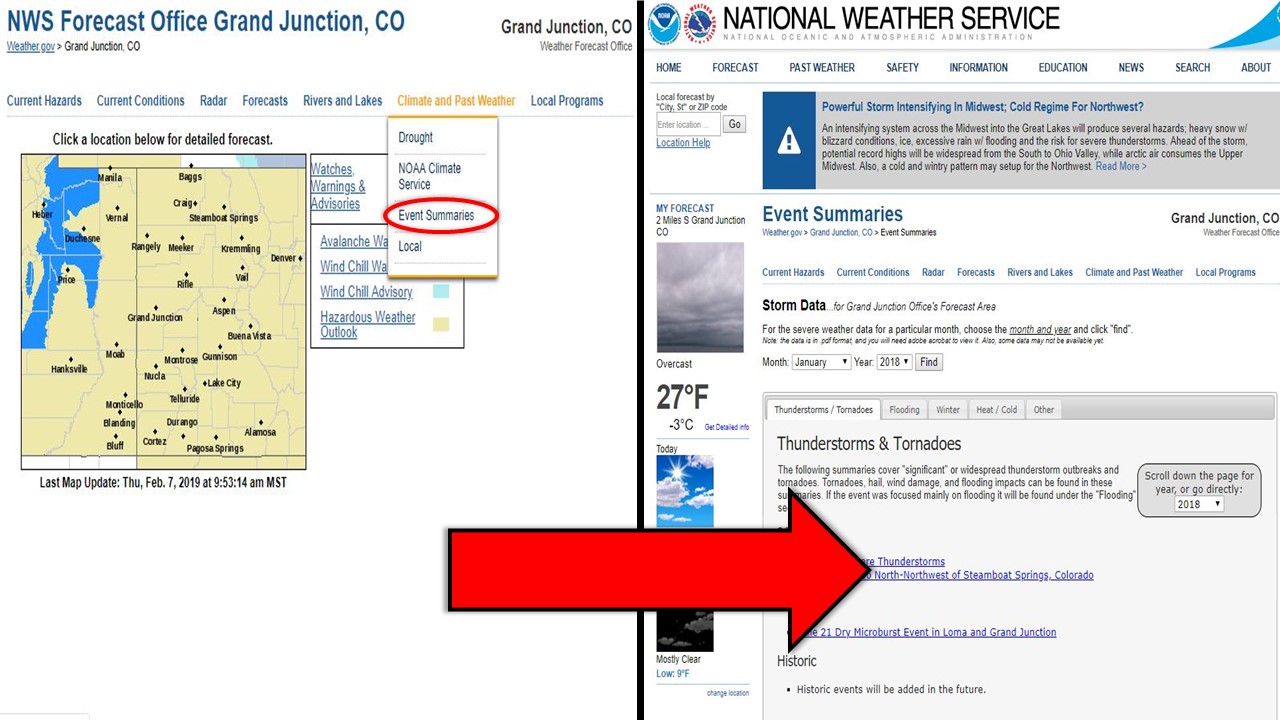
Event Summaries:
Curious about that big snow storm you experienced last winter? Or how about that tornado you heard occurred up in Routt County? You can learn more about some of the biggest or most impressive weather events that have occurred across eastern Utah and western Colorado by clicking “Event Summaries” underneath the “Climate and Past Weather” drop down.
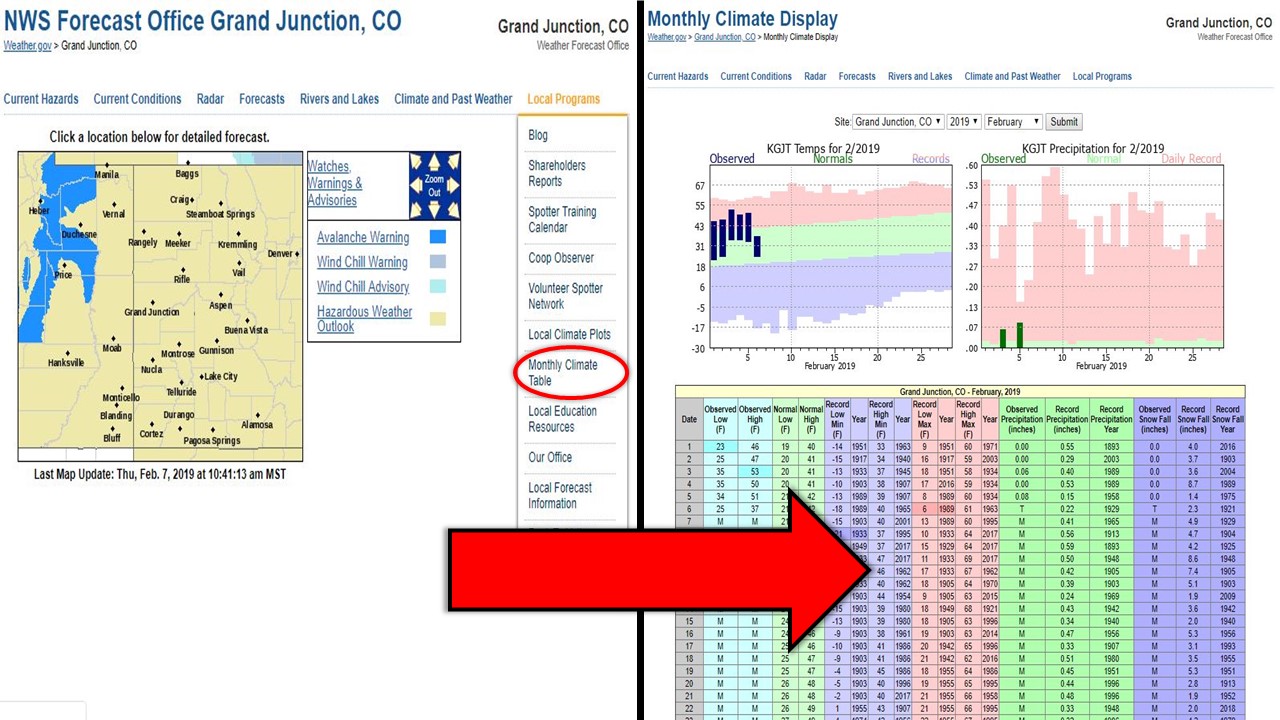
Monthly Climate Summary and Comparison for Grand Junction:
For those of you in the Grand Junction area, we have another resource where you can access the monthly climate summary so far and how the observed temperatures and precipitation compare to normal. Simply go to the “Local Programs” tab and then select “Monthly Climate Table”.
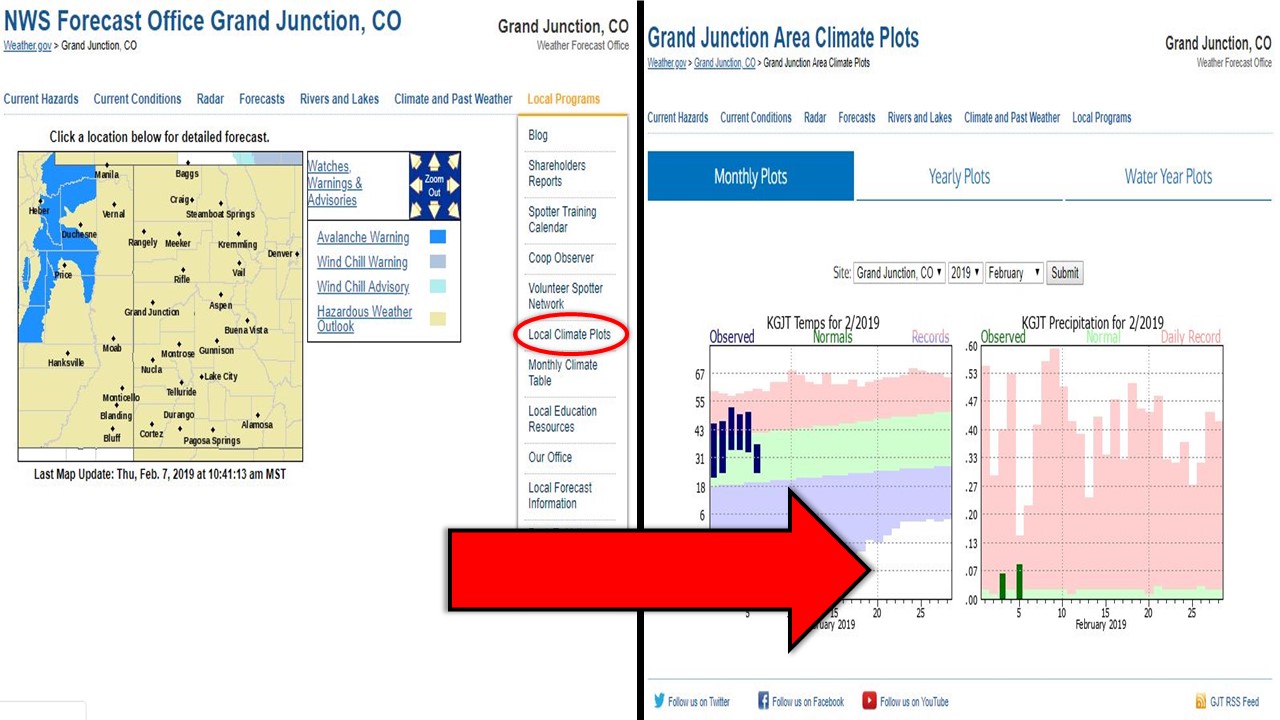
Monthly, Yearly, and Water Year Precipitation Summary for Grand Junction:
Or, if you’re interested in how the precipitation to date compares to the monthly or yearly normal, click on “Local Climate Plots” underneath that same “Local Programs” tab. Additionally, you can see how the water year precipitation (October 1st – September 30th) compares to normal by clicking on the tab to the far right.
If you have any other questions on accessing climate information on our website, don’t hesitate to call us at 970-243-7007 or email us at wxgjt@noaa.gov.

