Numerous severe thunderstorms are expected across a broad region from the Ohio Valley to the Mid-Atlantic and Northeast States today into tonight. Swaths of damaging wind gusts are expected and some tornadoes are possible. Bertha is expected to bring tropical storm conditions to portions of the Gulf Coast from the Florida Panhandle westward to southeastern Louisiana later today and Wednesday. Read More >
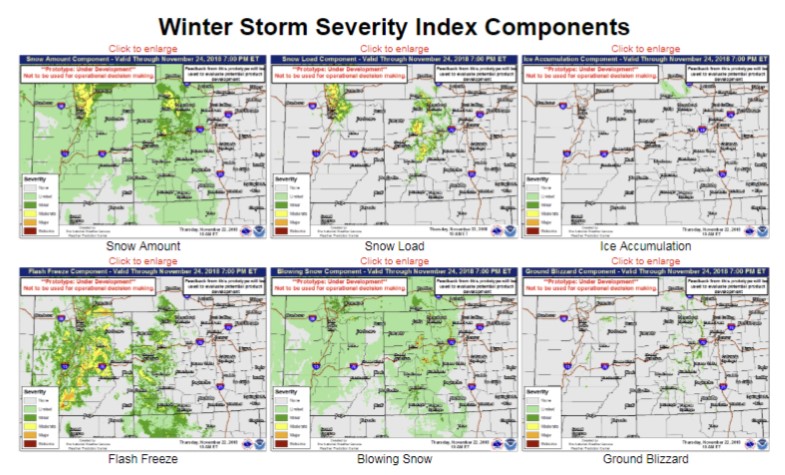
The purpose of the Winter Storm Severity Index (WSSI) is to provide National Weather Service (NWS) partners and the general public with an indication of the level of winter precipitation (snow and ice) severity and its potential related societal impacts. The WSSI does not depict official warnings, and should always be used in context with official NWS forecasts and warnings.
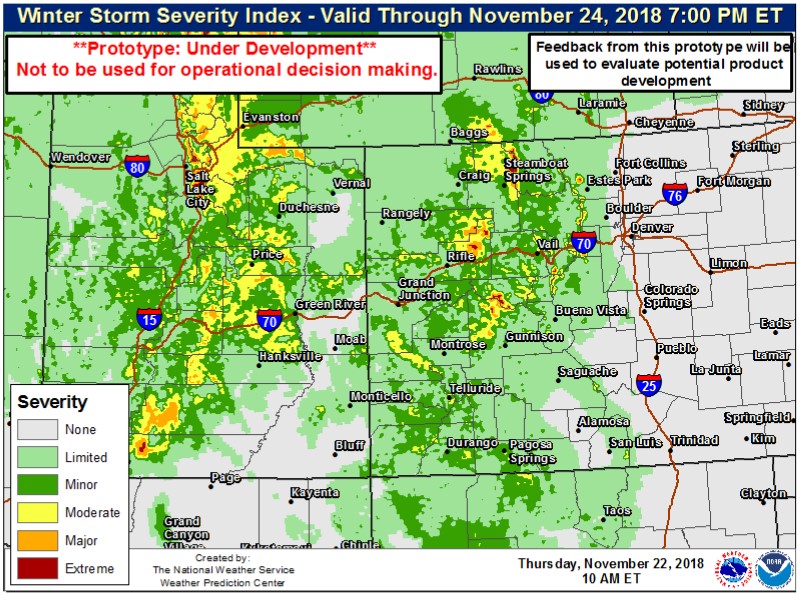
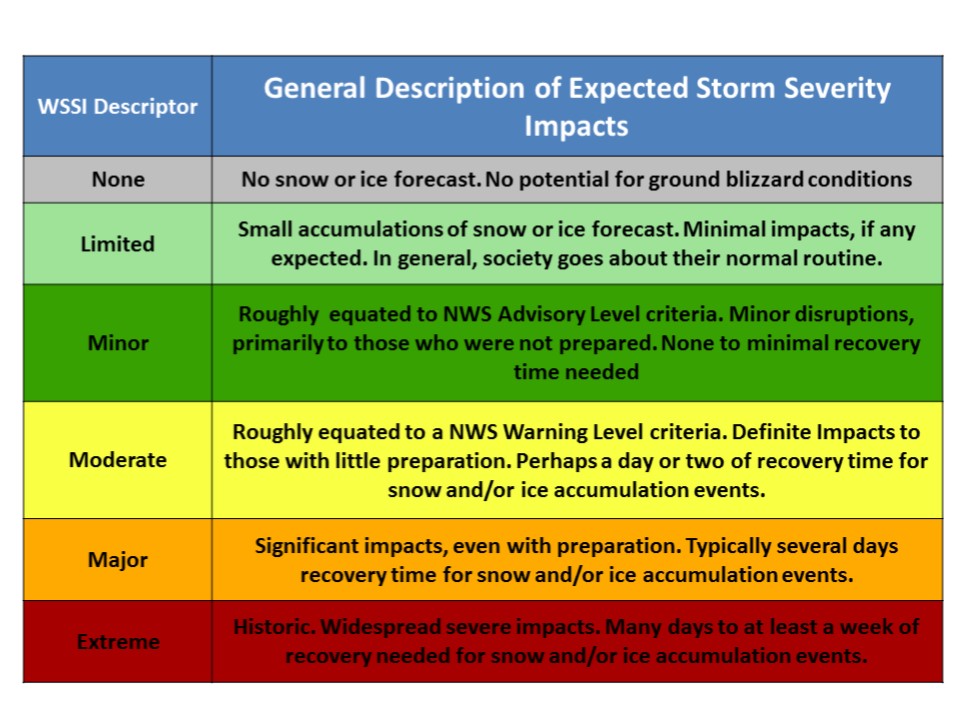
The prototype WSSI is actually a series of component algorithms, each of which use meteorological (NWS forecast parameters—for example, snow accumulation, blowing snow, wind speed, and temperature) and non-meteorological data (noted below) to model predicted severity of specific characteristics of winter weather. Each of the components produce a 1 to 5 output scale value that equates to the potential severity based on the winter weather hazards. The final WSSI value is the maximum value from all the sub-components. The 5 levels are given the following descriptors: Limited, Minor, Moderate, Major, and Extreme.
Non-forecast datasets include:
· Urban area designation
· Land-use designations
· National Oceanic and Atmospheric Administration (NOAA)/National Centers for Environmental Information (NCEI) gridded annual snowfall climatology
Six components of the WSSI are explained in detail below. Any given storm will have different levels of impact from these individual components.
Snow Load Component
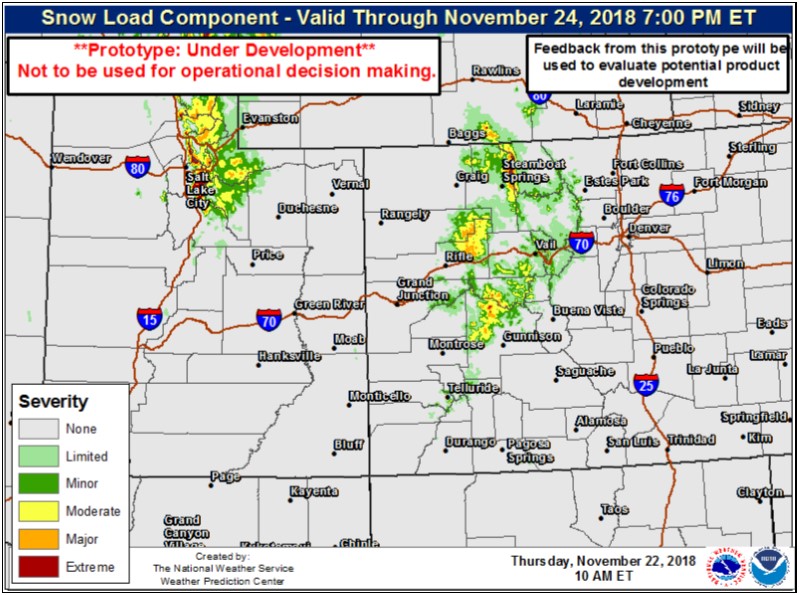
Snow Load Index indicates potential infrastructure impacts (e.g., downed trees/power lines) due to the weight of the snow. This index accounts for the land cover type. For example, more forested and urban areas will show increased severity versus the same snow conditions in grasslands.
Snow Amount Index
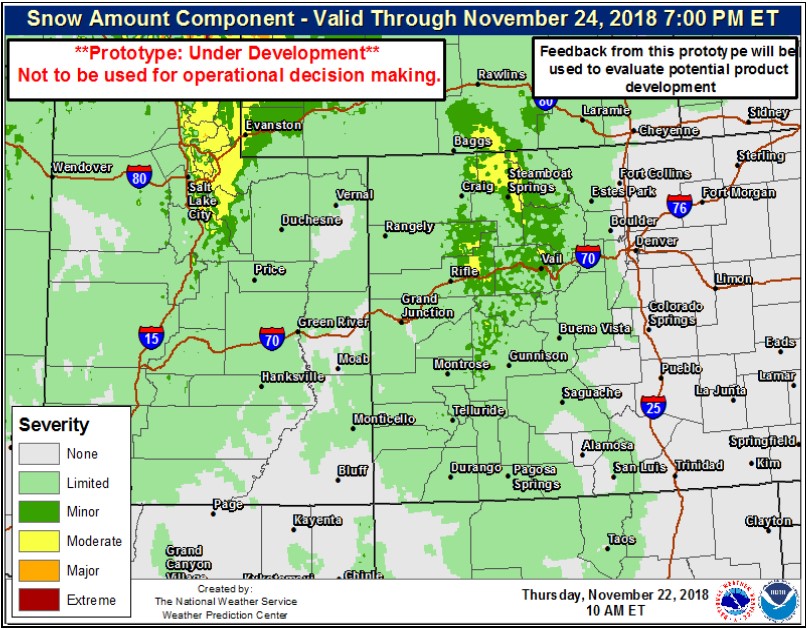
Snow Amount Index indicates potential impacts due to the total amount of snow or the snow accumulation rate. This index also normalizes for climatology, such that regions of the country that experience, on average, less snowfall will show a higher level of severity for the same amount of snow that is forecast across a region that experiences more snowfall on average. Designated urban areas are also weighted a little more than non-urban areas.
Ice Accumulation
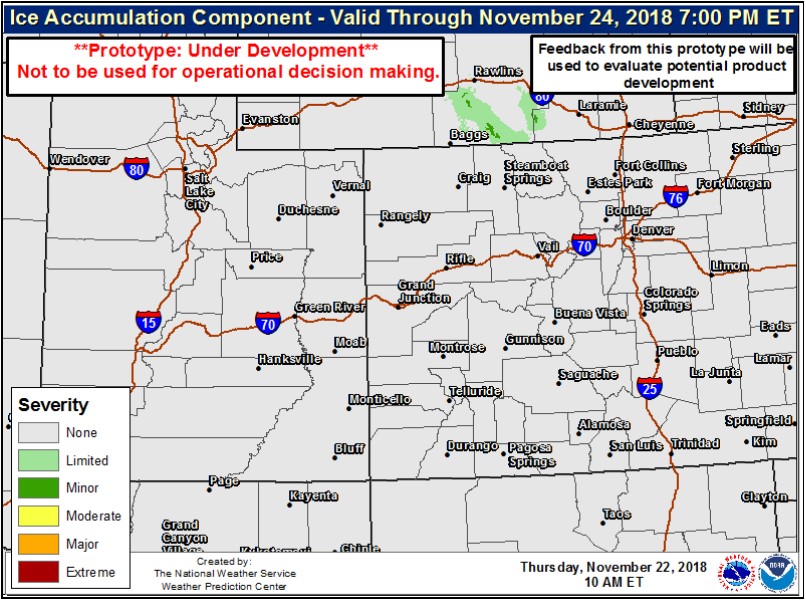
Ice Accumulation indicates potential infrastructure impacts (e.g., downed trees/power lines, roads/bridges) due to combined effects and severity of ice and wind. Designated urban areas are also weighted a little more than non-urban areas. Please note that not all NWS offices provide ice accumulation information into the NDFD. In those areas, the ice accumulation is not calculated.
Blowing Snow Index
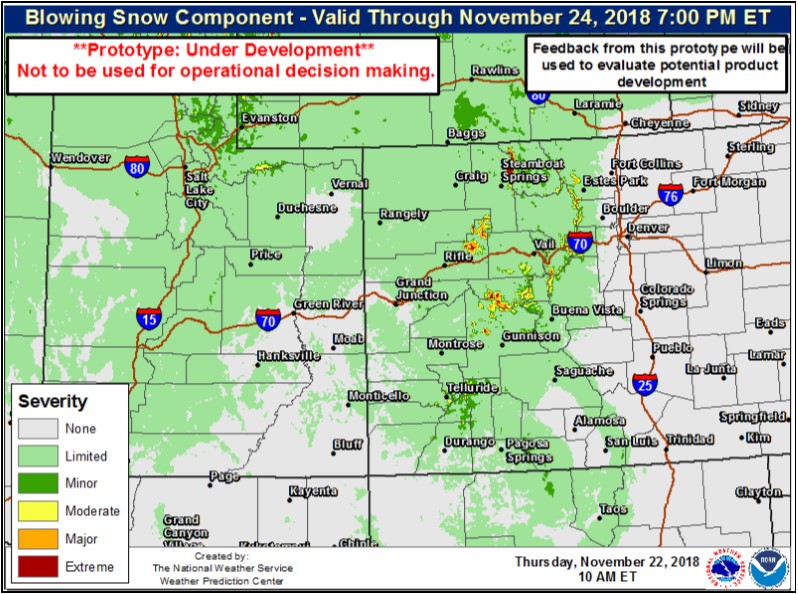
Blowing Snow Index indicates the potential disruption due to blowing and drifting snow. This index accounts for land use type. For example, more densely forested areas will show less blowing snow than open grassland areas.
Flash Freeze Index
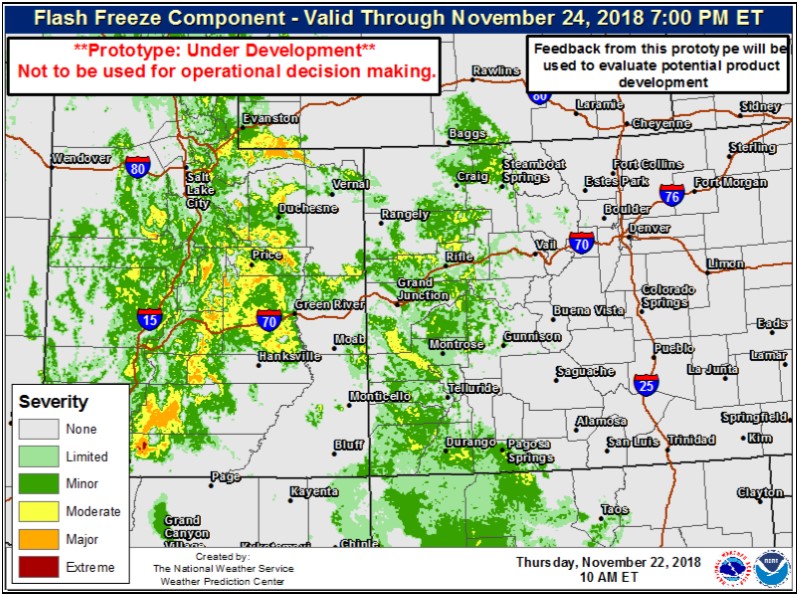
Flash Freeze Index indicates the potential impacts of flash freezing (temperatures starting above freezing and quickly dropping below freezing) during or after precipitation events.
Ground Blizzard
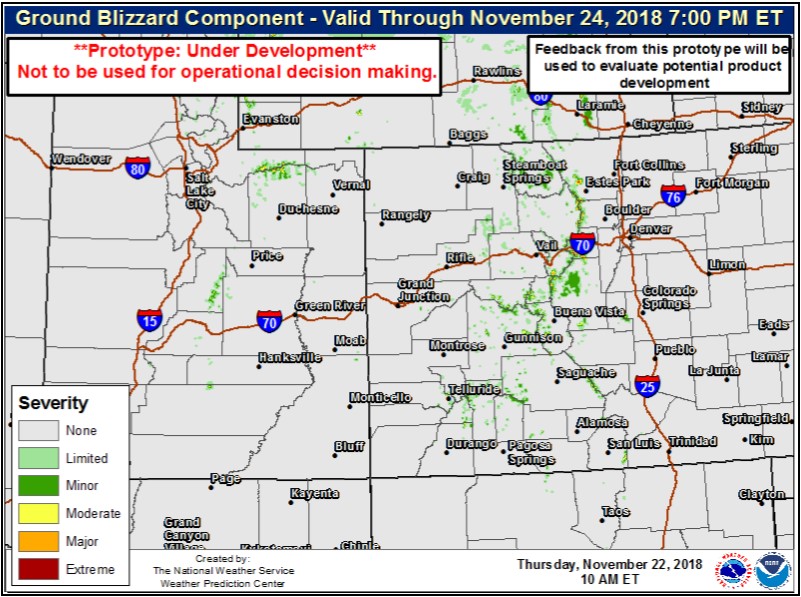
Ground Blizzard indicates the potential travel-related impacts of strong winds interacting with pre-existing snow cover. This is the only sub-component that does not require snow to be forecast in order for calculations to be made. The NOHRSC snow cover data along with forecast winds are used to model the ground blizzard. Adjustments are made based upon the land cover type. For example, heavily forested areas will have a lower ground blizzard severity than the same conditions occurring across open areas.
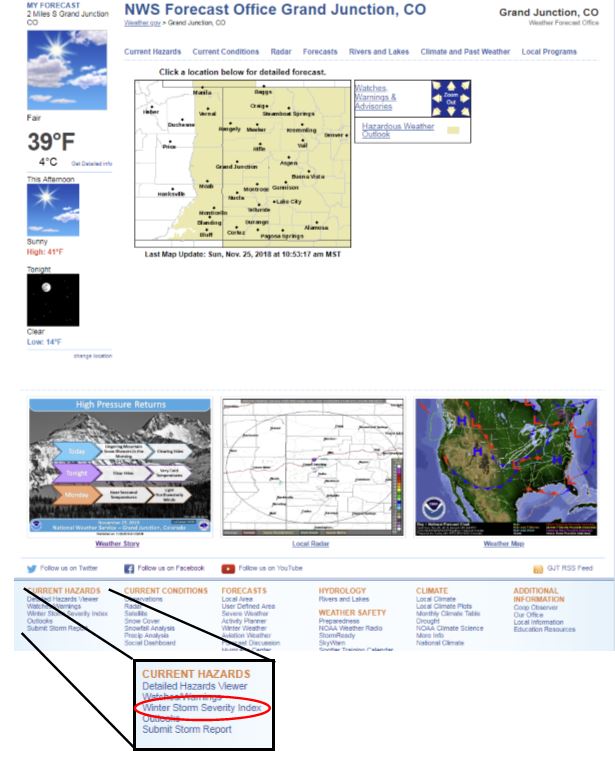
Where can you find the Winter Storm Severity Index Prototype Product? A link is found in the CURRENT HAZARDS menu at the bottom of our NWS Grand Junction, Colorado website homepage. If you have any other questions on accessing the WSSI on our website, don't hesitate to call us at 970-243-7007 or email us at wxgjt@noaa.gov.