|
Upper Level Features:
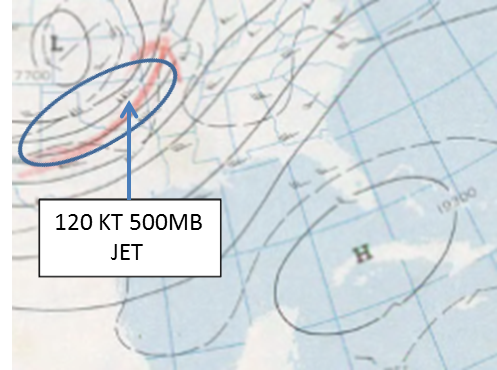
A strong upper level jet maximum at 500 mb was also associated with this system, along with a strong low level wind profile. This created abundant wind energy and shear for developing storms to work with on April 3rd, 1974. Below is a upper level plot of the 500 mb features at 6 am on April 3, 1974
|
|
|
|
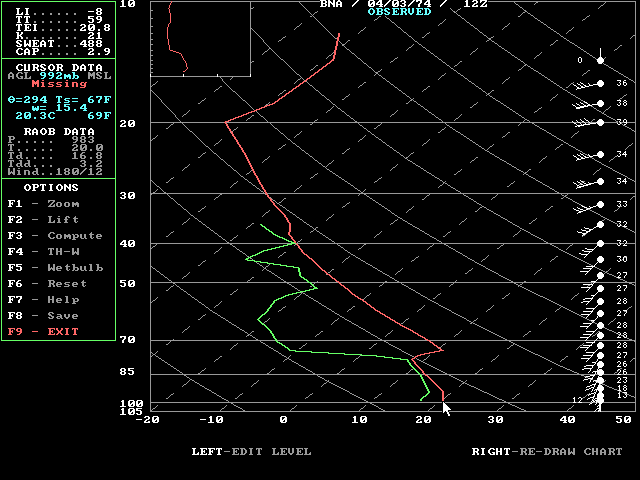
SHARP Sounding Data From April 3, 1974
Very Strong Winds Shear Develops:
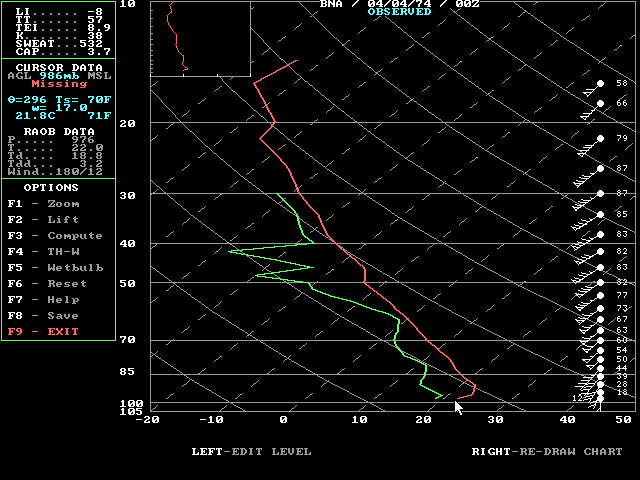
As a proxy for the Huntsville Forecast area, the Nashville sounding was reanalyzed using the NSHARP program. These images can be seen below. These images include the 6 AM (12Z - Image 1) and 6 PM (00Z - Image 2) April 3rd, 1974 soundings and show the upper level characteristics of the atmosphere at those times on April 3rd. You can notice a sudden strengthening of the winds between 850 mb (level labeled 85 on the diagrams) and 700 mb (level labeled 70 on the diagrams). The winds at 850 mb increase from around 24 knots at 6 AM to around 40 kts by 6 PM. At 700 mb, the winds increase from 28 kts to 60 knots as well. Likely the winds became even stronger at these levels and 500 mb between 6 PM and midnight, as the core of the main low level jet likely pushed across northern Alabama and southern middle Tennessee. This produced very high and deep shear parameters over the area, which is very condusive for destructive tornado developement given ample instability.
|
 |
|
Image 1 - Nashville Sounding from 6 AM on April 3, 1974
|
 |
|
Image 2 - Nashville Sounding from 6 PM April 3, 1974
|
Click Here to Go To the Top of the Page.
Click Here to Go To the main page. |
|
Surface and Elevated Instability Increases Significantly:
In both soundings above, steep lapse rates (how quickly temperature decreases with height) of -8 can be seen in image 1 and 2 on April 3rd, 1974. However, early in the day, there was a lid where temperatures increased with height near the surface (keeping air from rising by itself). Afternoon temperatures rose to between 75 and 80 degrees in northern Alabama and southern Middle Tennessee just south of the warm front. As this occurred, lapse rates increased and became surface based in response ahead of an approaching cold front. The lapse rates were likely steeper than indicated in image 2 above between 4 and 6 pm, when some of the F5 tornadoes began in Alabama. This allowed storms to tap into strong lift (due to steep lapse rates) ,high shear, and abundant surface based instability (CAPE), producing the rash of strong to violent tornadoes.
|
|


 Local Radar
 Weather Map