Overview
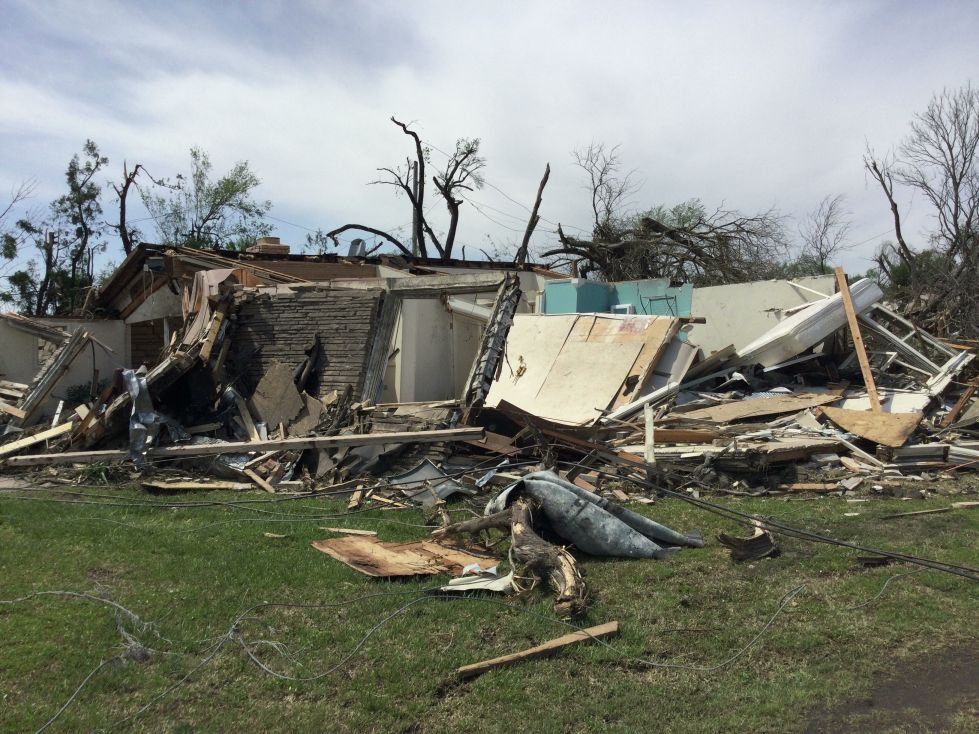
A powerful low pressure system approached Kansas on Friday April 29th allowing a sharp dryline to track to generally along Interstate 135. Storms first developed across central and northeast Kansas near the warm front, but as the early evening hours continued, a couple storms fired just east of Wichita. One of these storms produced a strong tornado across the east side of Andover, causing extensive damage. This tornado was eventually rated an EF-3. This same storm produced numerous additional tornadoes as it tracked east.
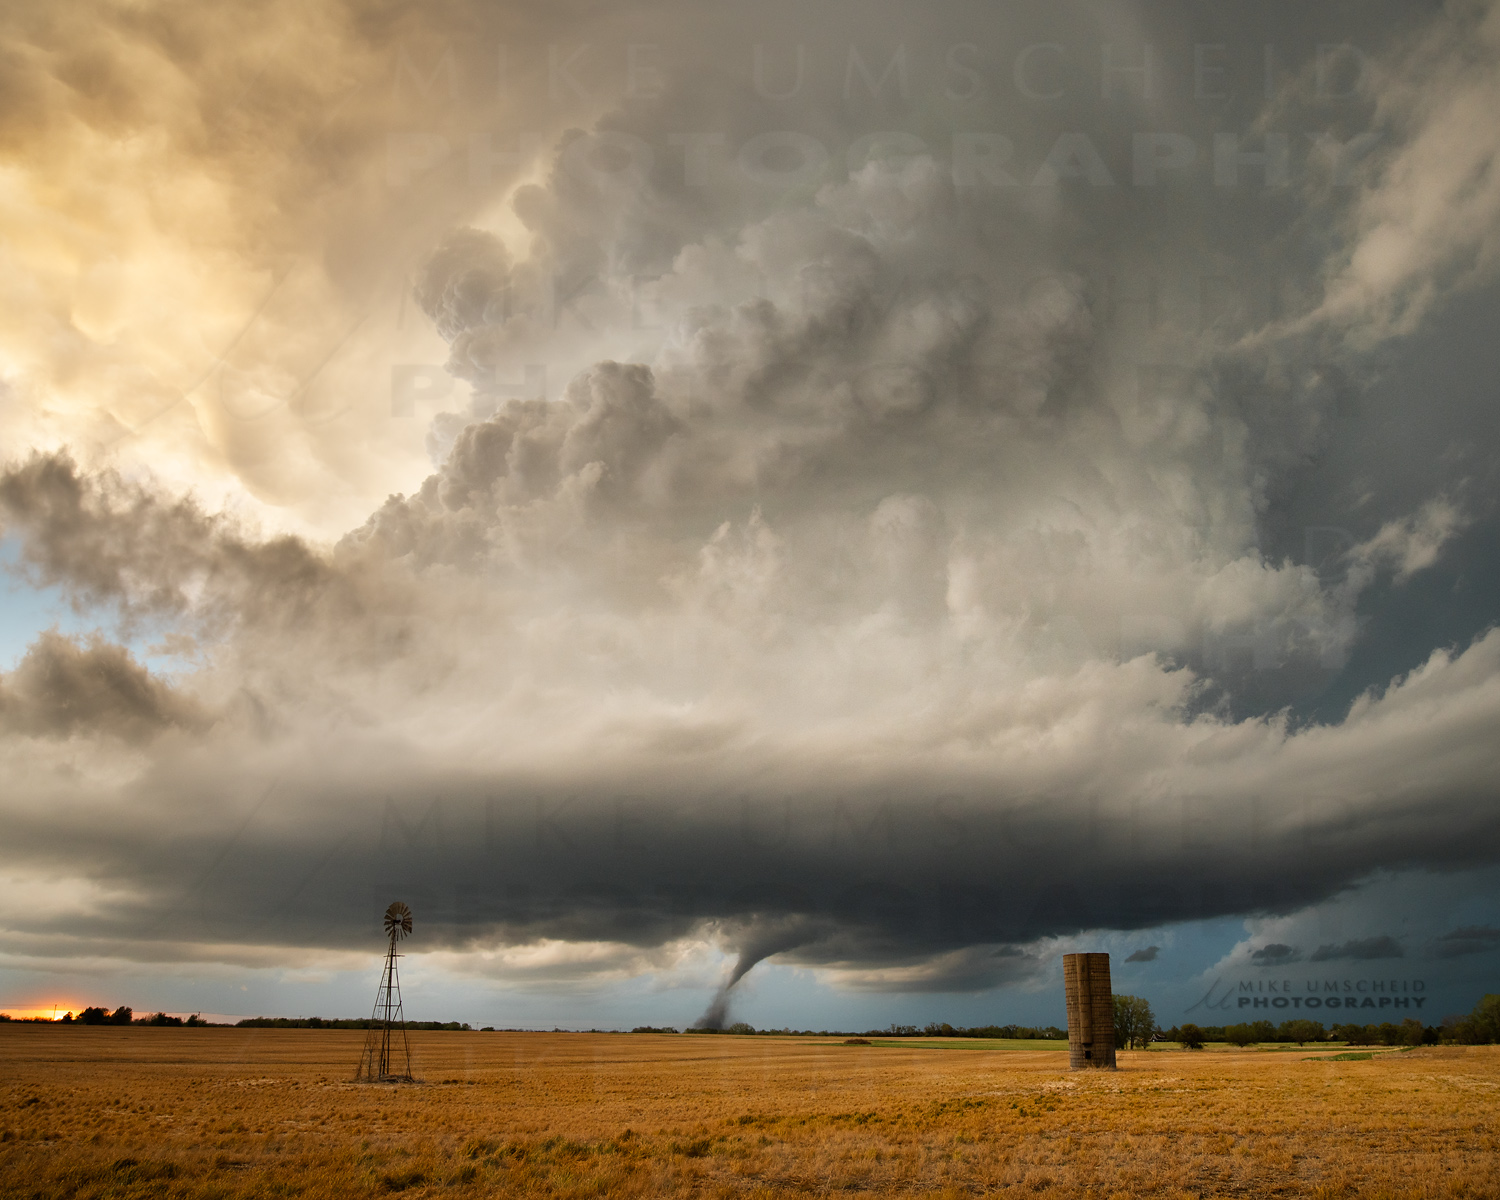
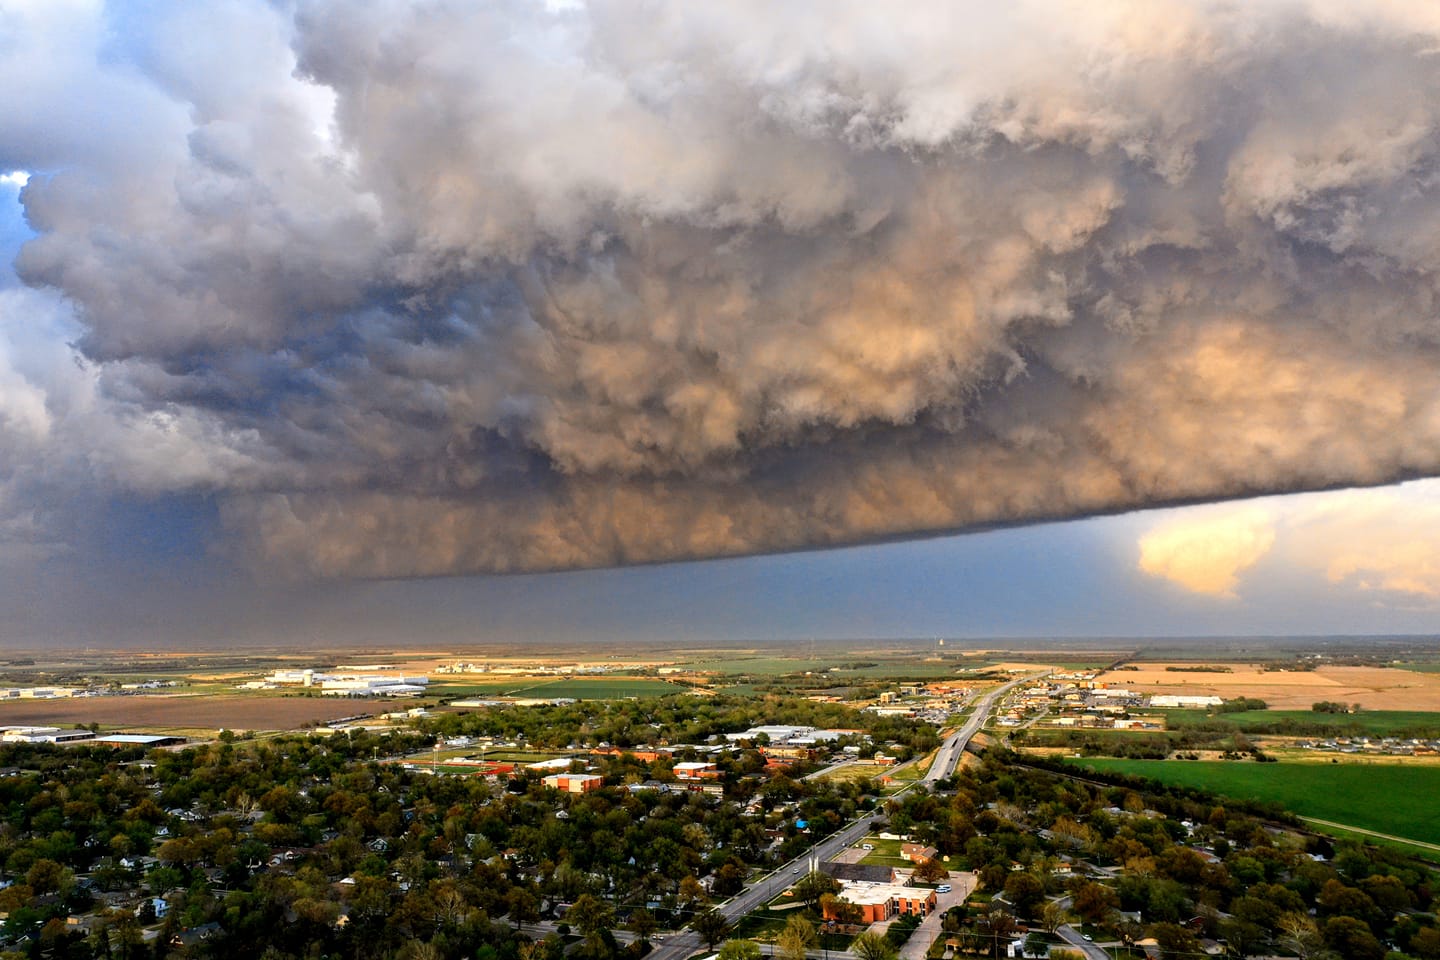
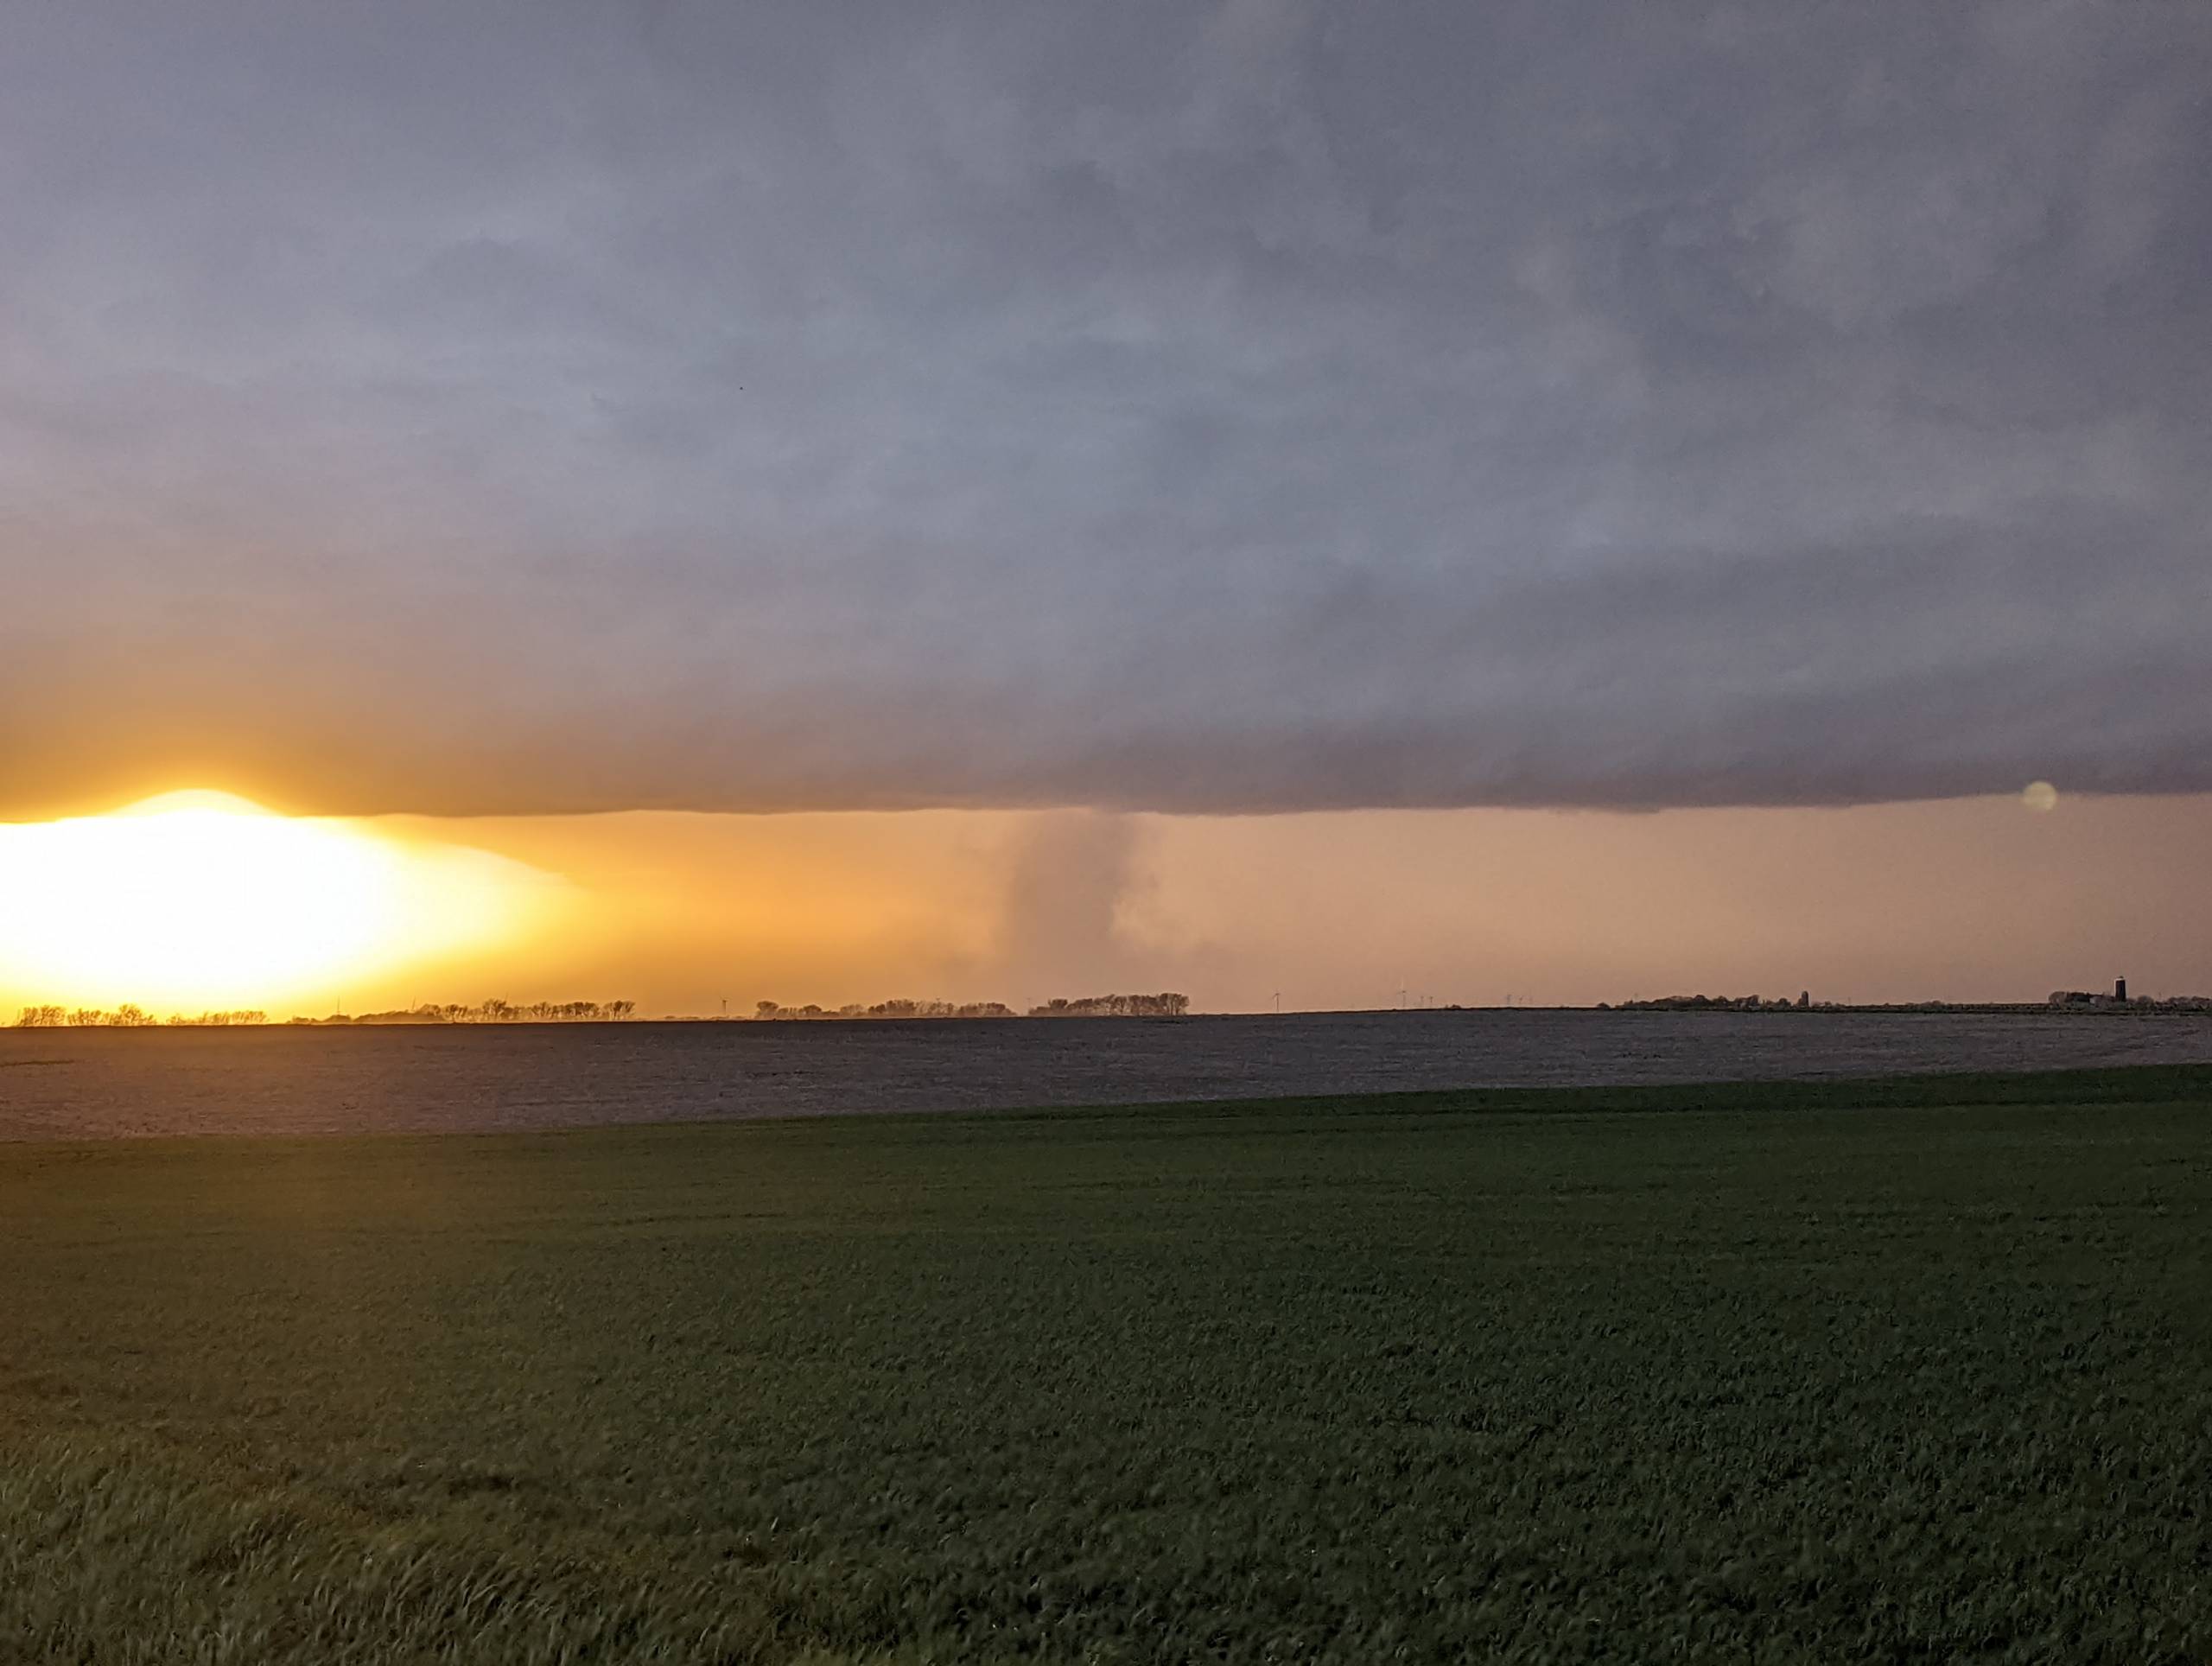
Picture by Mike Umscheid (@mikeumsc)
Tornadoes:
|
Preliminary info for Andover Tornado
Track Map 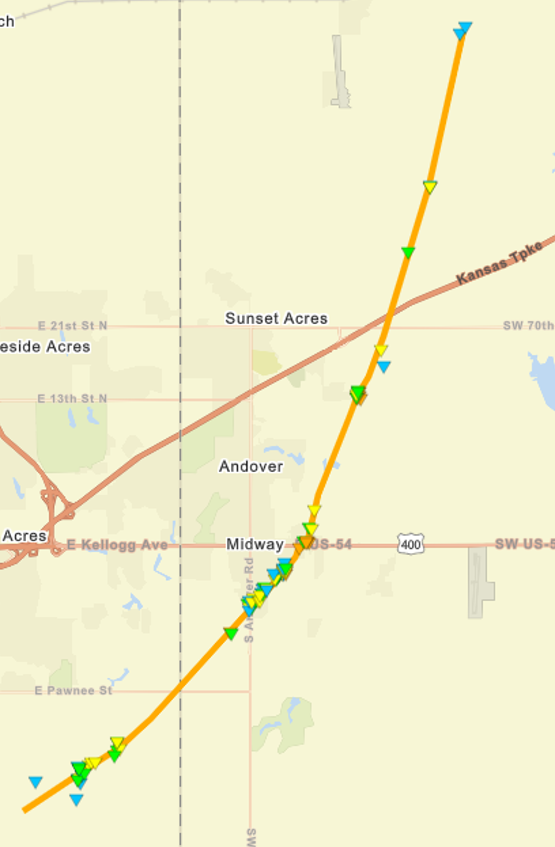 
|
|||||||||||||||||||||||||
|
Tornado - Rosalia
Track Map 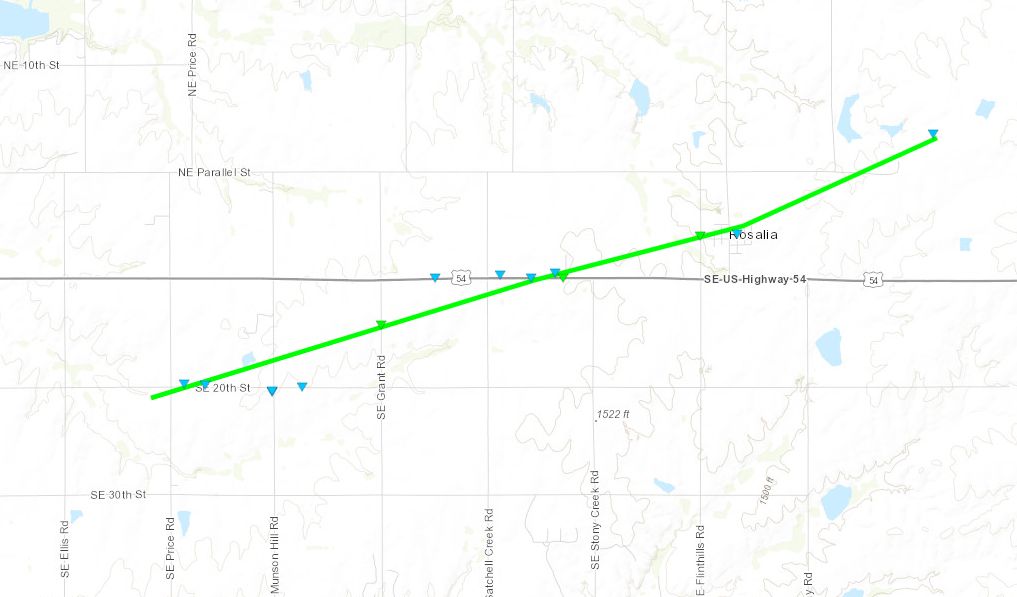
Downloadable KMZ File
|
||||||||||||||||||
|
Tornado - 4 N of Tampa
Track Map 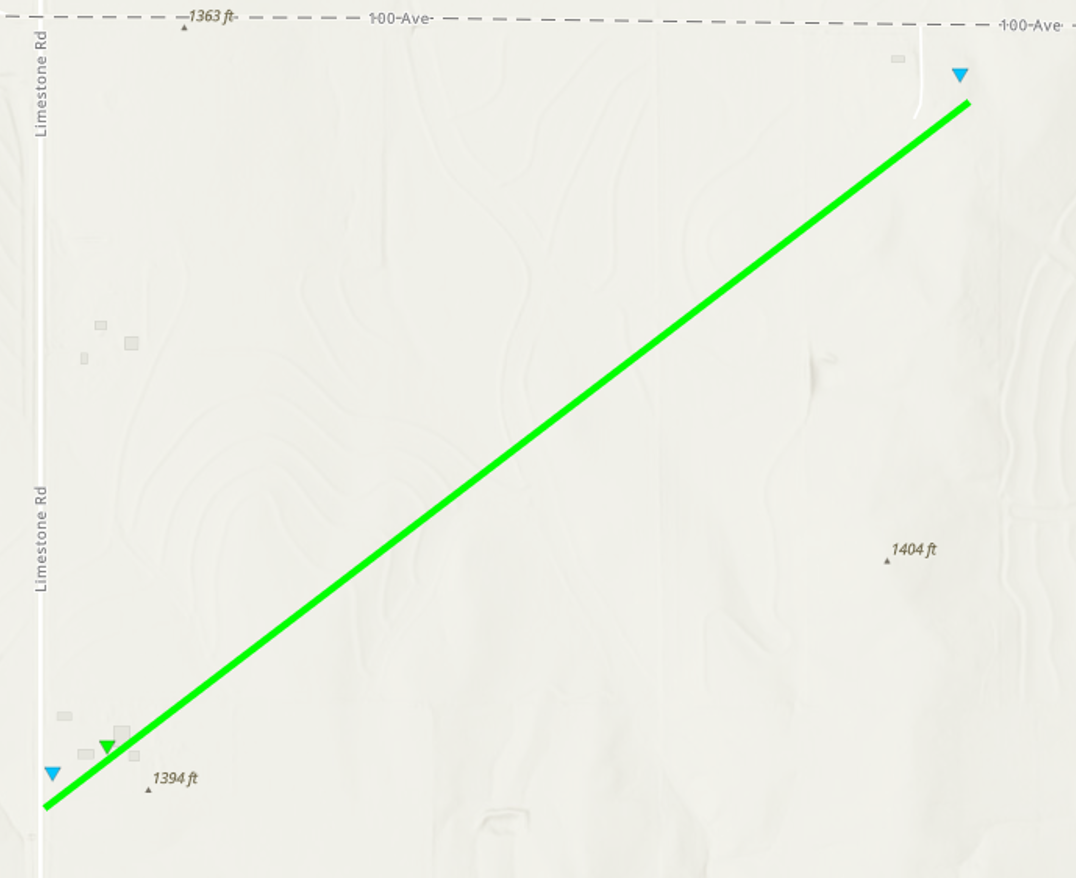
Downloadable KMZ File
|
||||||||||||||||||
|
Tornado - 3 SSE of Durham
Track Map 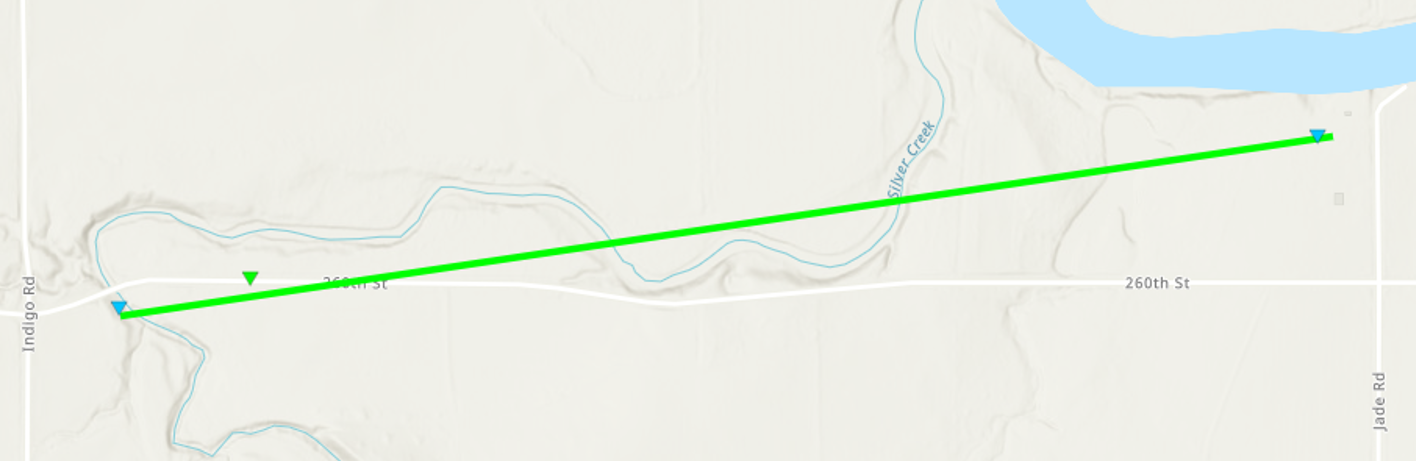
Downloadable KMZ File
|
||||||||||||||||||
|
Tornado - 2 SW of Lehigh
Track Map 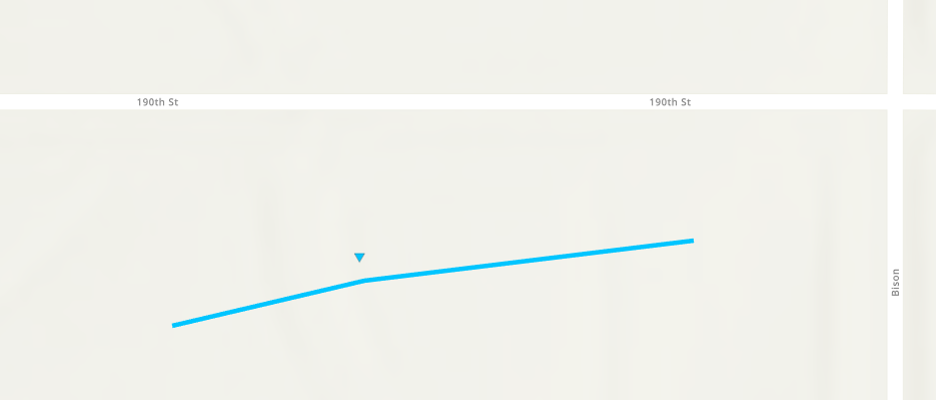
Downloadable KMZ File |
||||||||||||||||
|
Tornado - 1 NW of Hillsboro
Track Map 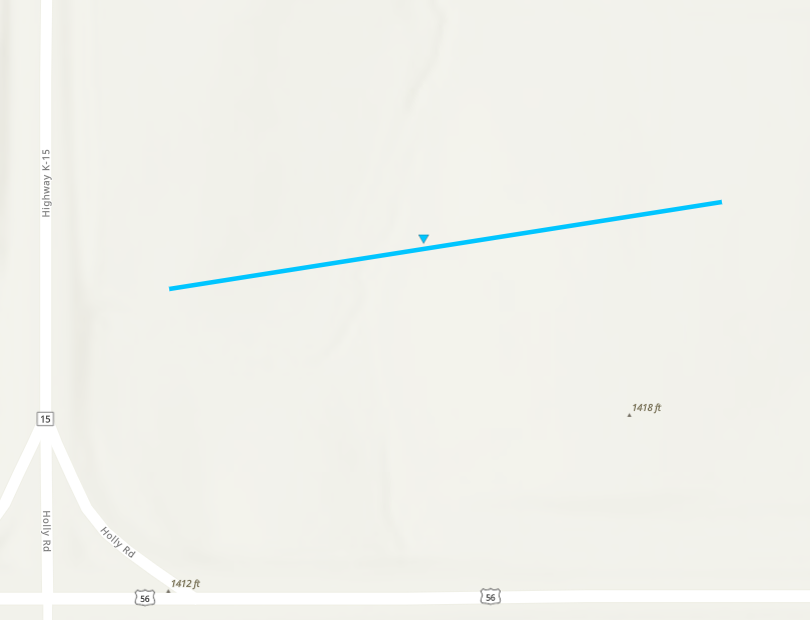
Downloadable KMZ File |
||||||||||||||||
|
Greenwood County Tornado
Track Map 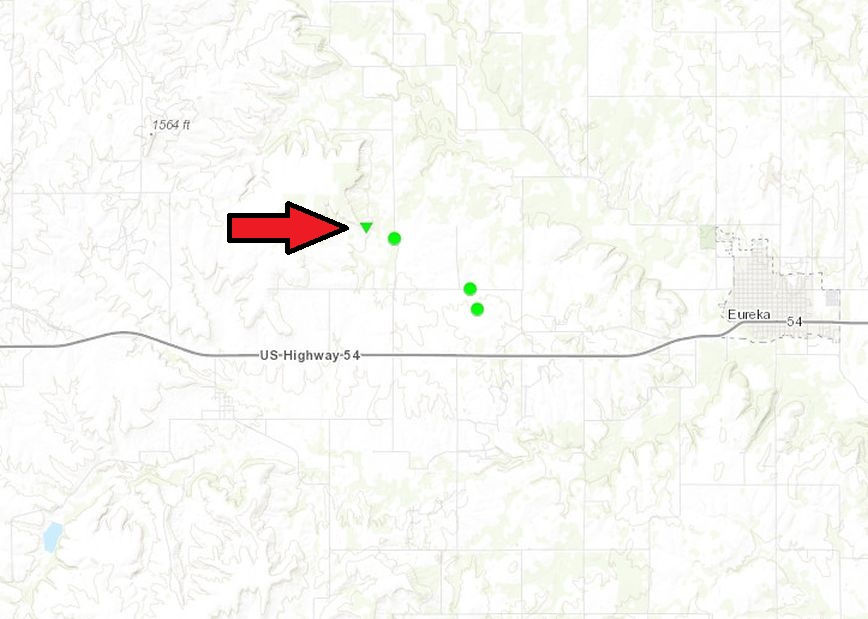
Downloadable KMZ File
|
||||||||||||||||
The Enhanced Fujita (EF) Scale classifies tornadoes into the following categories:
| EF0 Weak 65-85 mph |
EF1 Moderate 86-110 mph |
EF2 Significant 111-135 mph |
EF3 Severe 136-165 mph |
EF4 Extreme 166-200 mph |
EF5 Catastrophic 200+ mph |
 |
|||||
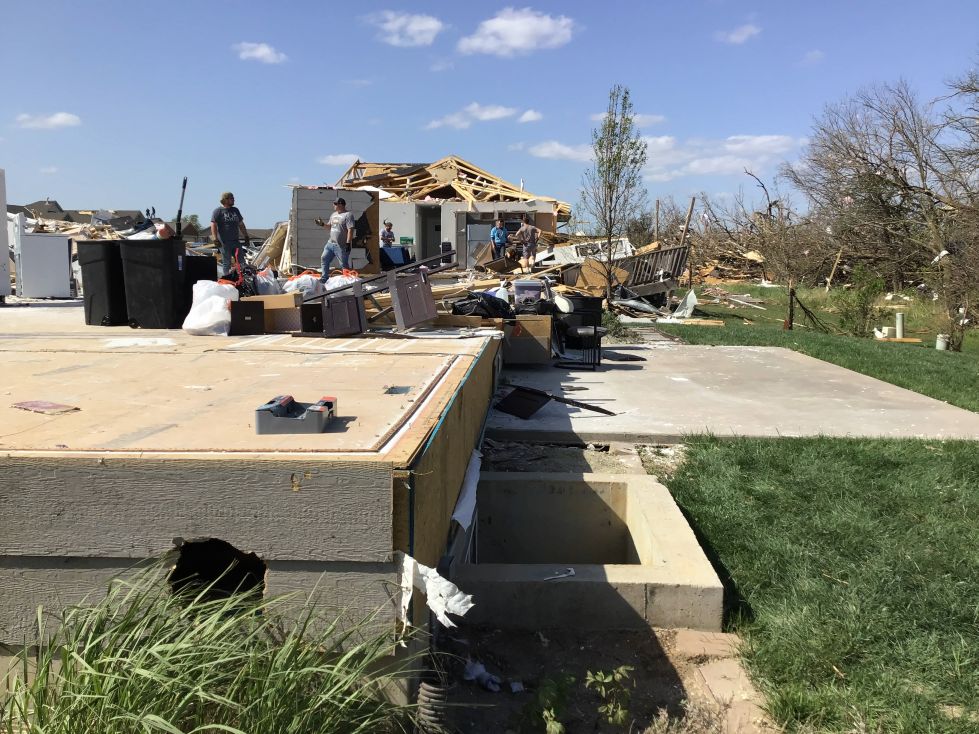
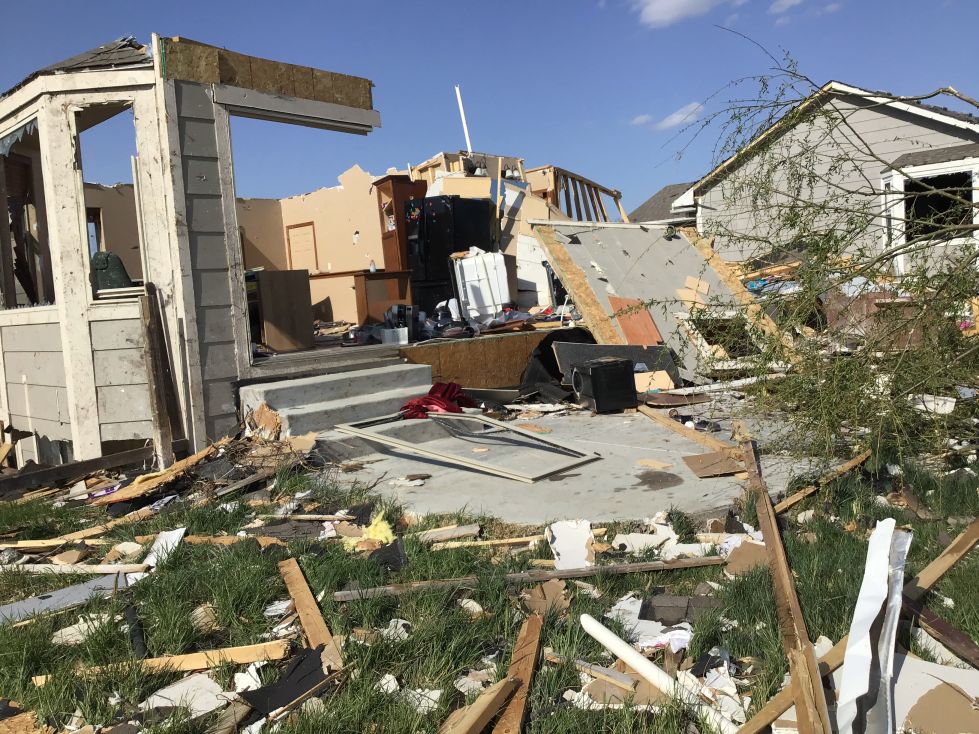
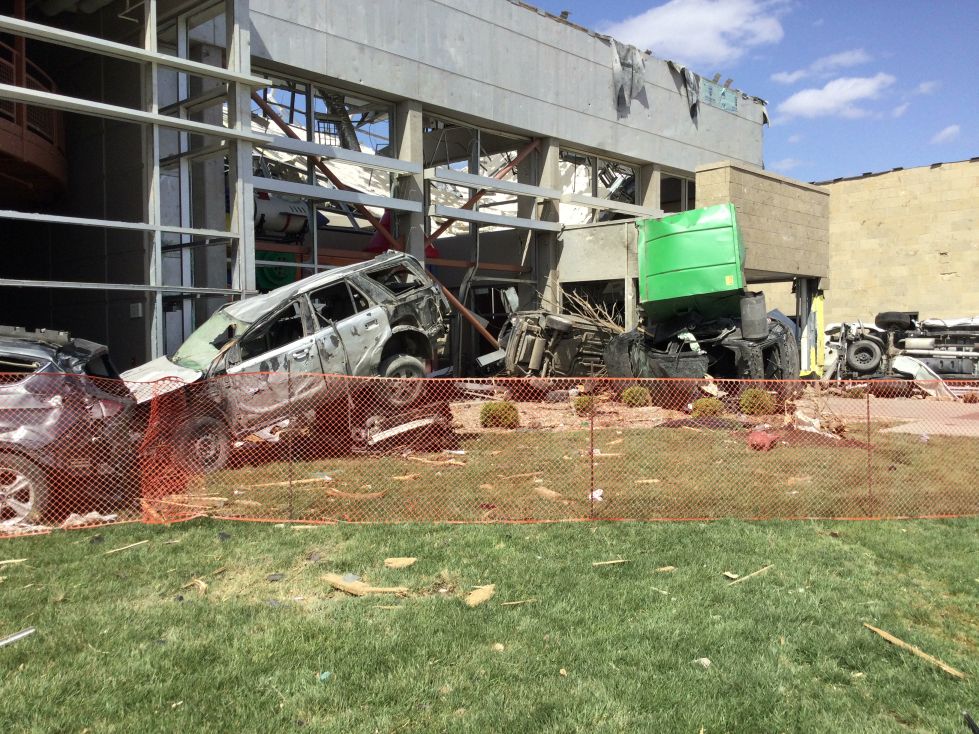
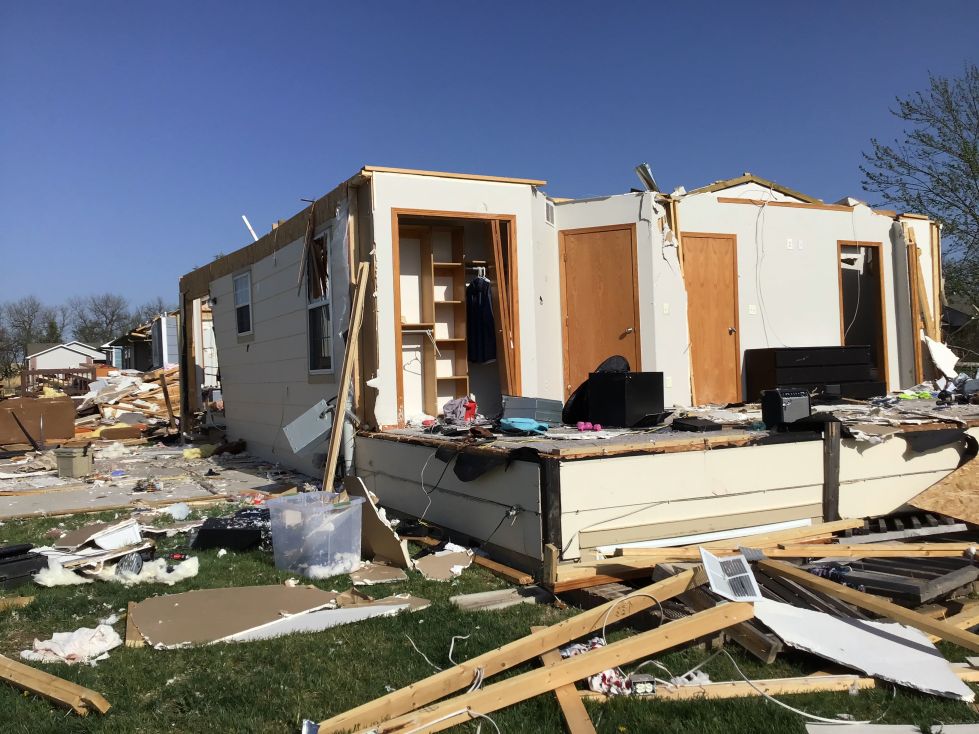
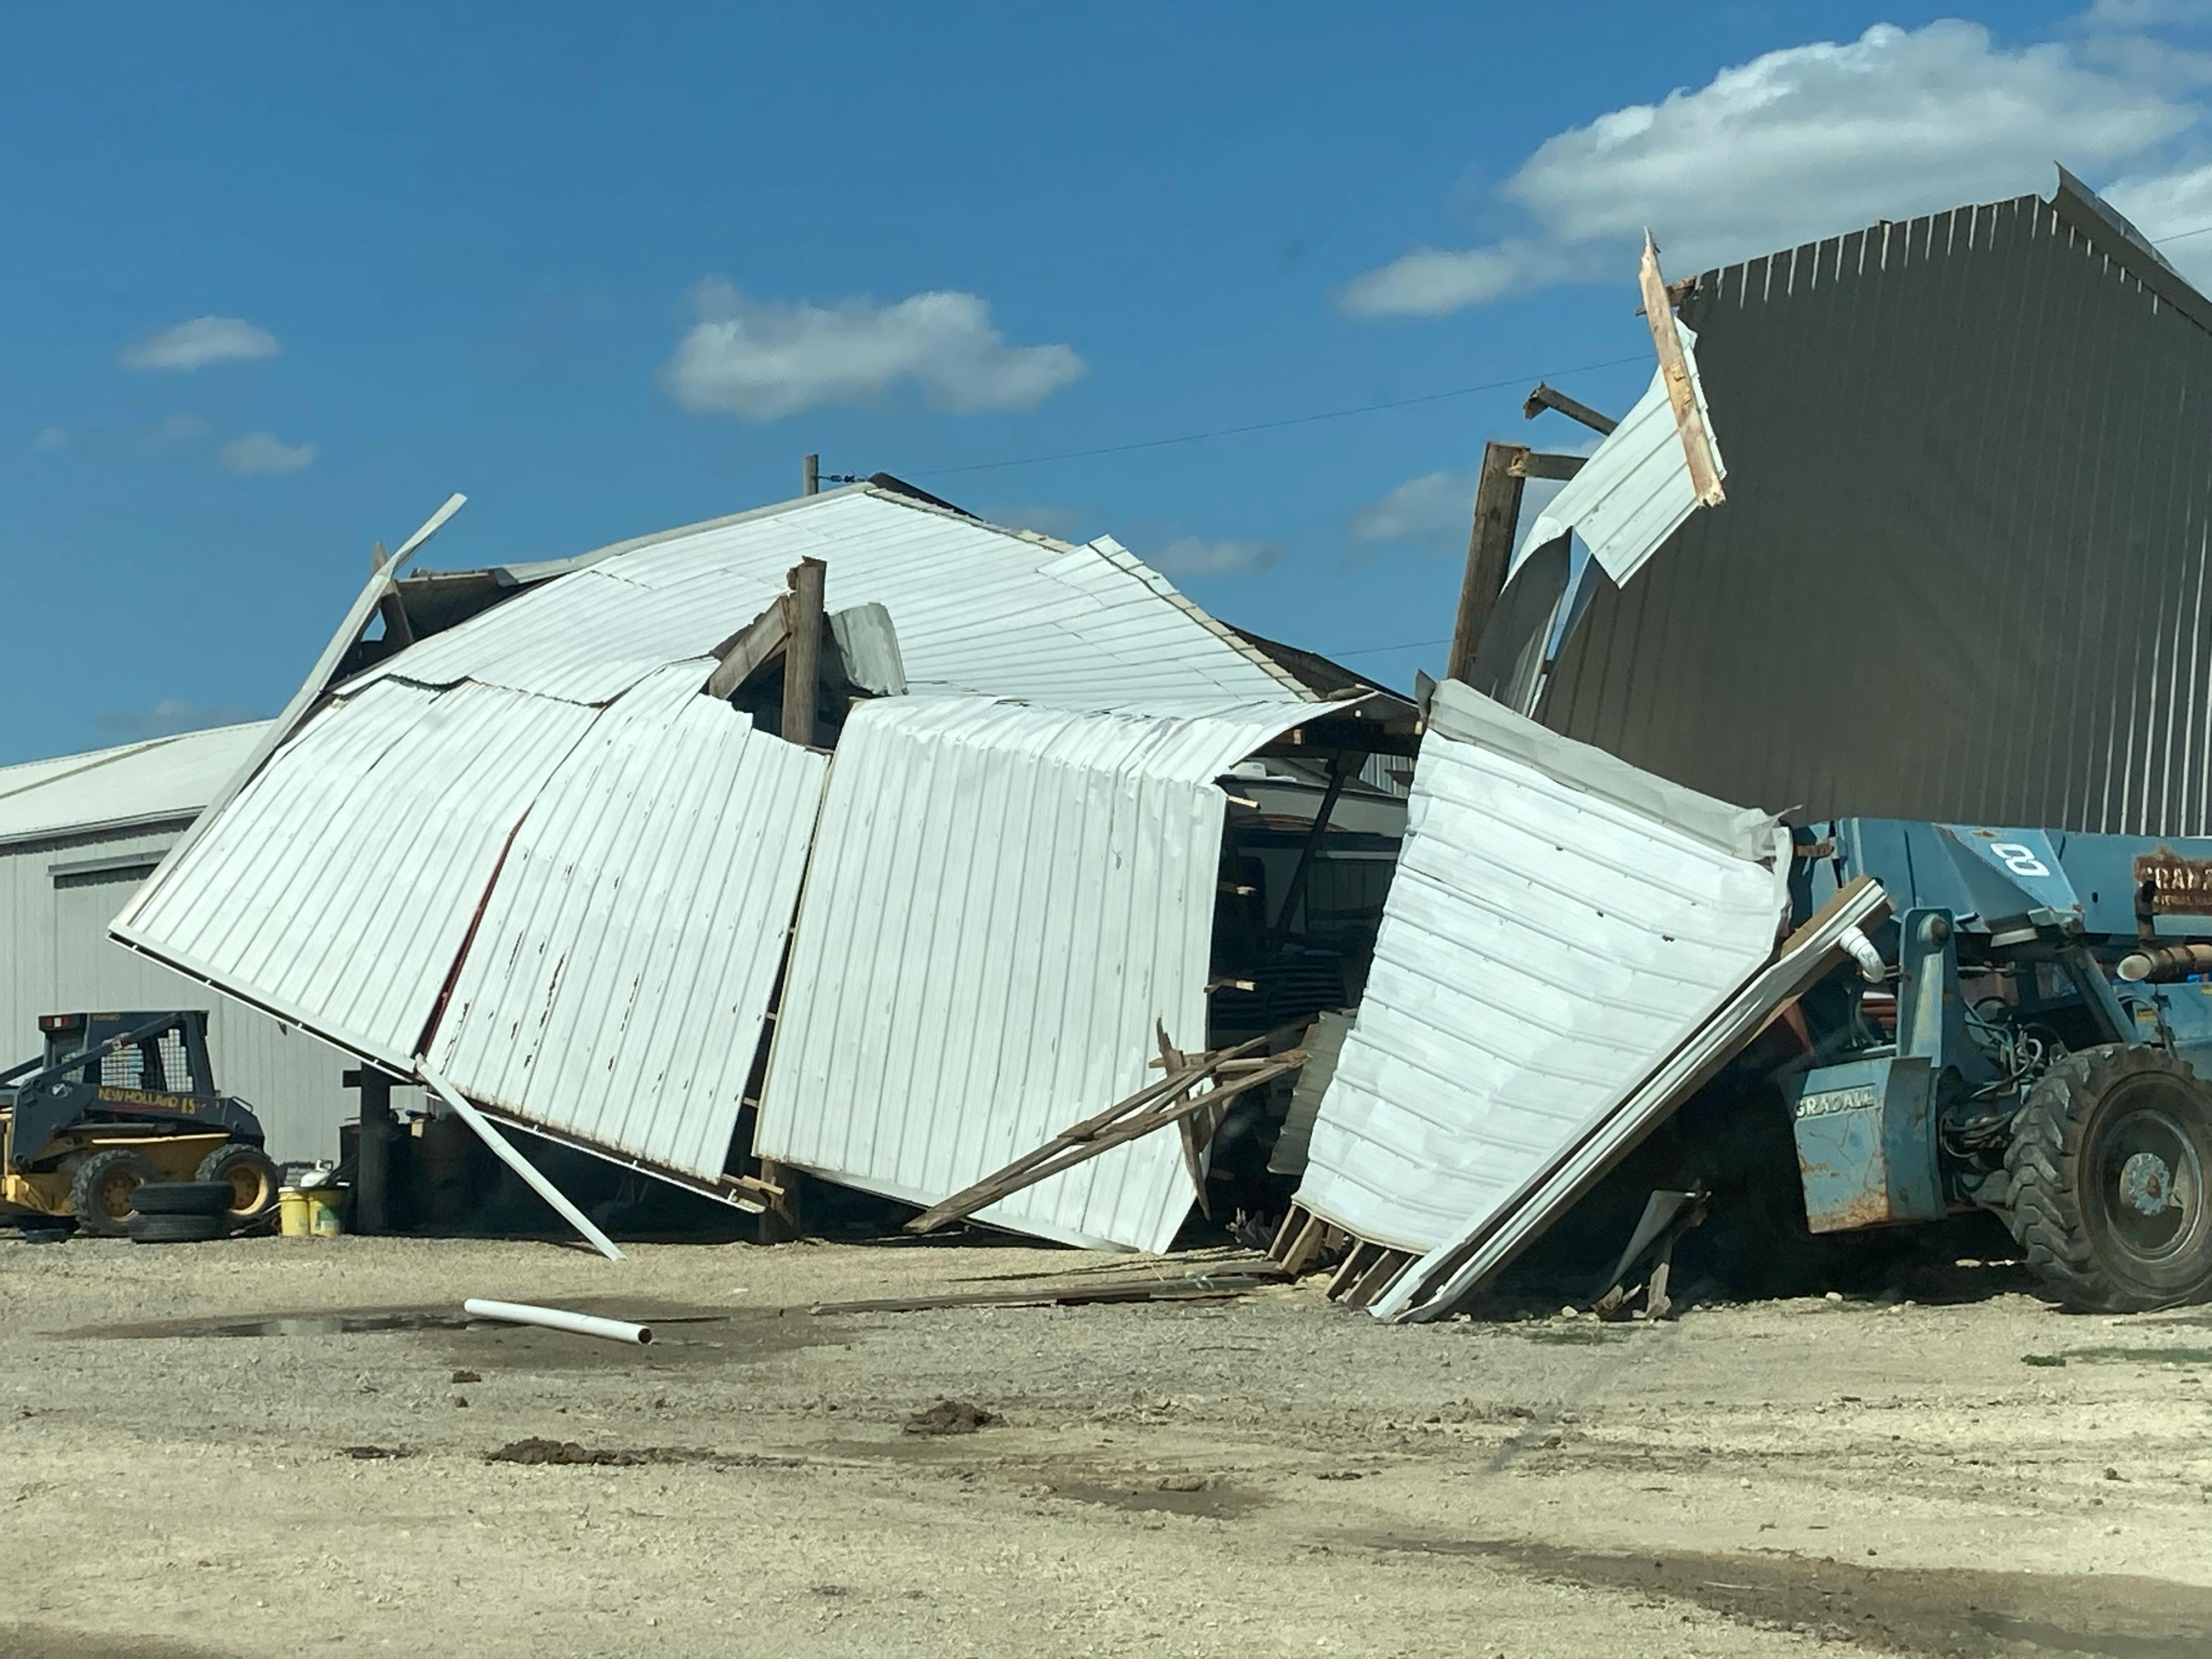
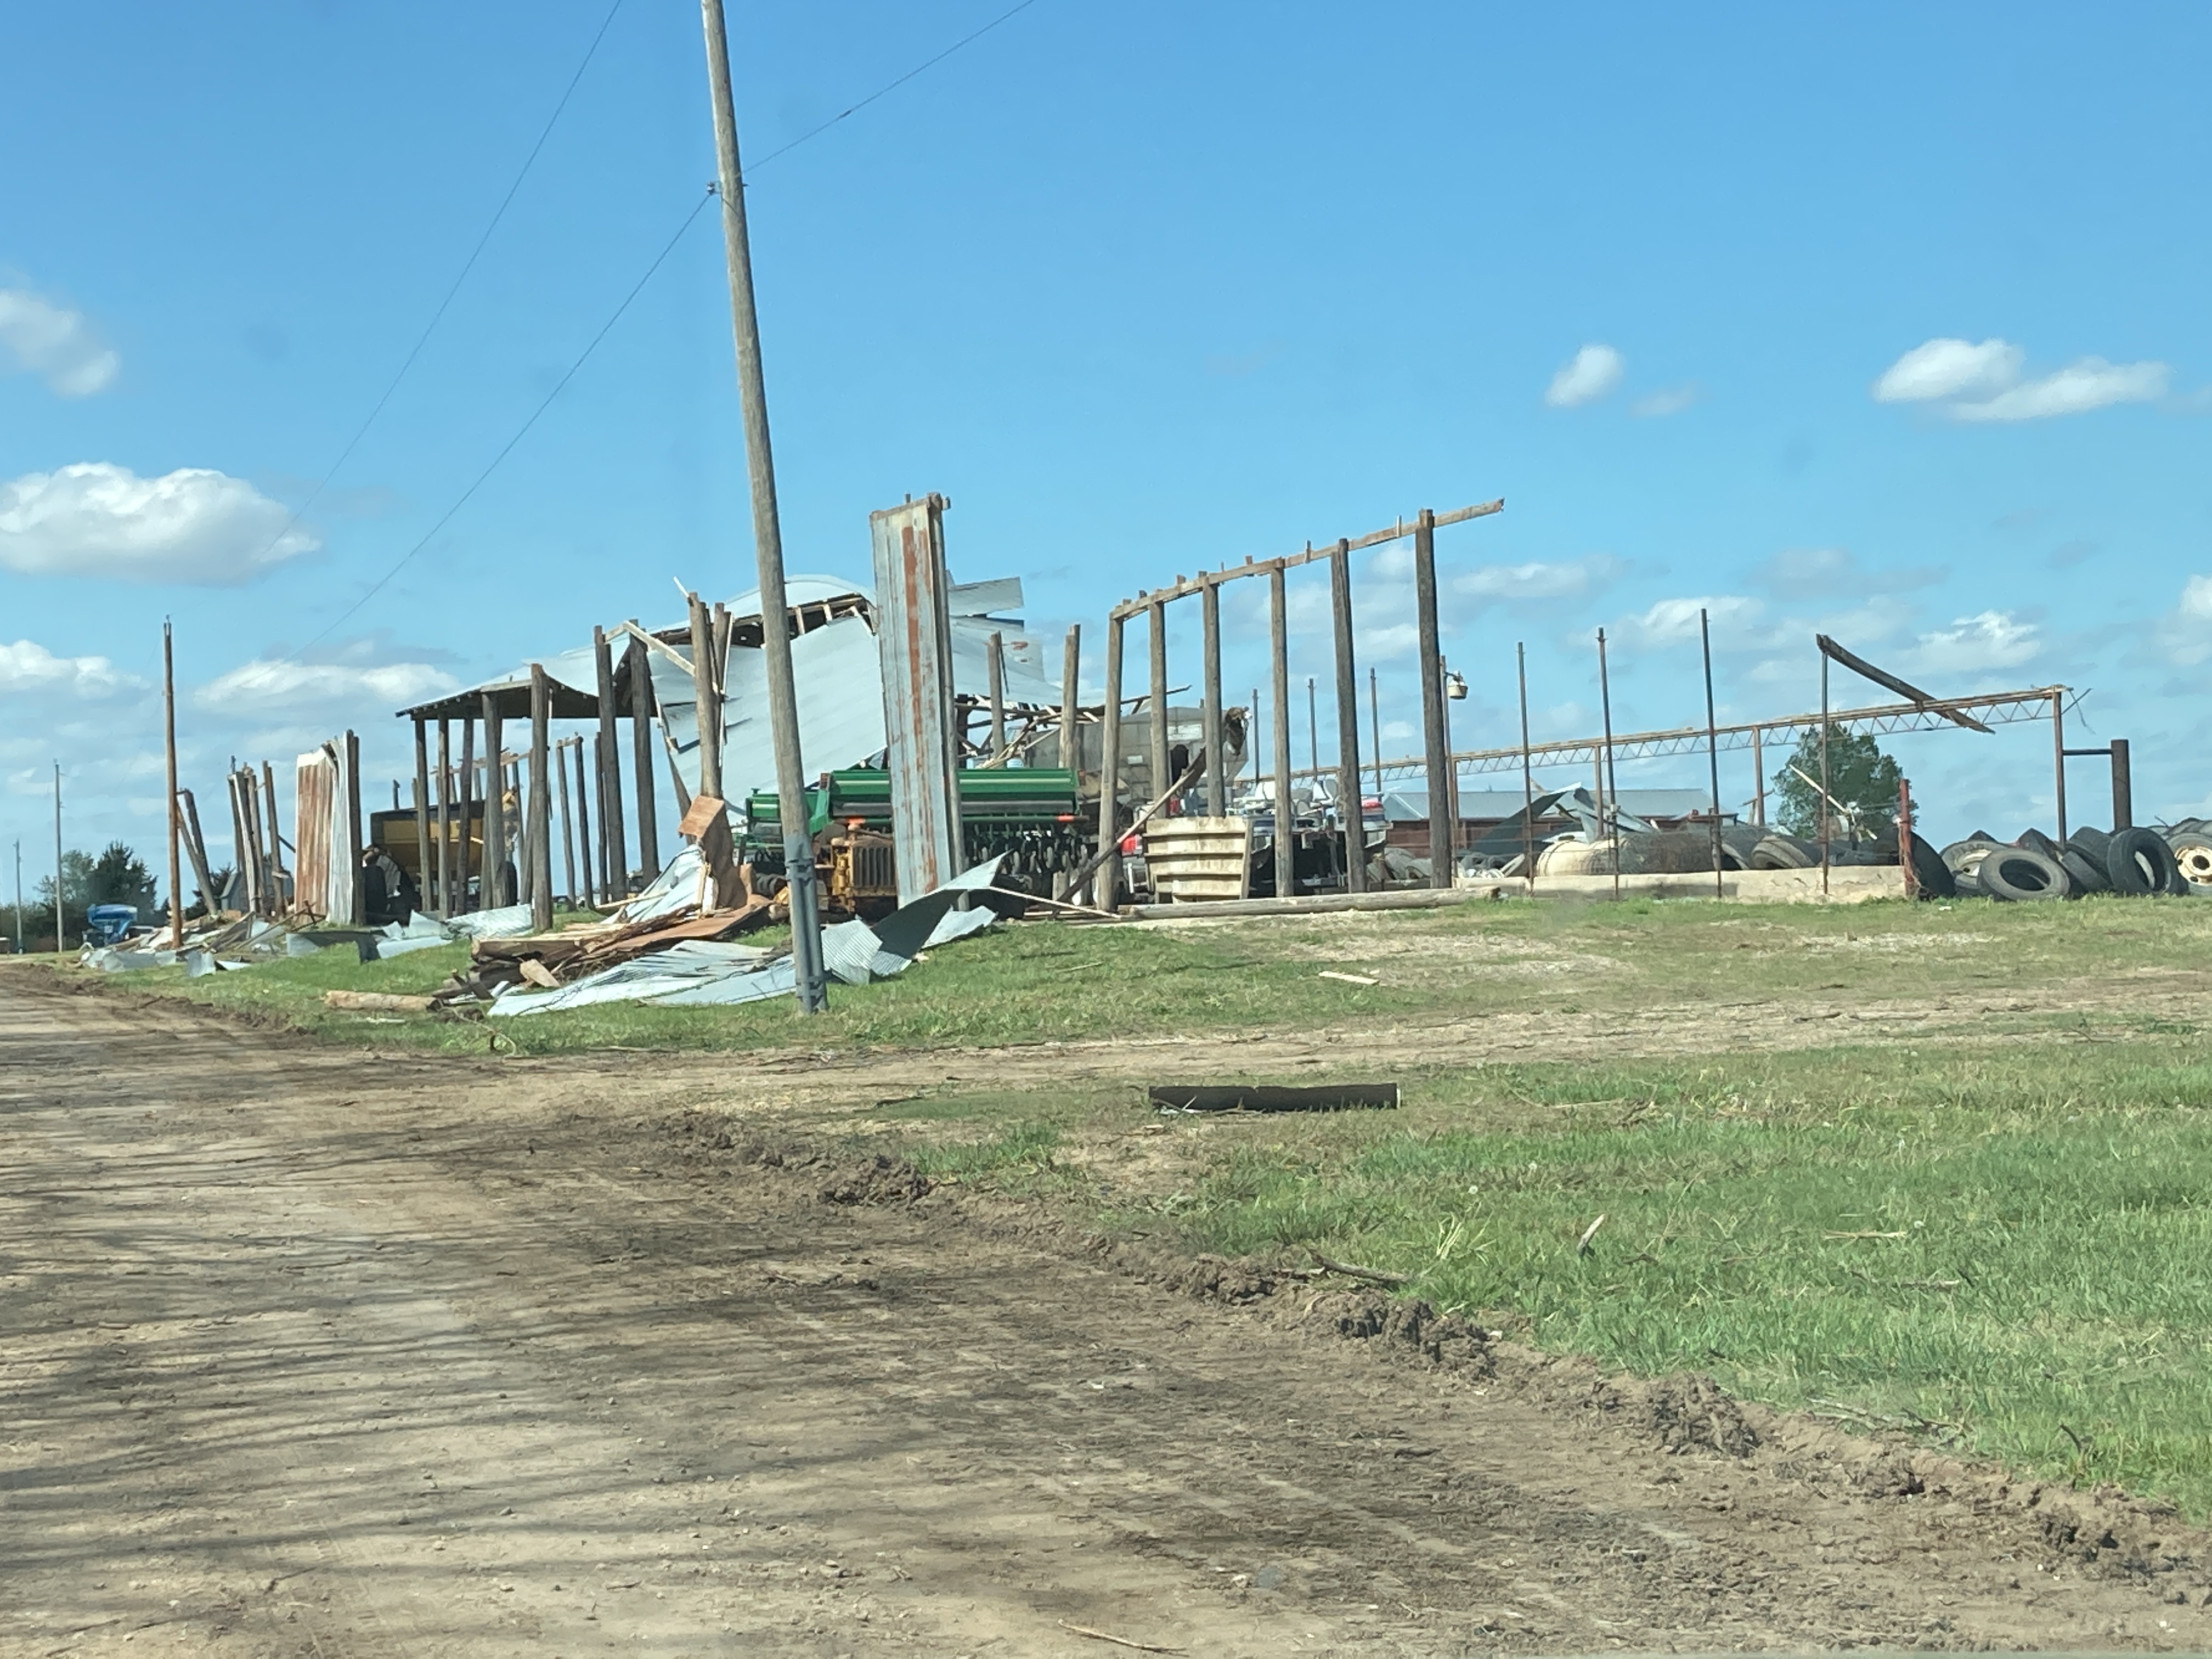
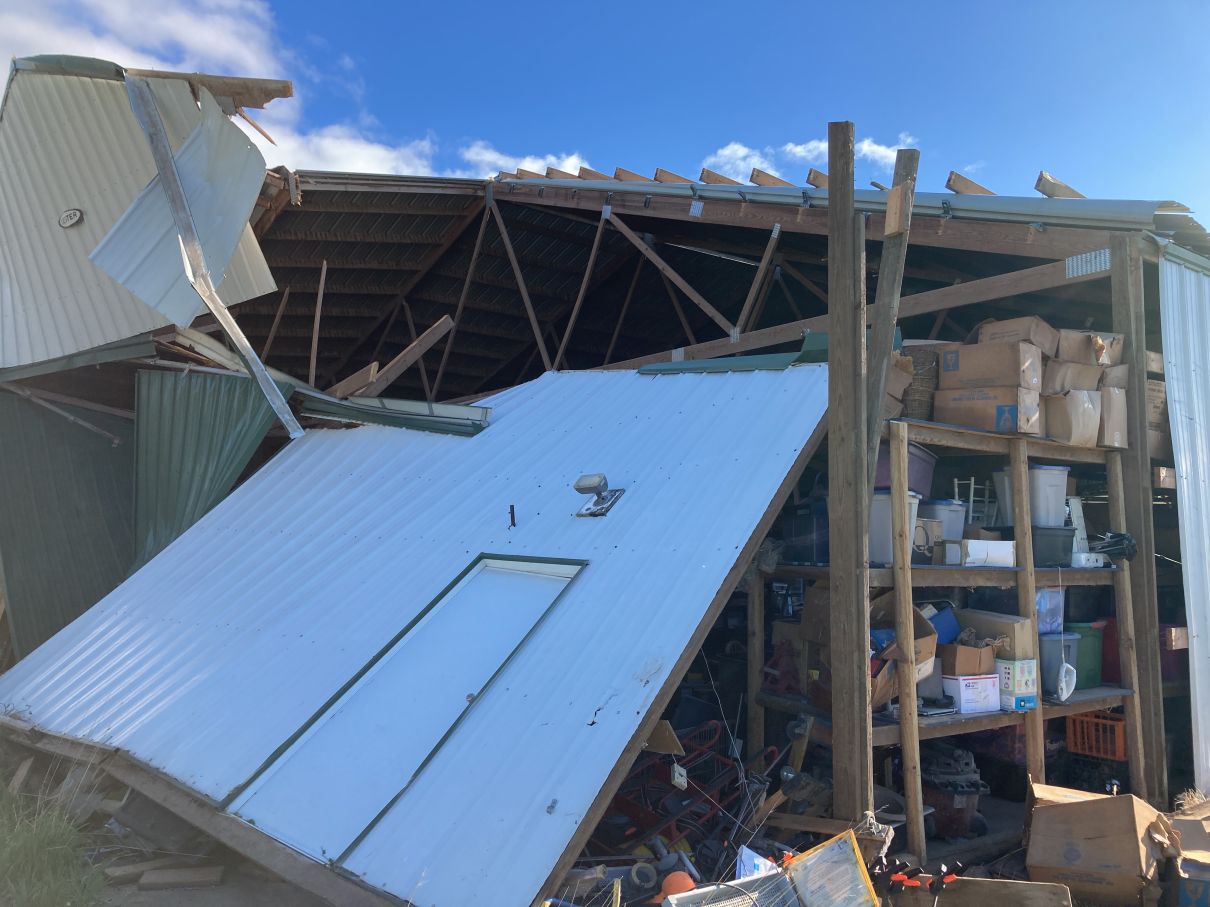
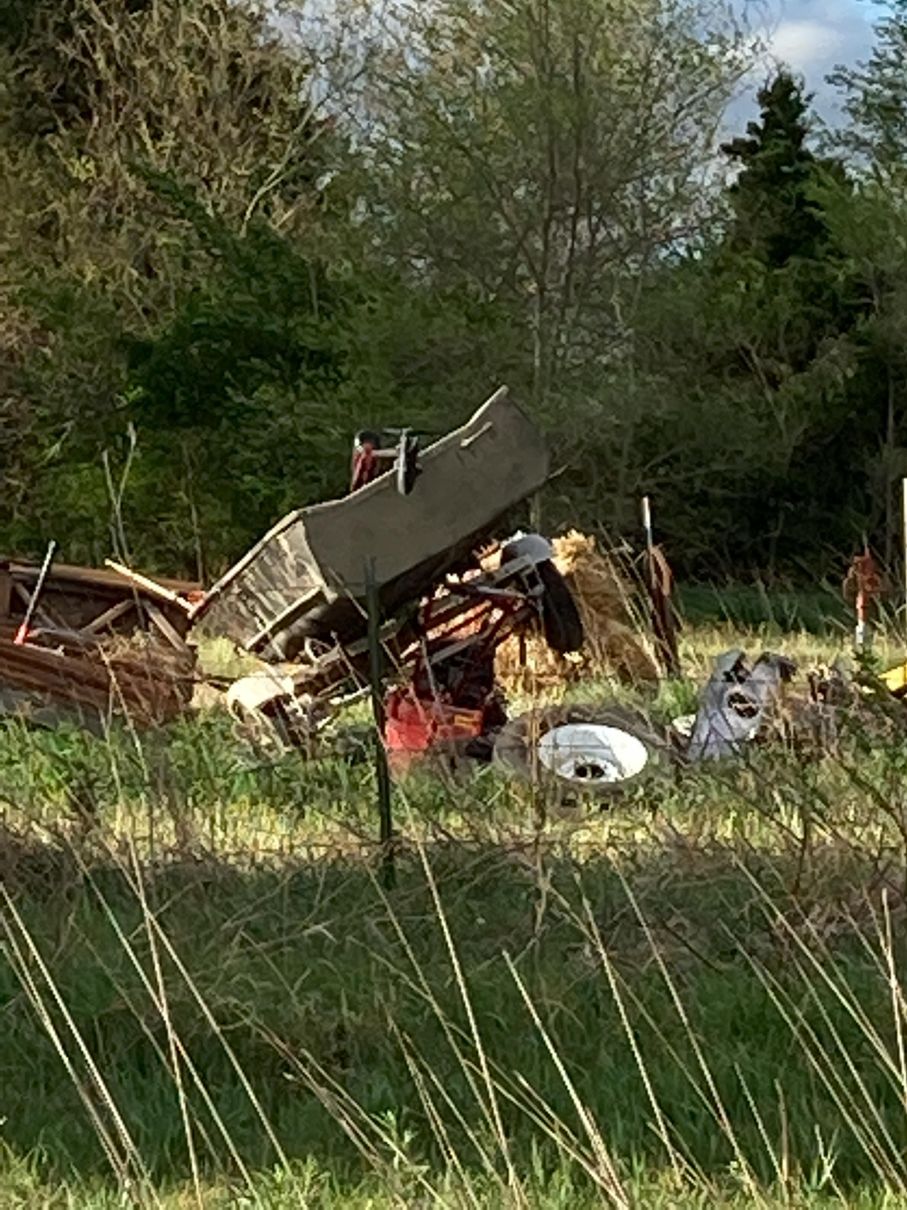
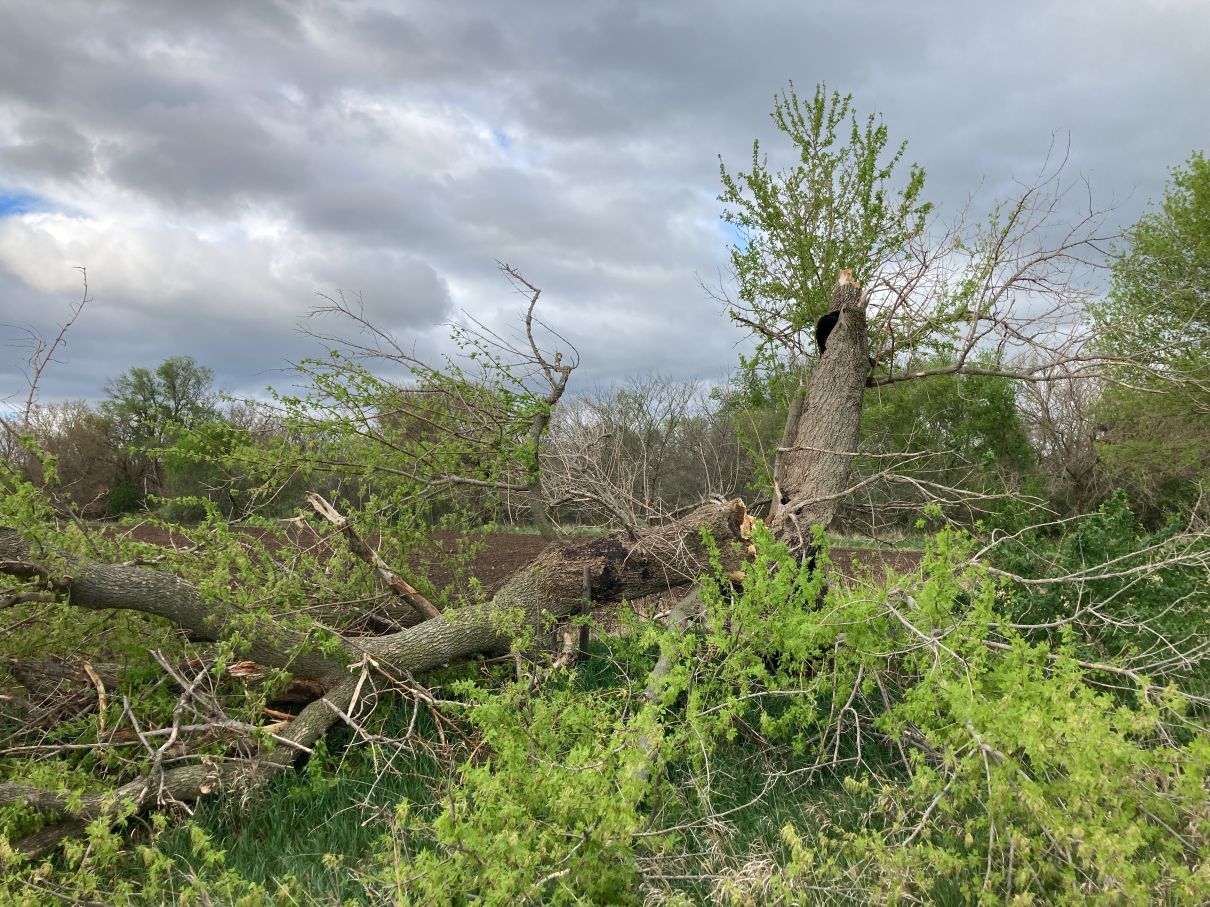
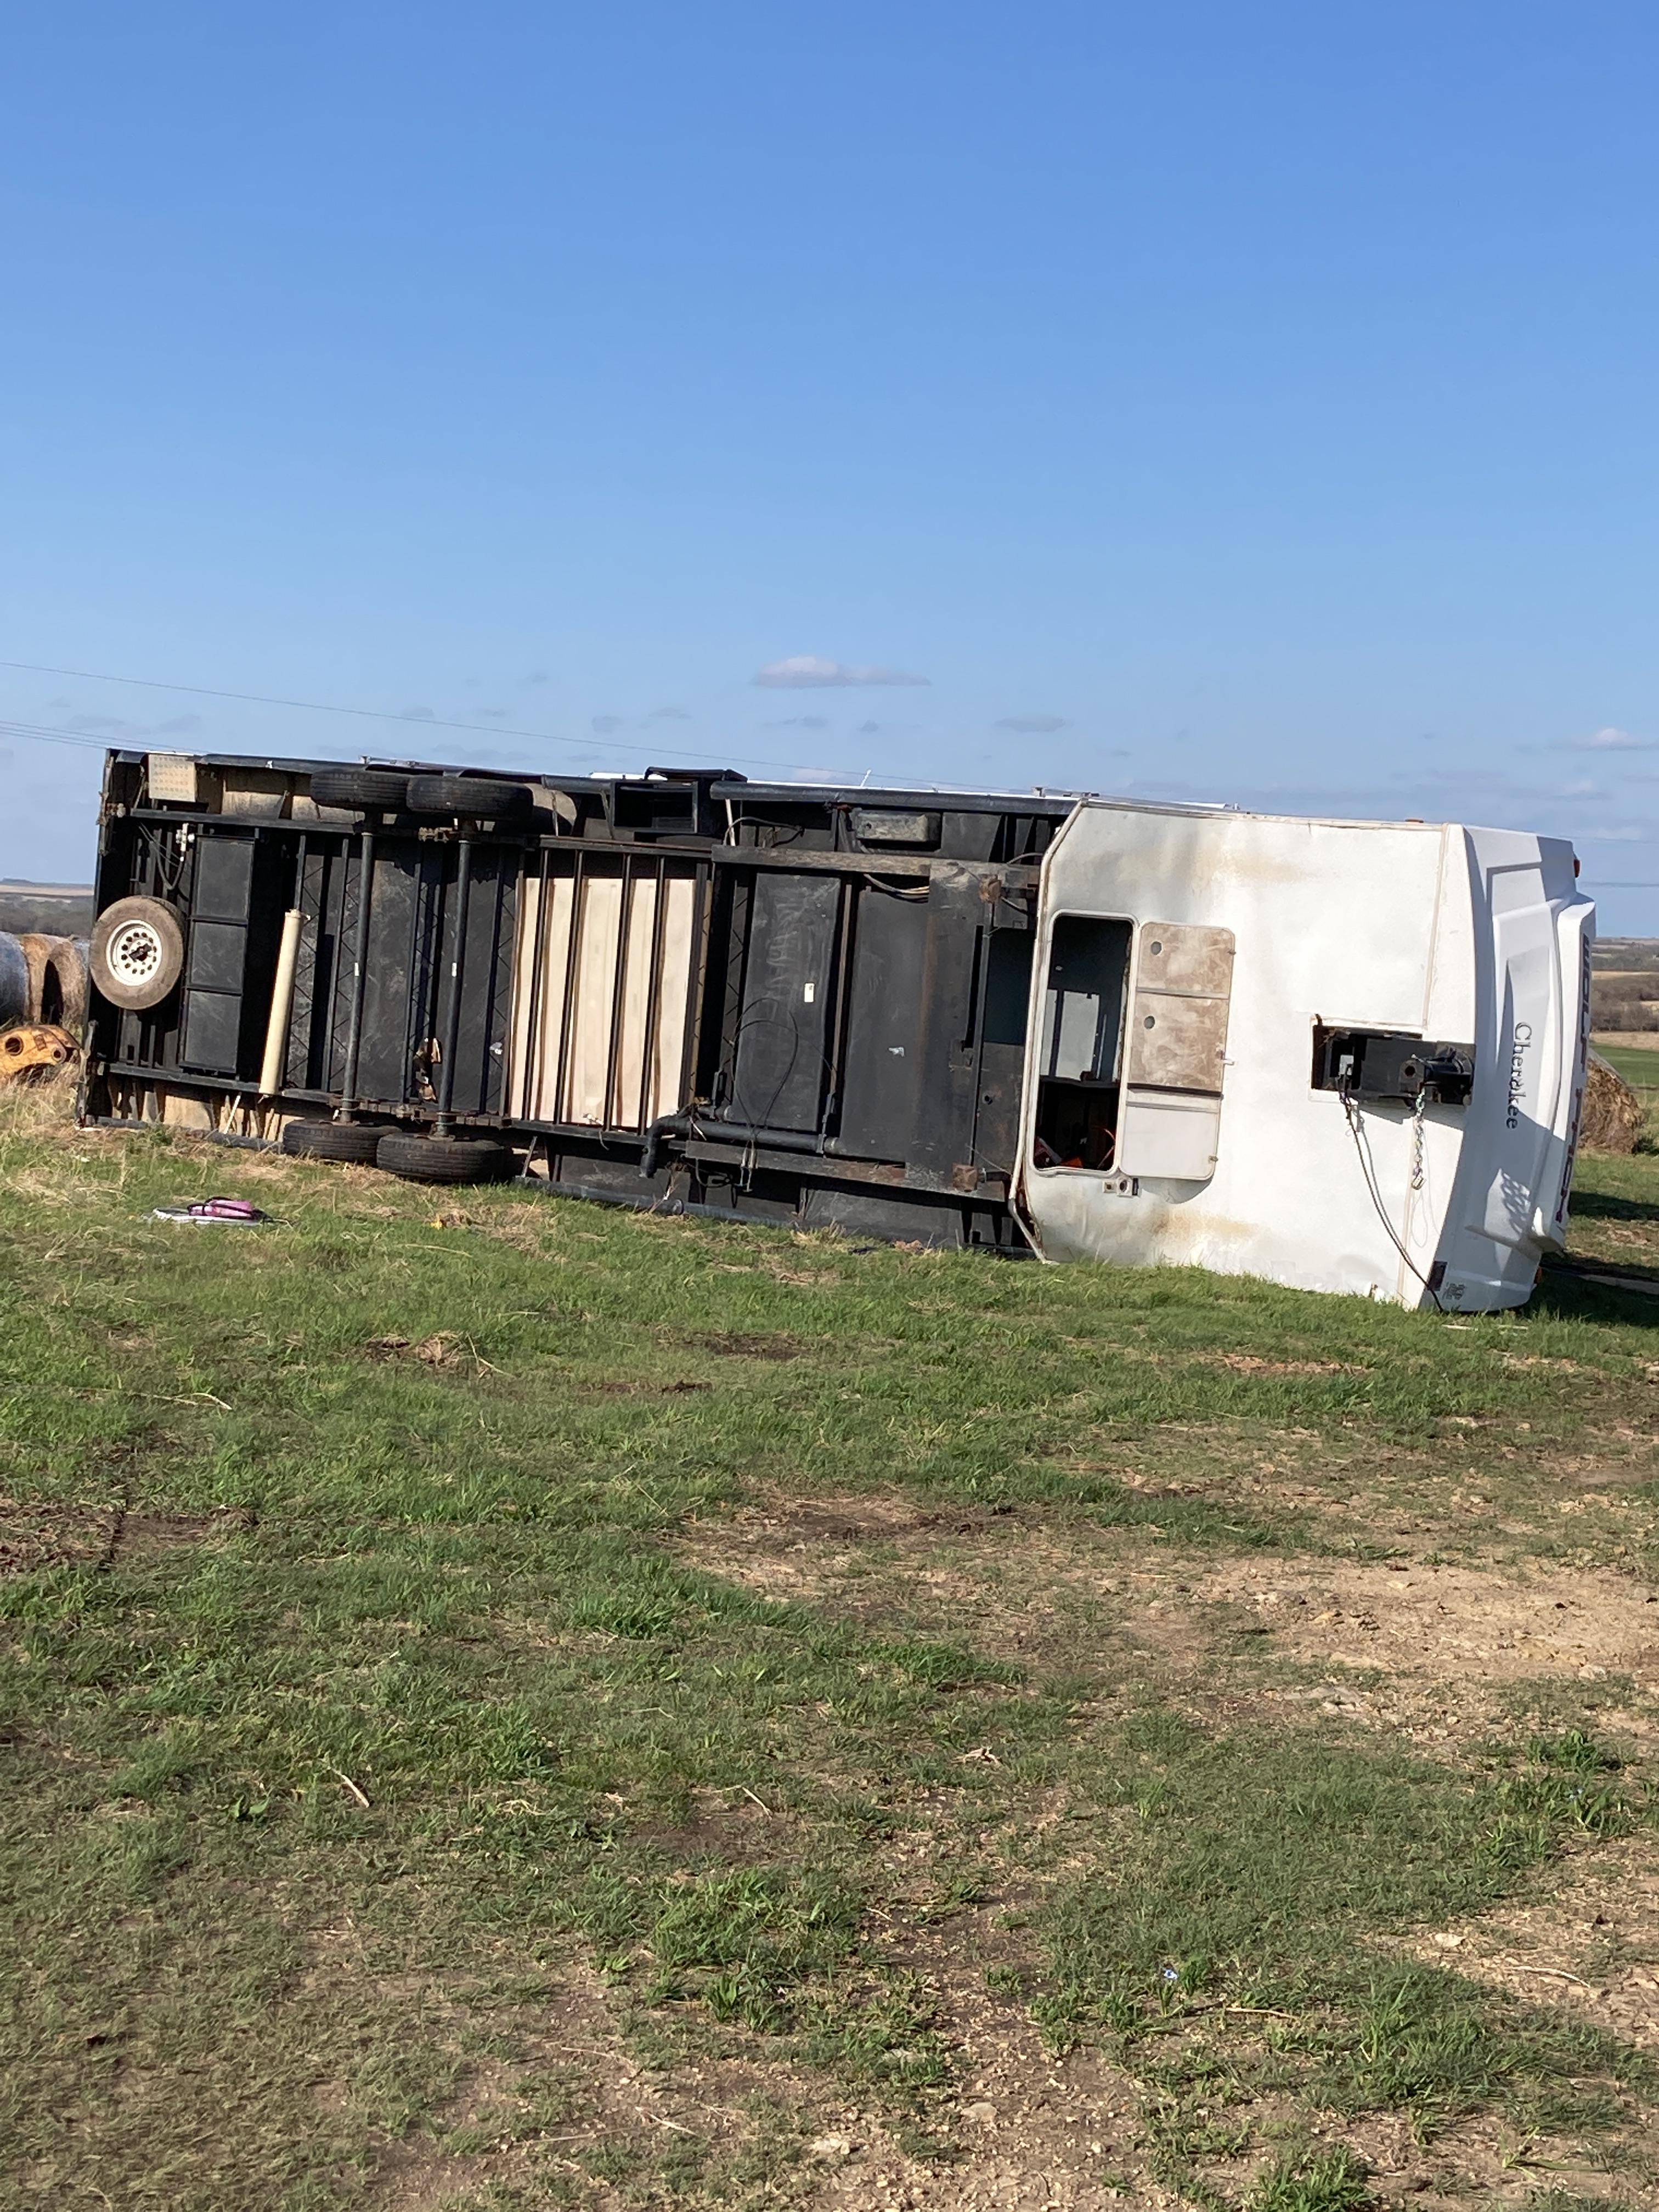
Photos & Video
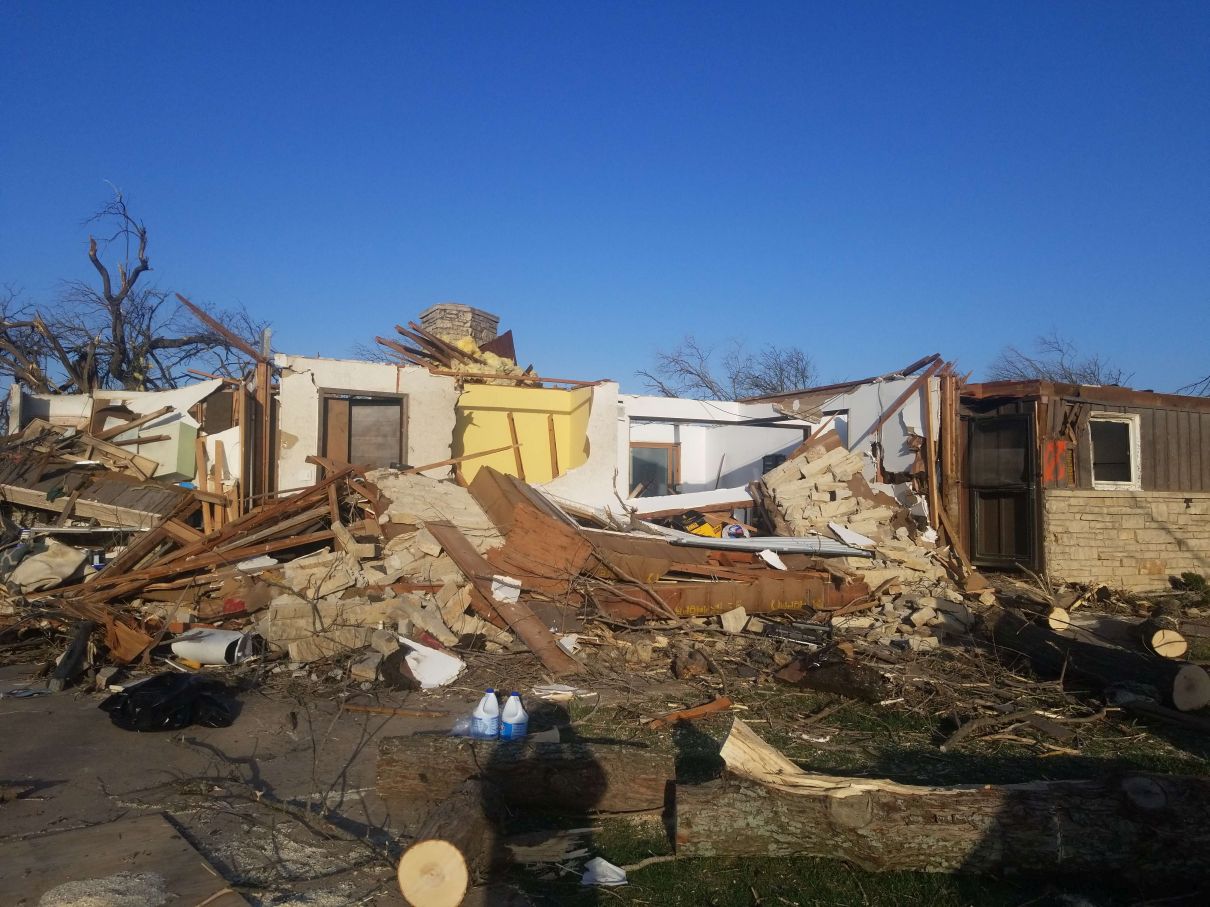
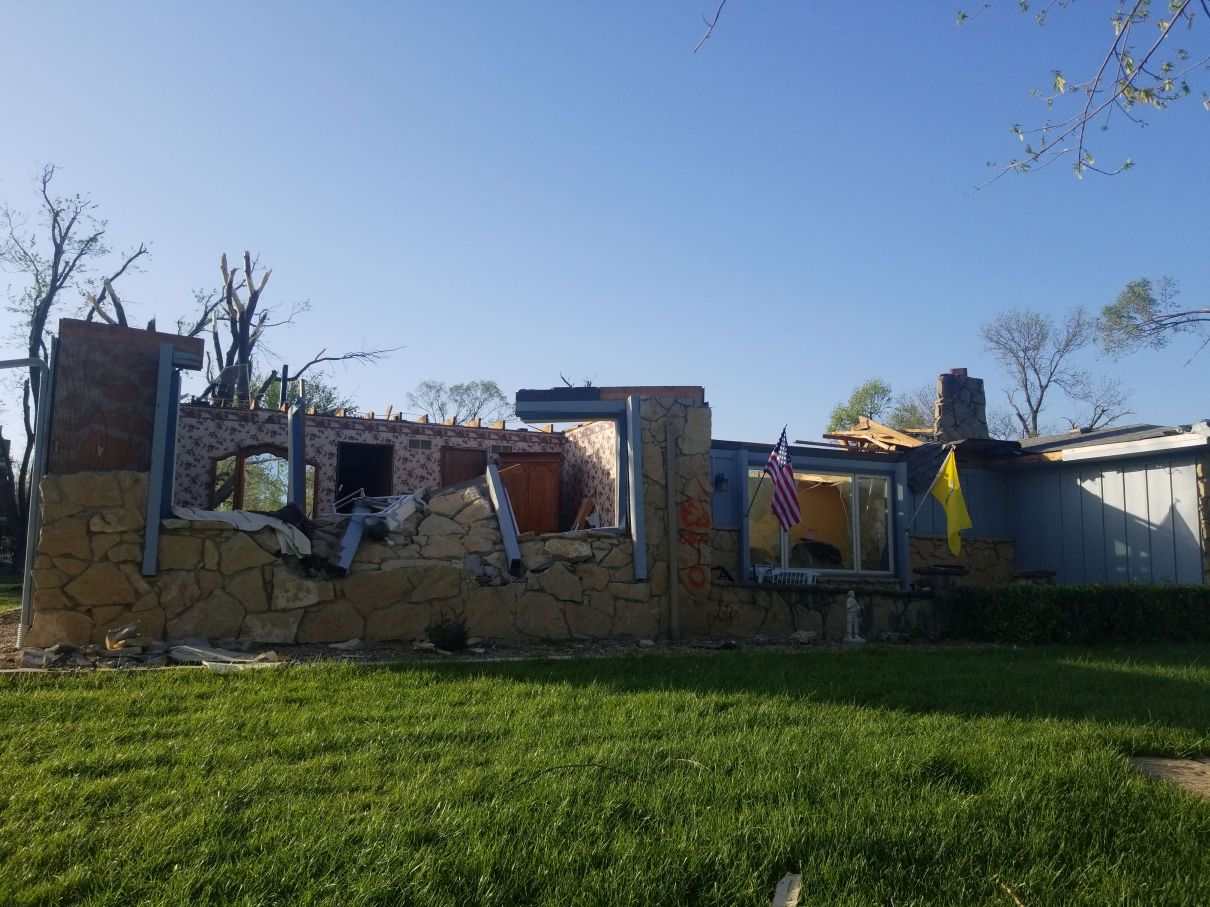
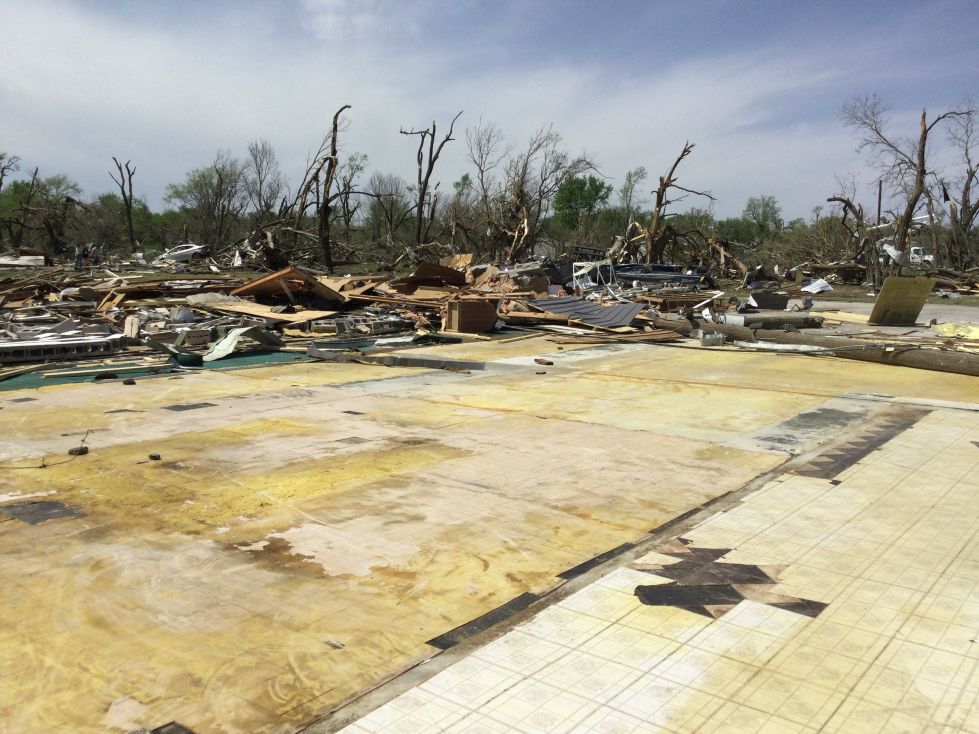
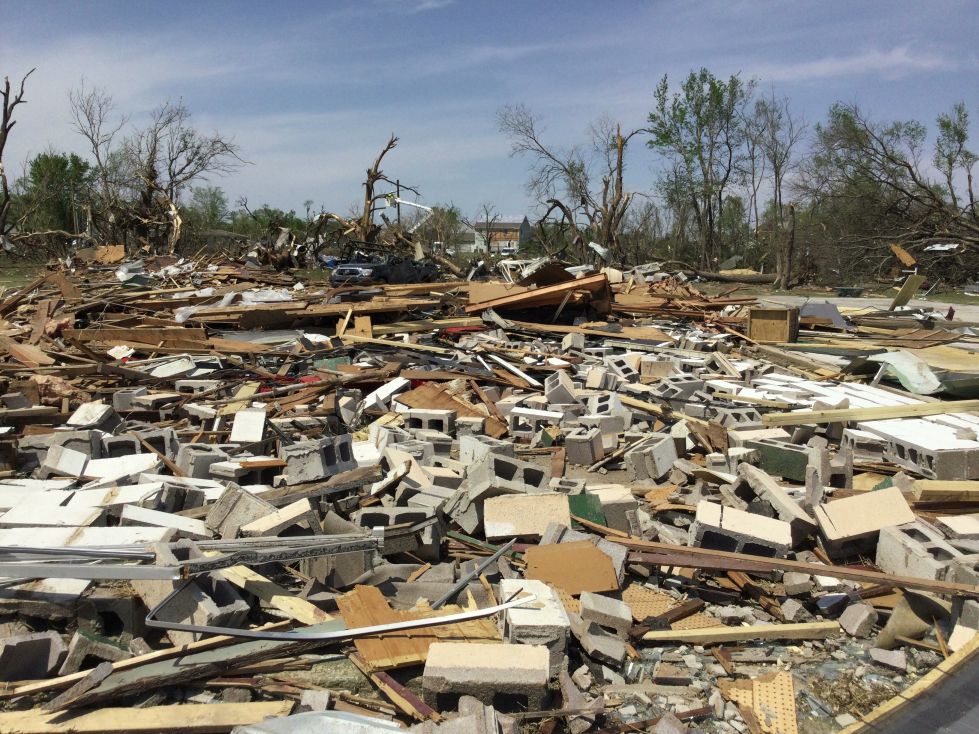
Andover tornado
|
Picture by Mike Umscheid (@mikeumsc) |
|
|
|
|
|
|
|
|
|
|
|
here |
Rosalia Tornado
|
|
|
Additional Pictures
 |
 |
|
| Line of storms as it passed over McPherson. Picture by James Mickley | Brief tornado in Marion county. Picture by Bryce Kintigh |
Radar
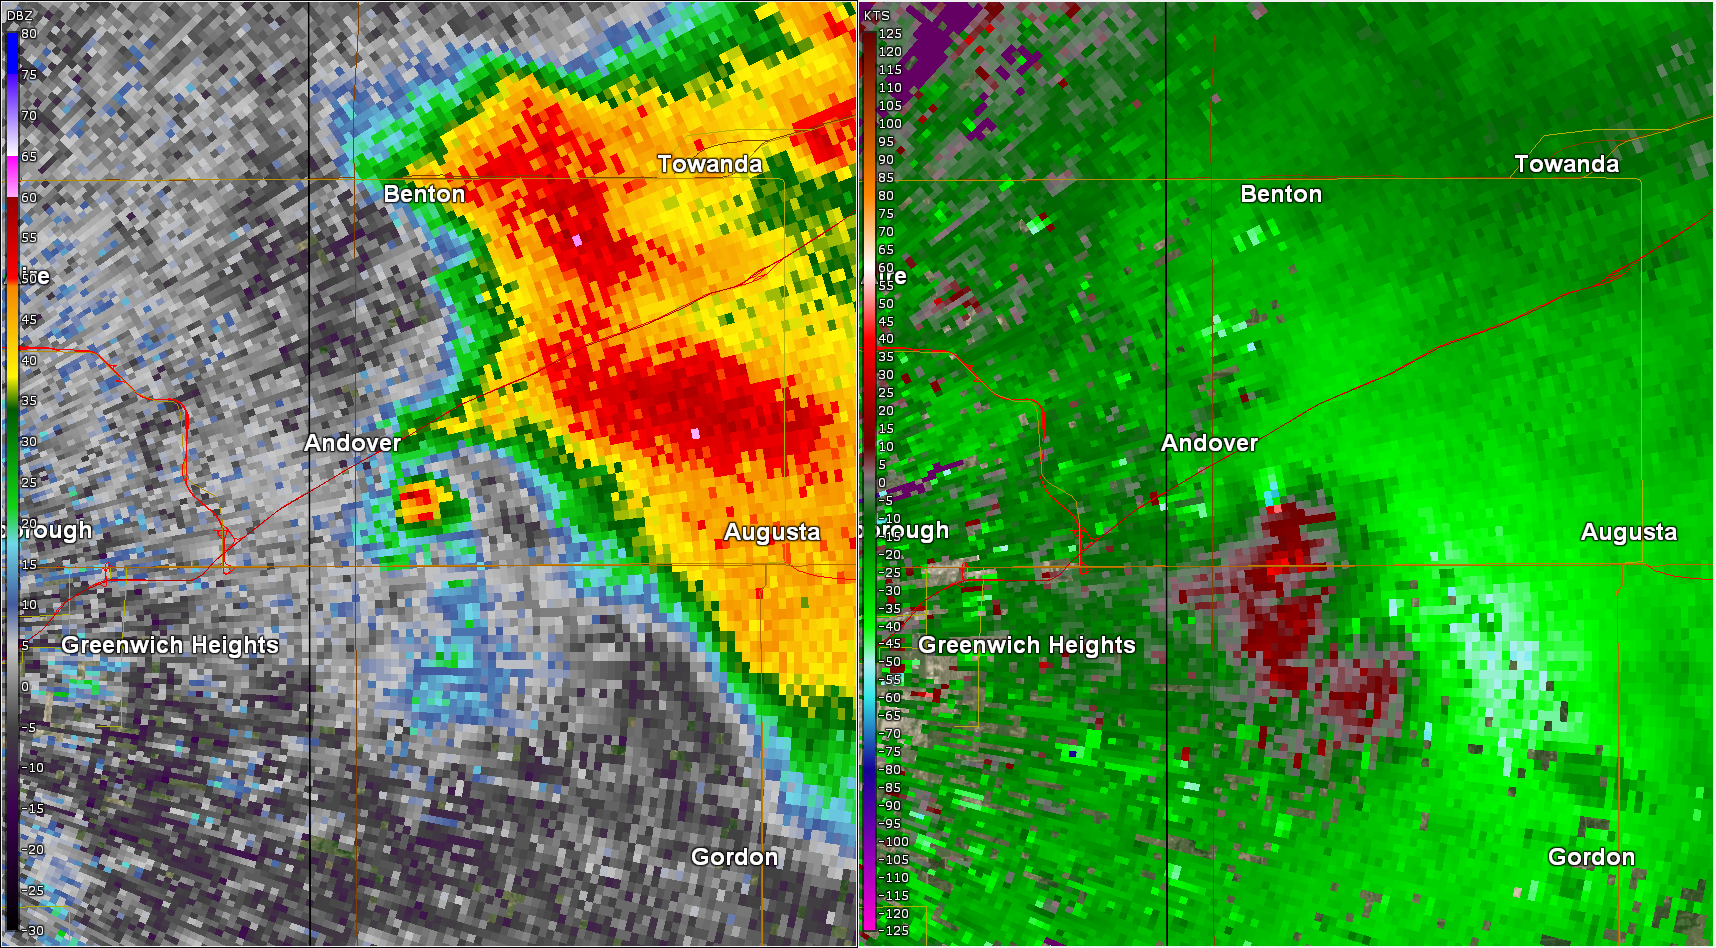
Andover & Rosalia supercell
 |
 |
| Radar animation from the Andover tornado | Radar animation of the tornado near Rosalia |
 |
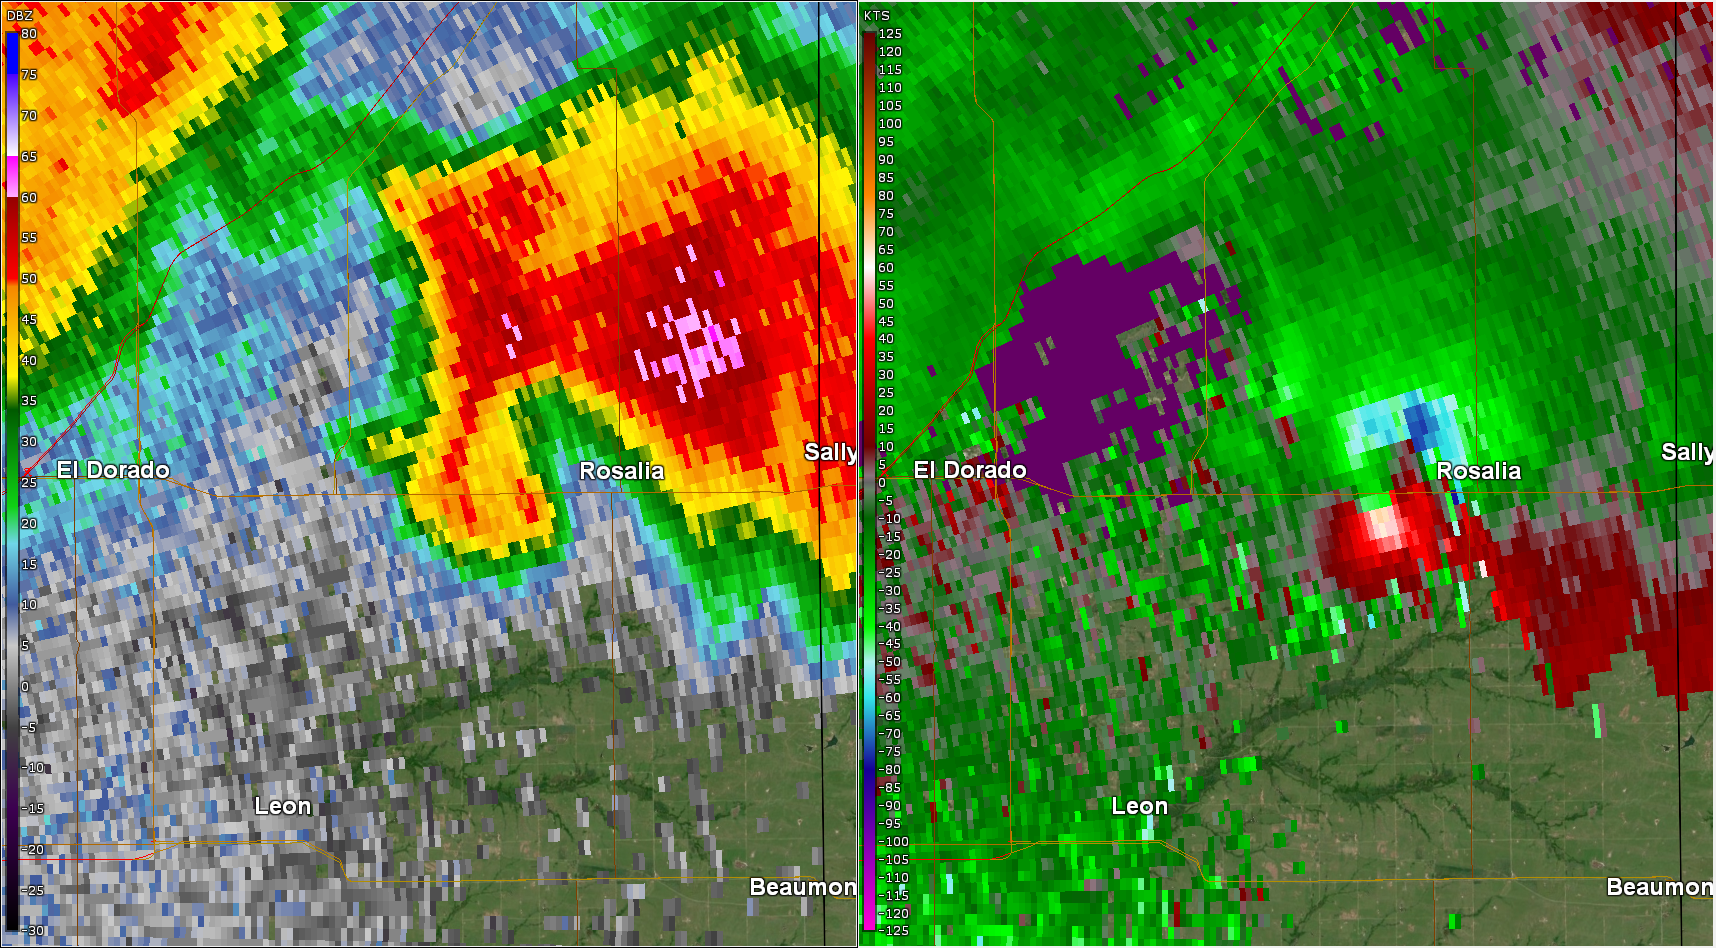 |
| Radar shot of the Andover tornado | Radar shot of the Rosalia tornado |
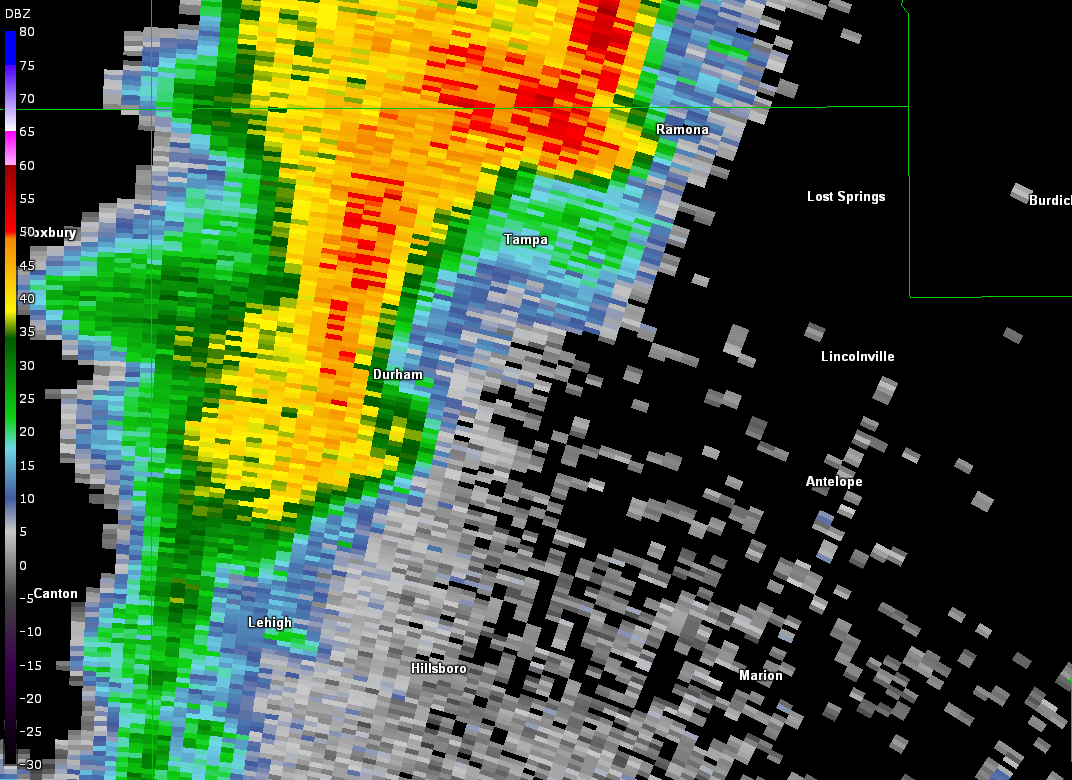
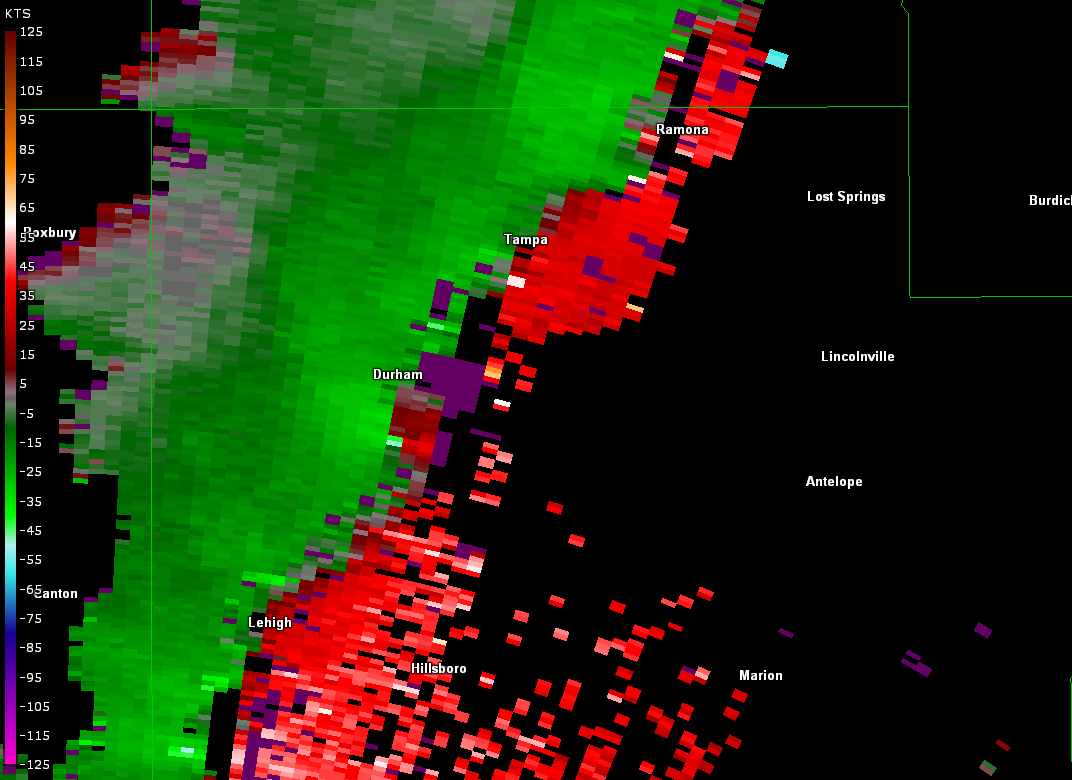
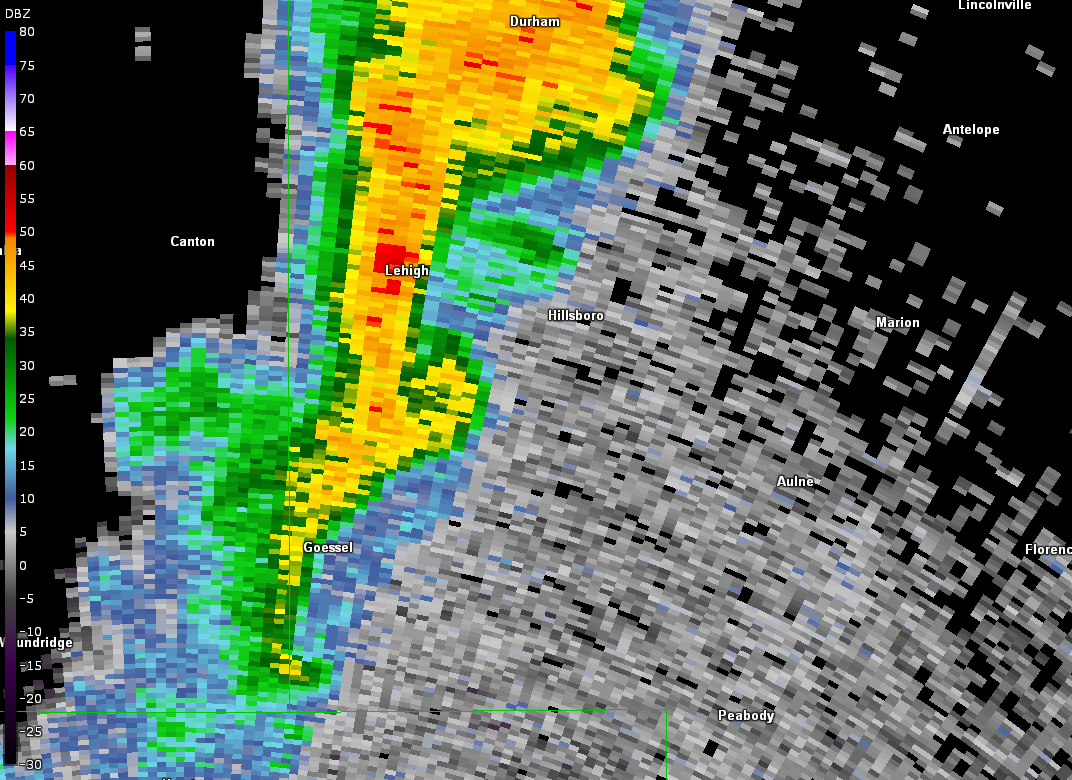
Marion county tornadoes
 |
 |
 |
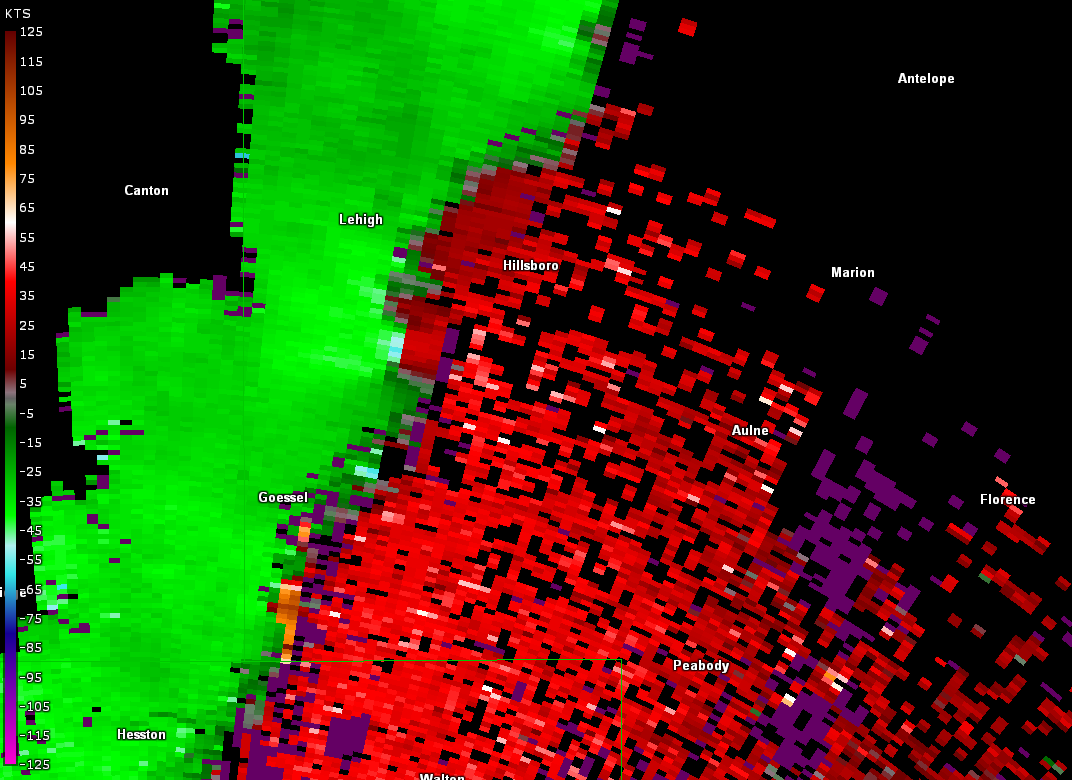 |
| Radar around the time of tornado southeast of Durham | Storm relative velocity around the time of the tornado southeast of Durham | Radar around the time of a tornado south of Lehigh | Storm relative velocity around the time of a tornado south of Lehigh |
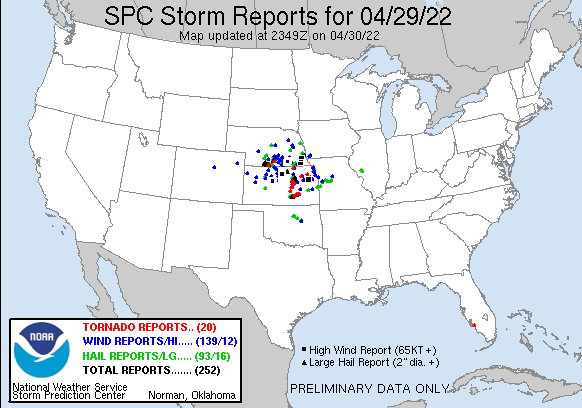
Storm Reports
Environment
 |
 |
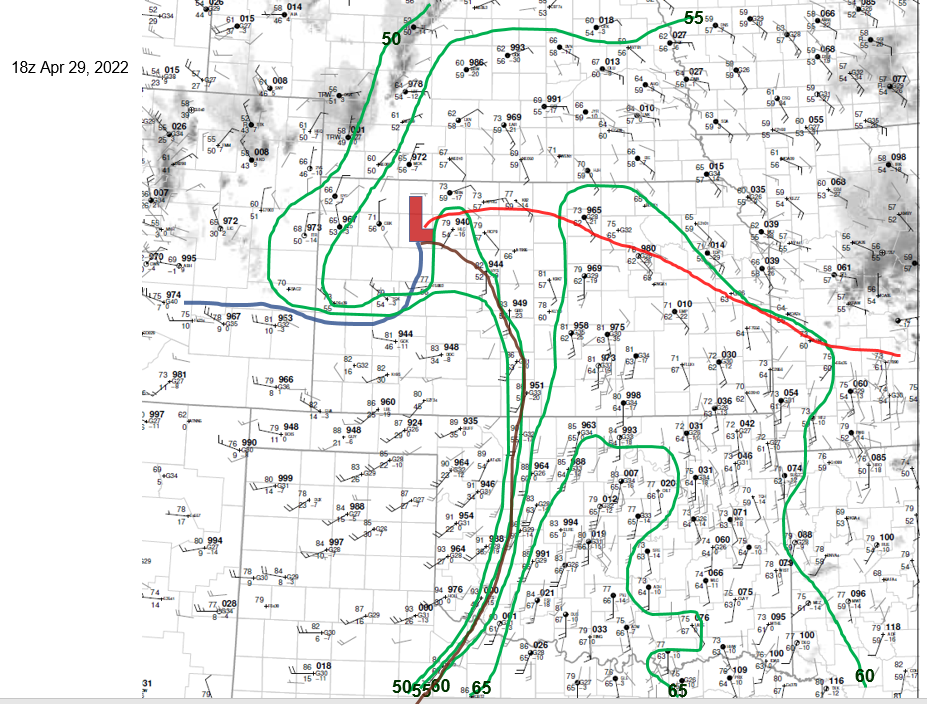 |
| 500mb chart from 00z on April 30th | 300mb chart from 00z on April 30th | 18z surface map |
 |
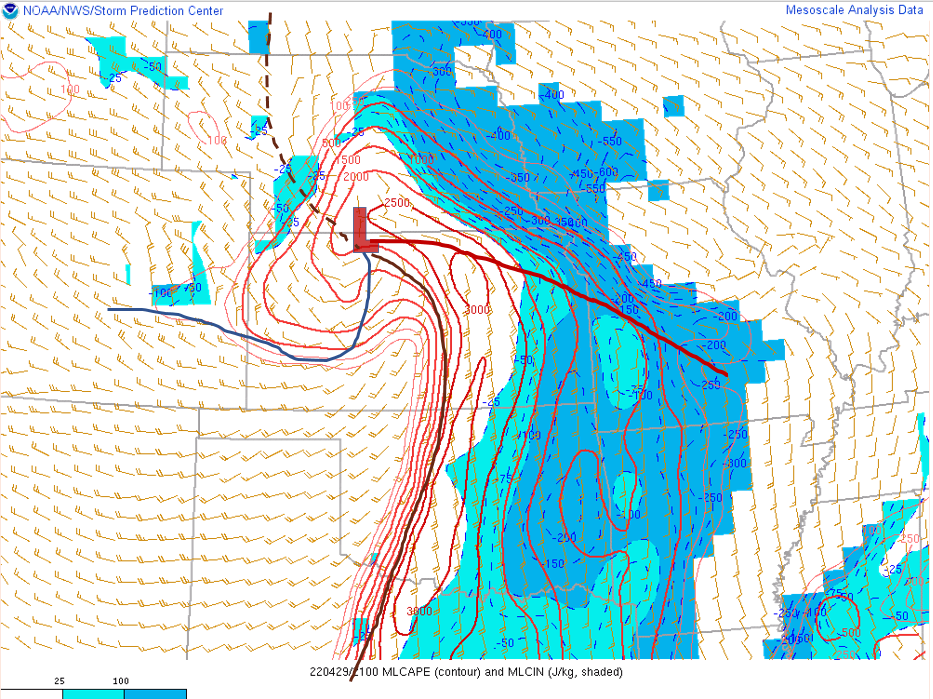 |
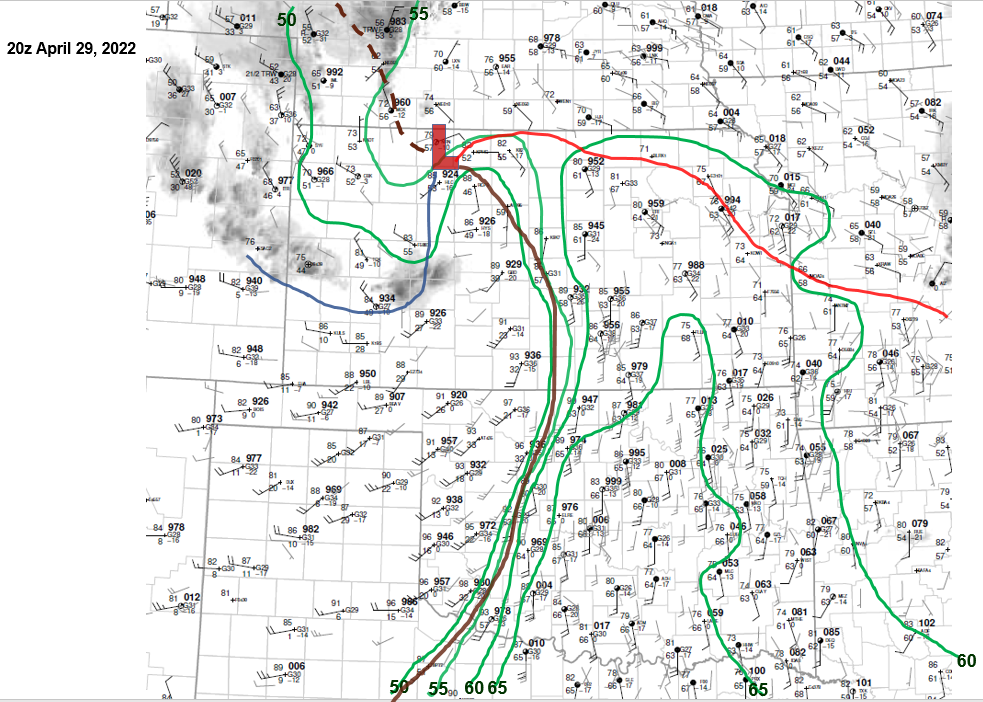
 |
| 20z surface map | 21z ML CAPE | 20z 300mb chart |
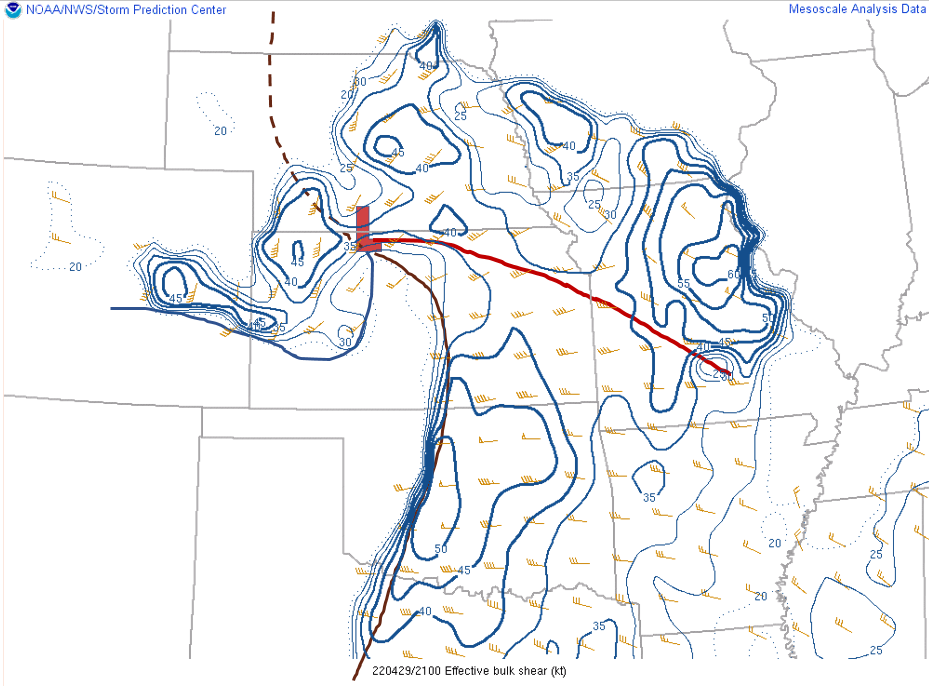 |
||
| 21z effective bulk shear |
Visible satellite animation ending around 21z.
Additional Information (coming soon)
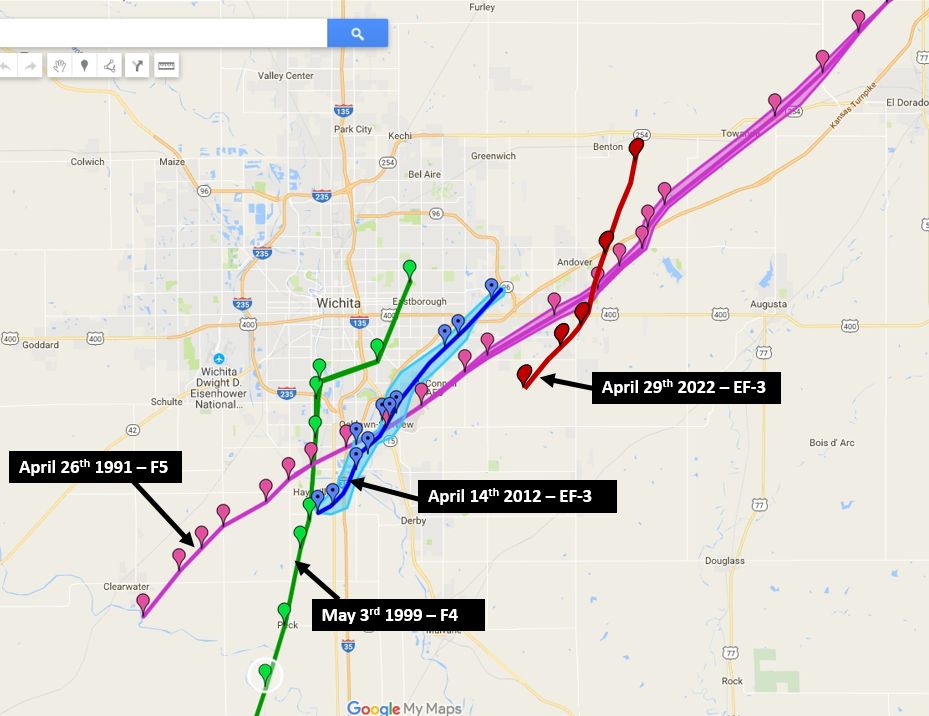
Map showing the most notable tornadoes to affect the Wichita area
 |
Media use of NWS Web News Stories is encouraged! Please acknowledge the NWS as the source of any news information accessed from this site. |
|