For the latest river levels, please visit the Rivers & Lakes page.
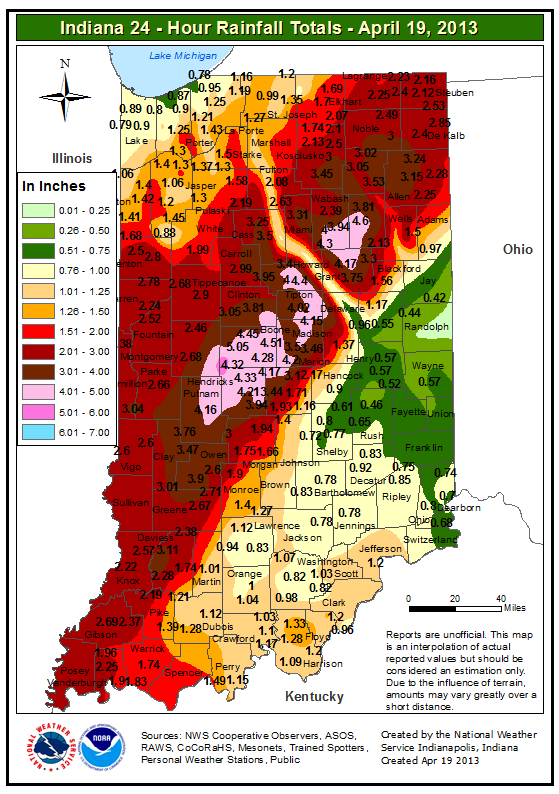
Thunderstorms brought heavy rain to much of central Indiana on April 18 and early on April 19. Some areas of central Indiana received around 5 inches of rain in 24 hours. This was on top of heavy rain from previous days. The result was flooding of numerous streams and rivers, some of which reached record levels.
 |
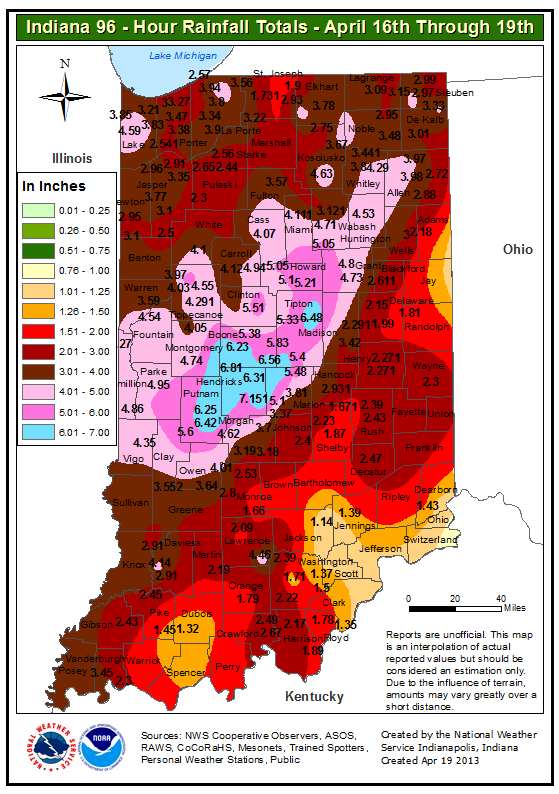 |
| 24 hour rainfall ending 7:00 AM April 19. Click to enlarge | 4 day rainfall ending 7:00 AM April 19. Click to enlarge |
 |
|
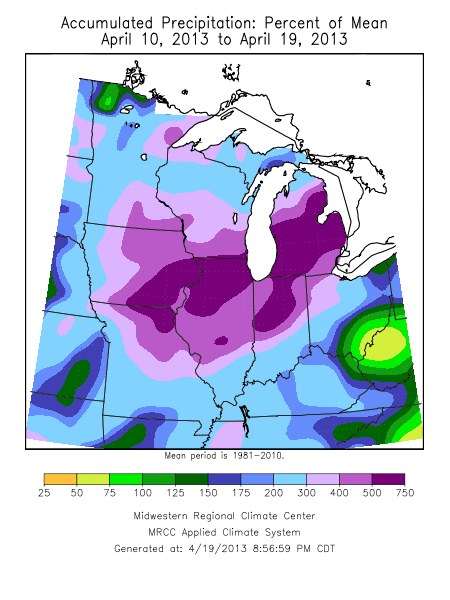
| Percent of Average Precipitation for the period April 10-19. Image courtesy of the Midwest Regional Climate Center. | |
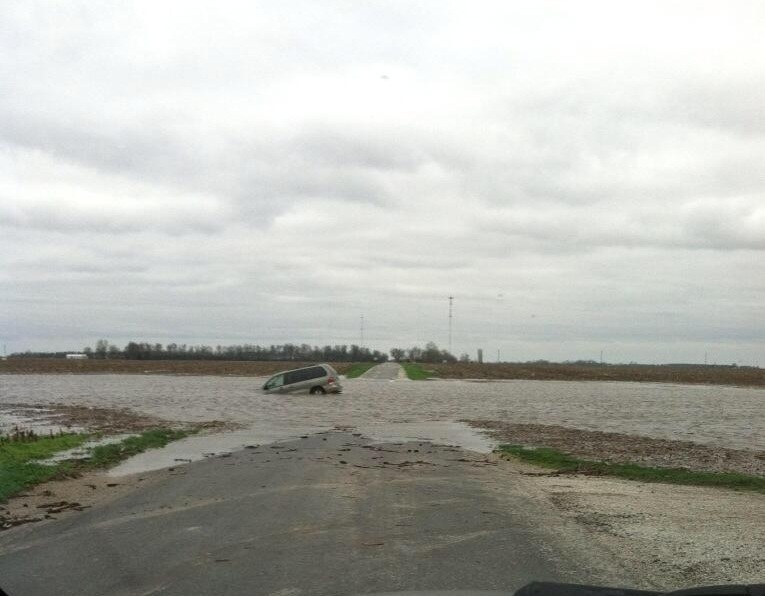
Below are some pictures of flooding. Click an image to enlarge.
 |
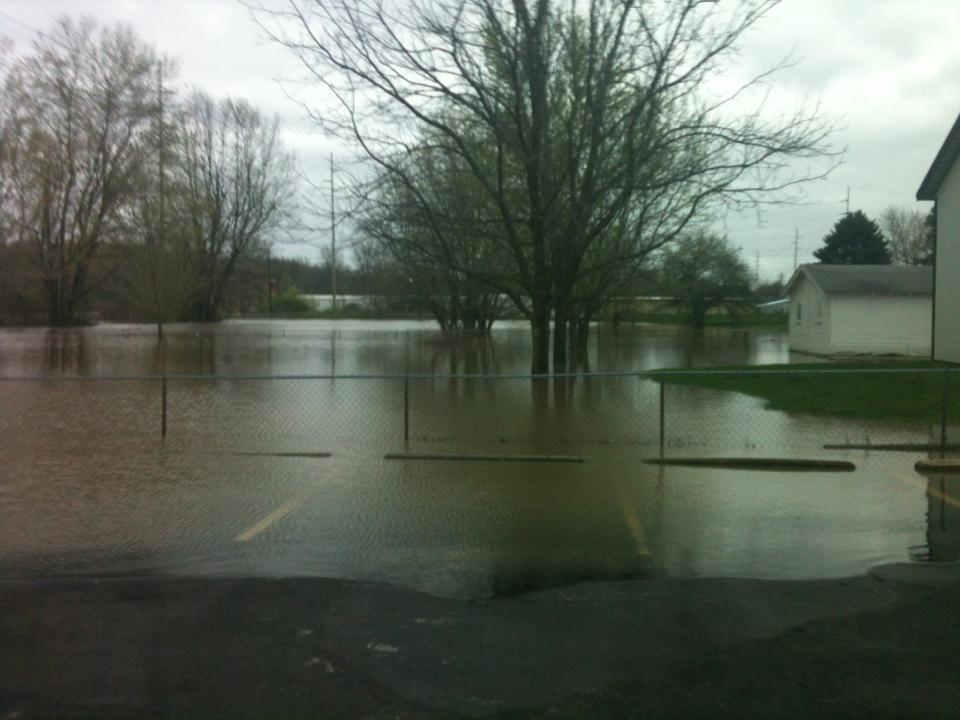 |
| Flooding near Frankfort. Photo courtesy of D. Snyder | Flooding in Mooresville Indiana. Photo courtesy of V. Harless |
 |
 |
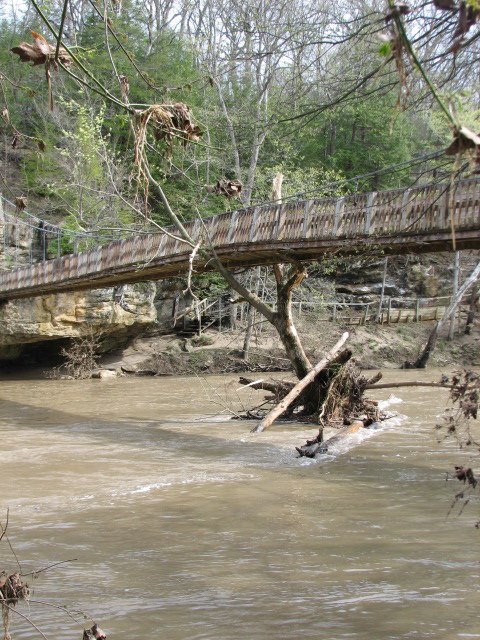 |
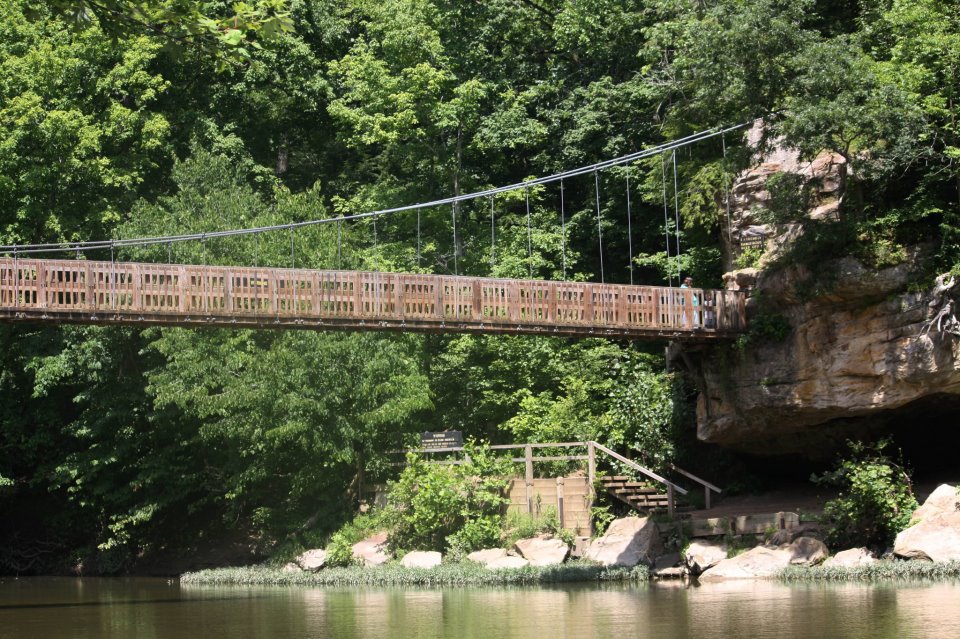
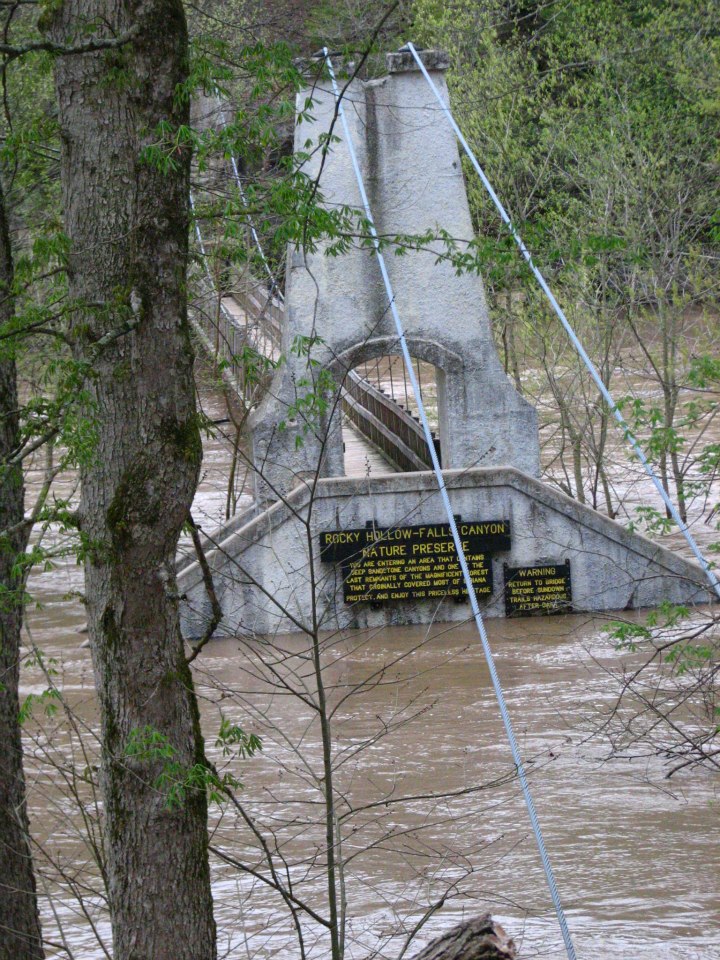
| Image of Bridge at Turkey Run State Park from 2011 showing water level close to average. Image courtesy of Turkey Run State Park Facebook page. Click to Enlarge. | Image of Bridge at Turkey Run State Park from height of flooding. Image courtesy of Turkey Run State Park Facebook page. Click to Enlarge. | Image of Bridge at Turkey Run State Park as flooding is receding.Image courtesy of Turkey Run State Park Facebook page. Click to Enlarge. |
Below are some plots of stream levels at various sites, along with notes on how the level compares with historical levels for the site. A tabular listing is also available.
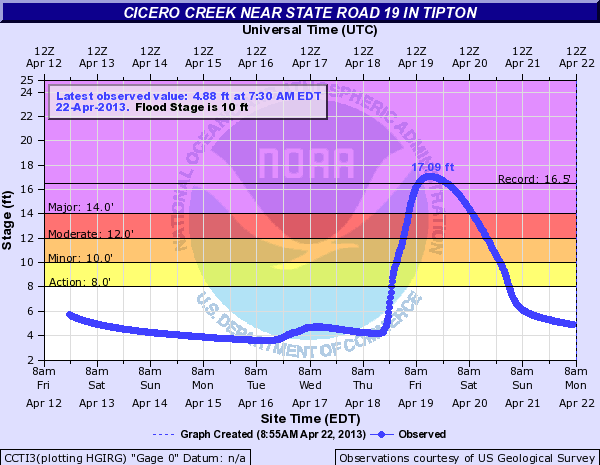 |
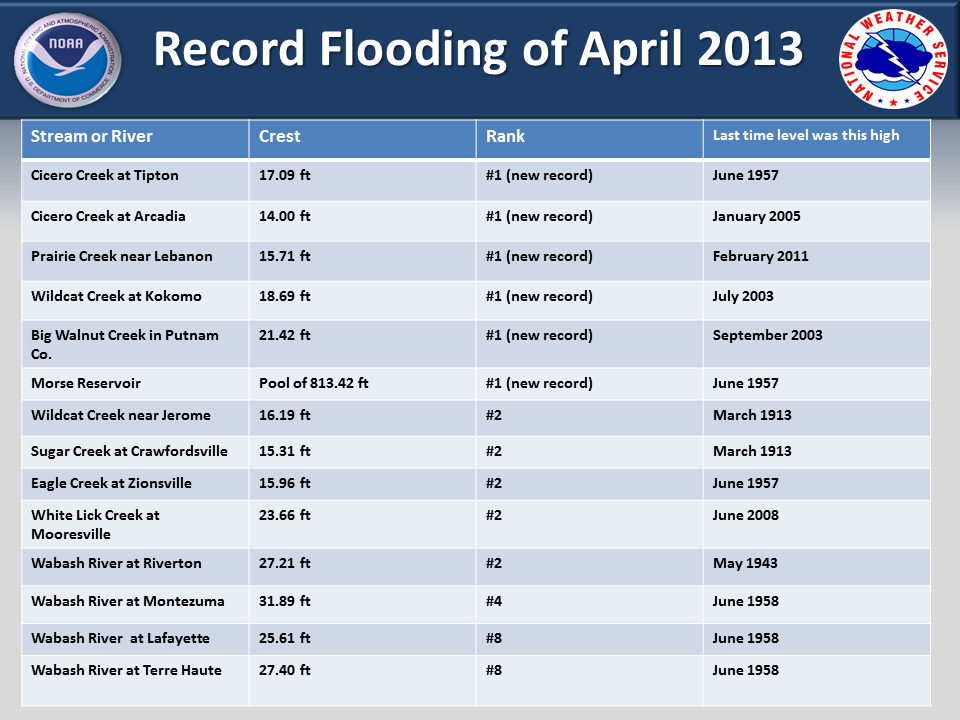
Record flood of 17.09 ft. Previous record was 16.5 ft on June 28, 1957 |
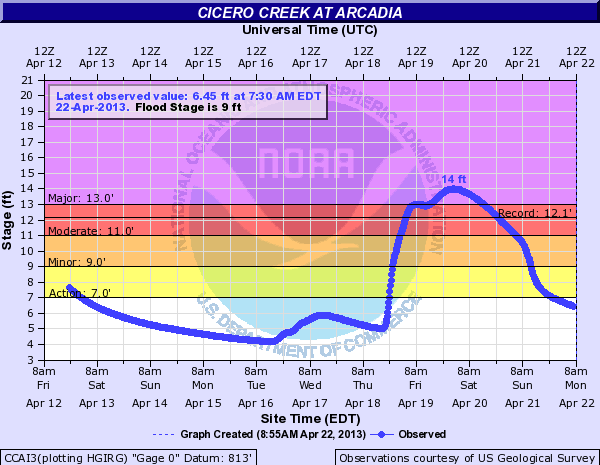 |
Record Flood of 14.00 ft. Previous record was 12.15 ft on Jan. 13, 2005 |
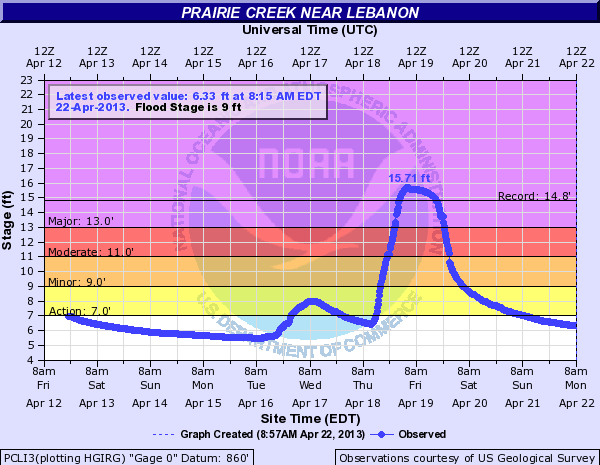 |
Record flood of 15.71 ft. Previous record was 14.82 ft on February 28, 2011. |
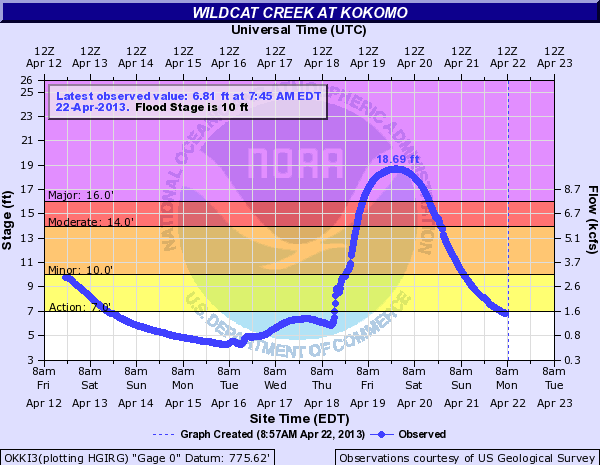 |
Record flood of 18.69 ft. Previous record was 17.75 ft on July 5, 2003. |
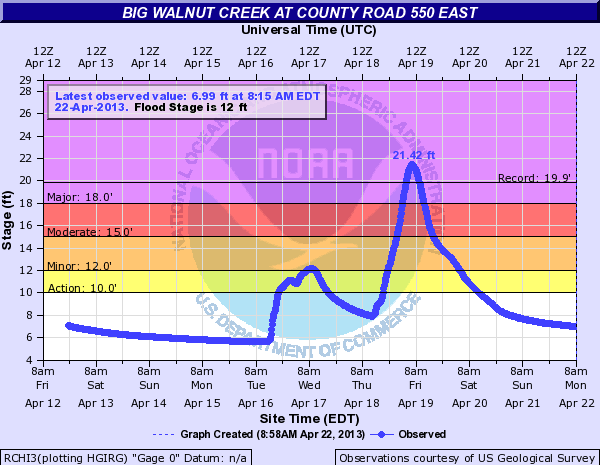 |
Record flood of 21.42 ft. Previous record was 19.86 ft on Sep. 1, 2003. |
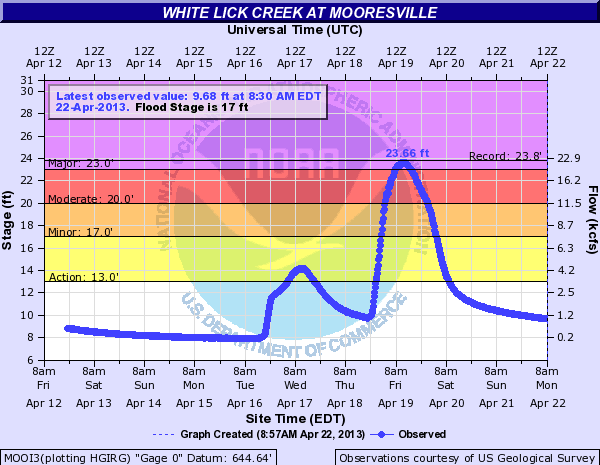 |
23.66 ft crest. Second place behind the record of 23.80 ft on June 7, 2008. |
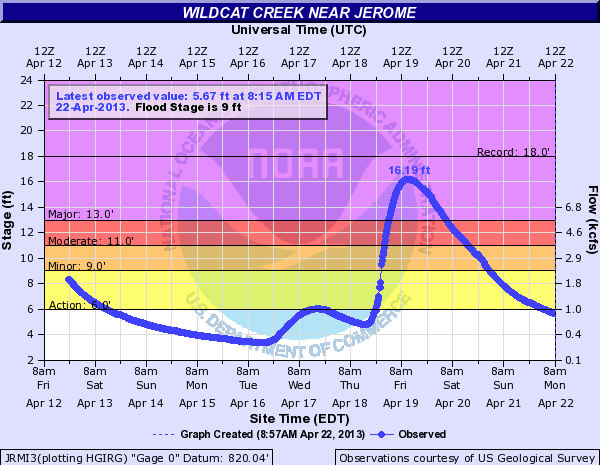 |
16.19 ft crest. Second to 18.0 ft on March 24, 1913. |
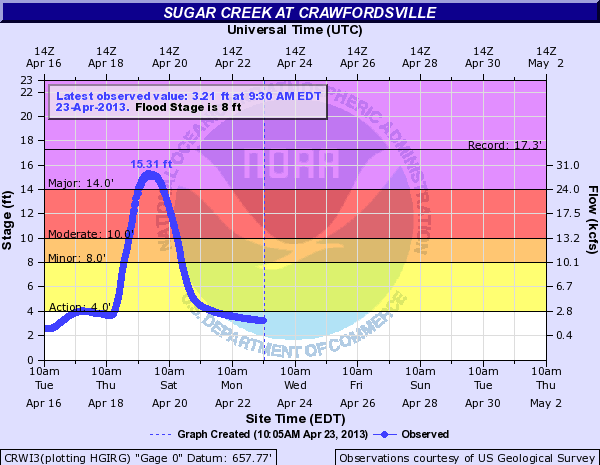 |
15.31 ft crest. Second to 17.30 ft in March 1913. |
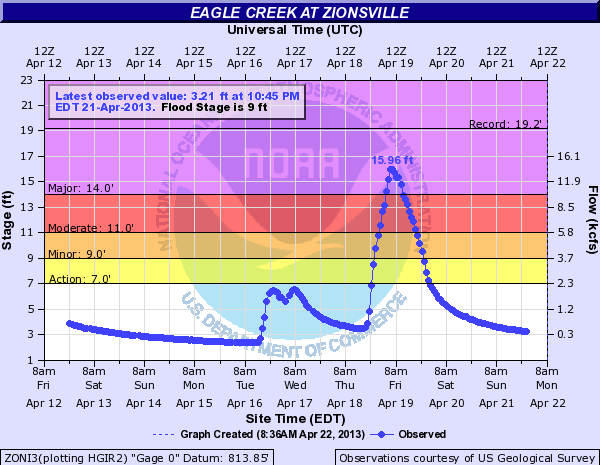 |
15.96 ft crest. Second to 19.20 ft on June 28, 1957. |
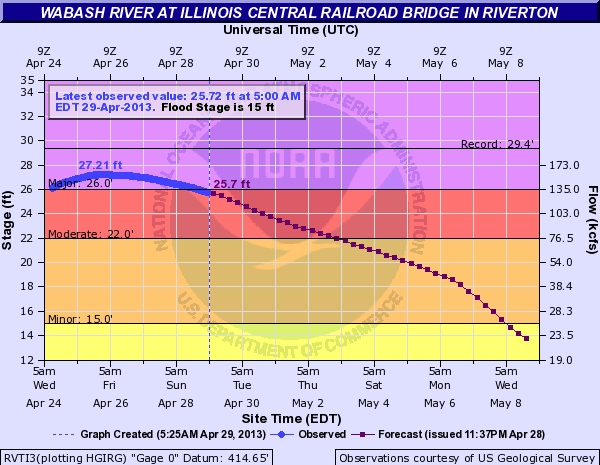 |
Crest of 27.21 ft. Second to 29.36 ft. crest on May 21, 1943. |
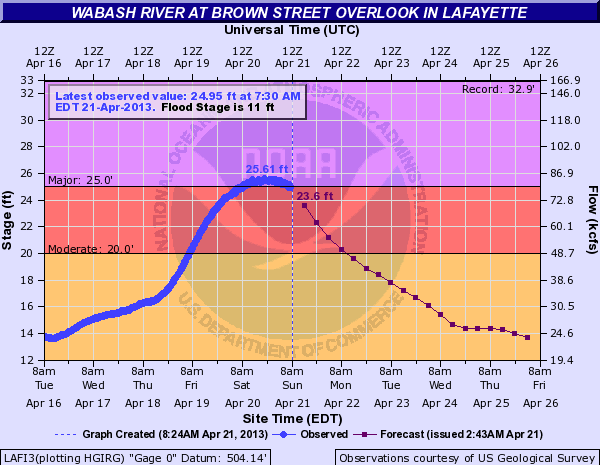 |
Crest of 25.61 ft. Highest crest since 1958. 8th highest crest on record. |
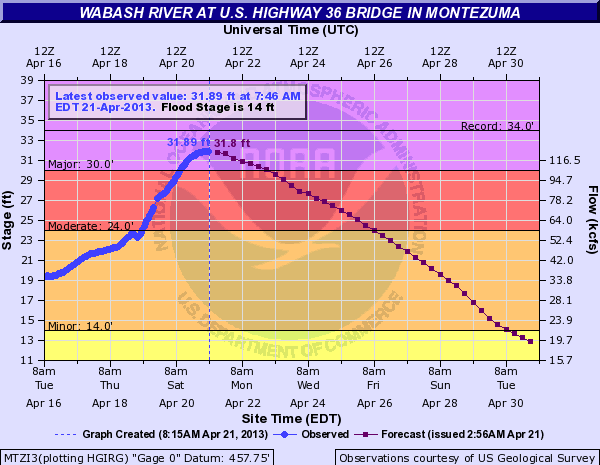 |
31.89 ft crest, highest since 1958. 4th highest crest on record. |
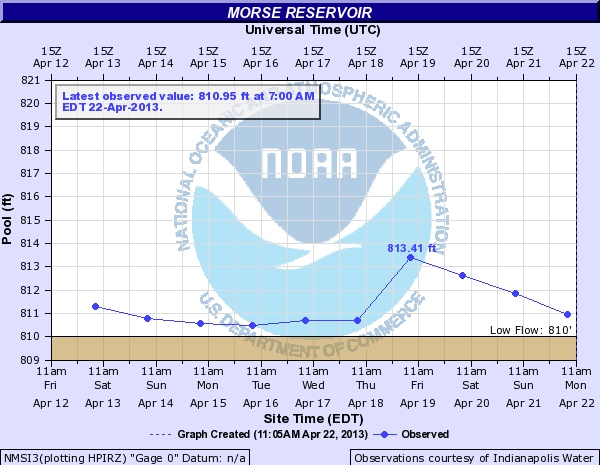 |
Record pool of 813.41 ft. Previous record was 812.95 ft in June of 1957. |
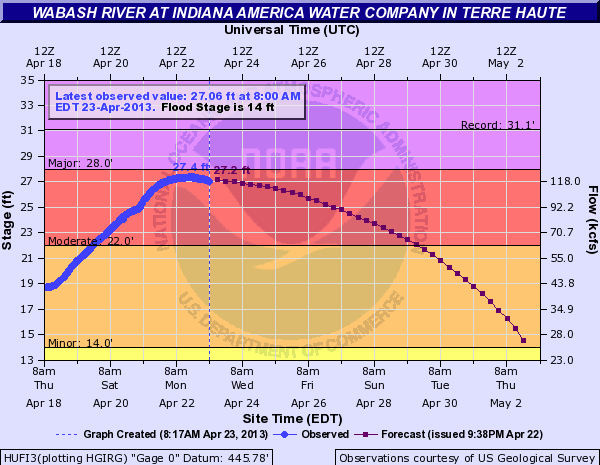 |
27.40 ft crest. Highest crest since 1958. 8th highest crest on record. |
|
Hydrograph Not Available - Eagle Creek at Speedway |
18.18 ft crest. Record stage for the site due to release from Eagle Creek Dam. Previous record was 16.57ft in September 2003. |

