National Weather Service United States Department of Commerce

El Niño conditions have developed in the Pacific Ocean. These conditions are predicted to last into Spring 2016. Below is some information on what El Niño is and its potential impacts on central Indiana.

What is El Niño?

El Niño occurs when sea surface temperatures in the equatorial Pacific ocean are unusually warm. The warm water interacts with the atmosphere and results in a change in weather patterns.


What are the typical effects of El Niño on winter weather?

Northern Hemisphere El Ni����¯�¿�½���¯���¿���½������¯������¿������½����¯�¿�½������¯����¯�¿�½������¿����¯�¿�½������½����¯�¿�½���¯���¿���½����¯�¿�½������¯����¯�¿�½���¯���¿���½����¯�¿�½������¿����¯�¿�½���¯���¿���½����¯�¿�½������½����¯�¿�½���¯���¿���½������¯������¿������½����¯�¿�½���¯���¿���½����¯�¿�½������¯����¯�¿�½���¯���¿���½������¯������¿������½����¯�¿�½���¯���¿���½����¯�¿�½������¿����¯�¿�½���¯���¿���½������¯������¿������½����¯�¿�½���¯���¿���½����¯�¿�½������½����¯�¿�½���¯���¿���½������¯������¿������½����¯�¿�½������¯����¯�¿�½������¿����¯�¿�½������½����¯�¿�½���¯���¿���½����¯�¿�½������¯����¯�¿�½���¯���¿���½����¯�¿�½������¿����¯�¿�½���¯���¿���½����¯�¿�½������½����¯�¿�½���¯���¿���½������¯������¿������½����¯�¿�½������¯����¯�¿�½������¿����¯�¿�½������½����¯�¿�½���¯���¿���½������¯������¿������½����¯�¿�½���¯���¿���½����¯�¿�½������±o Weather Patterns
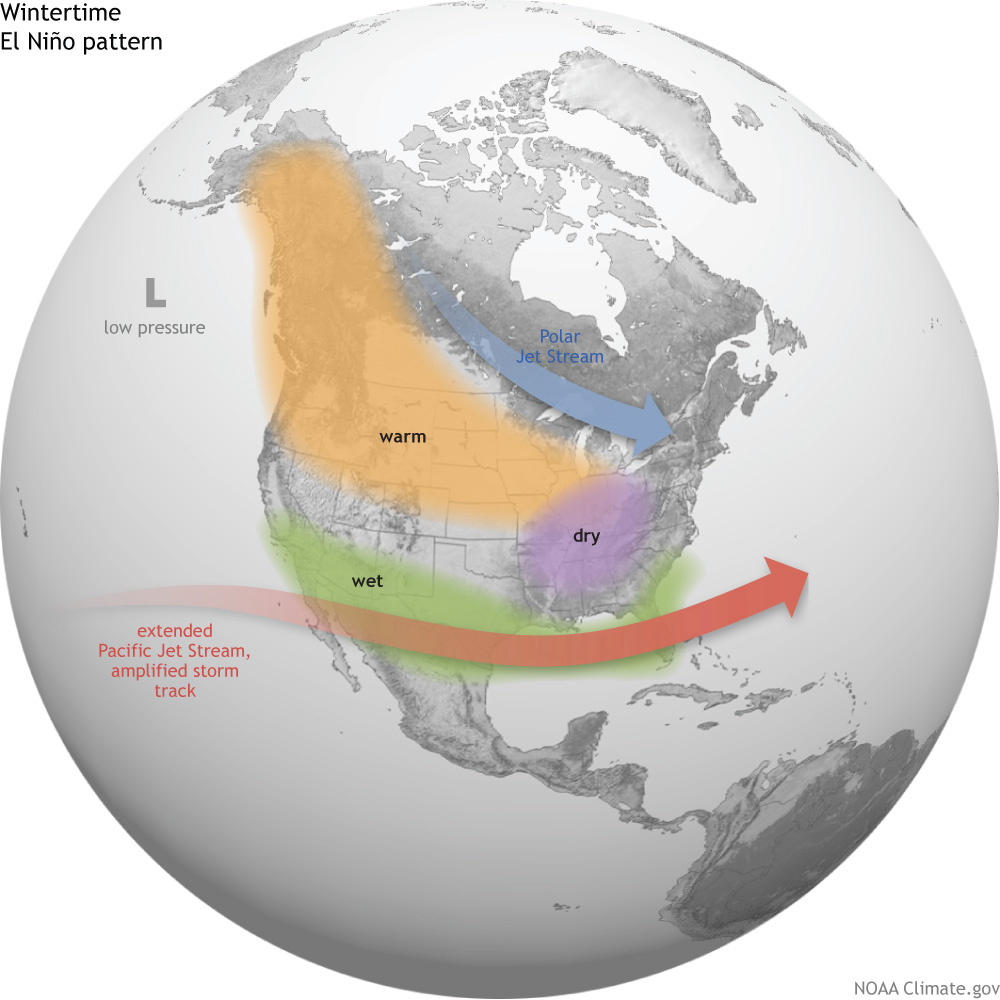
Typical Weather Pattern. Click to Enlarge. Image courtesy of NOAA Climate.

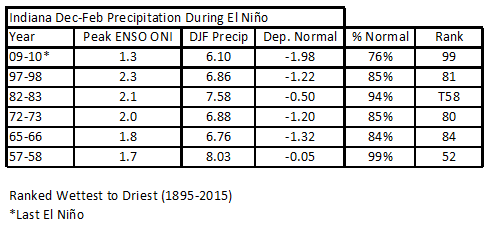
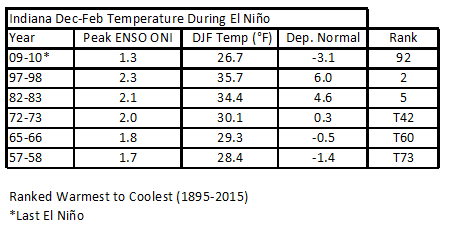
For Indiana, temperatures typically are above average and precipitation is below average. However, not every El Niño produces the same effects.


How is the current El Niño comparing to past El Niños?

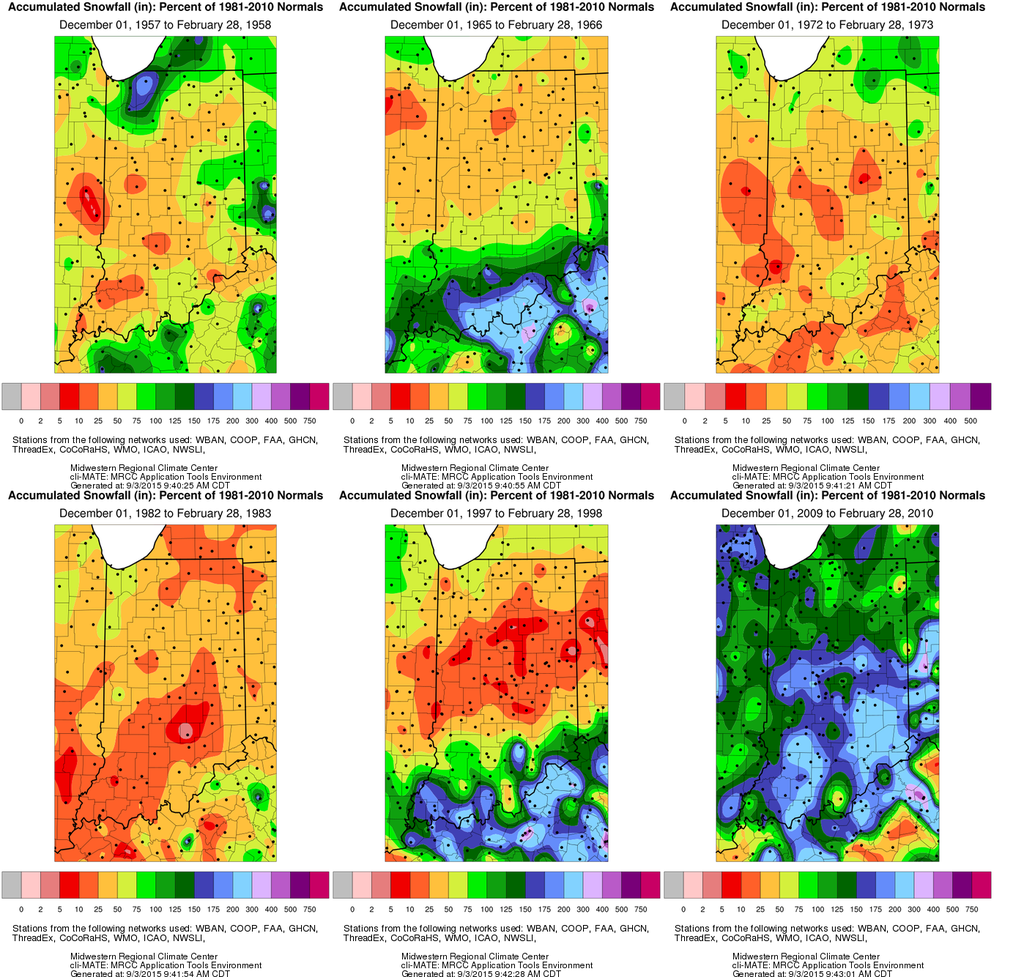
Experts at NOAA’s Climate Prediction Center are now forecasting the current El Niño to be similarly as strong as the 1982-83 and 1997-98 El Niños. Those years were some of the strongest events since 1950.

However, the current event has a difference from those. Farther north in the Pacific, waters are warmer than average too. This may create additional effects upon the weather pattern this winter if these warmer waters persist through the winter. It has been theorized that these abnormally warm water temperatures, which were present the past couple winters, were a contributing factor to the recent abnormally cold winters. 


Sea Surfacve Temperature Comparisons
Sea surface temperature anomalies between recent strong El Niño events compared with the current event.


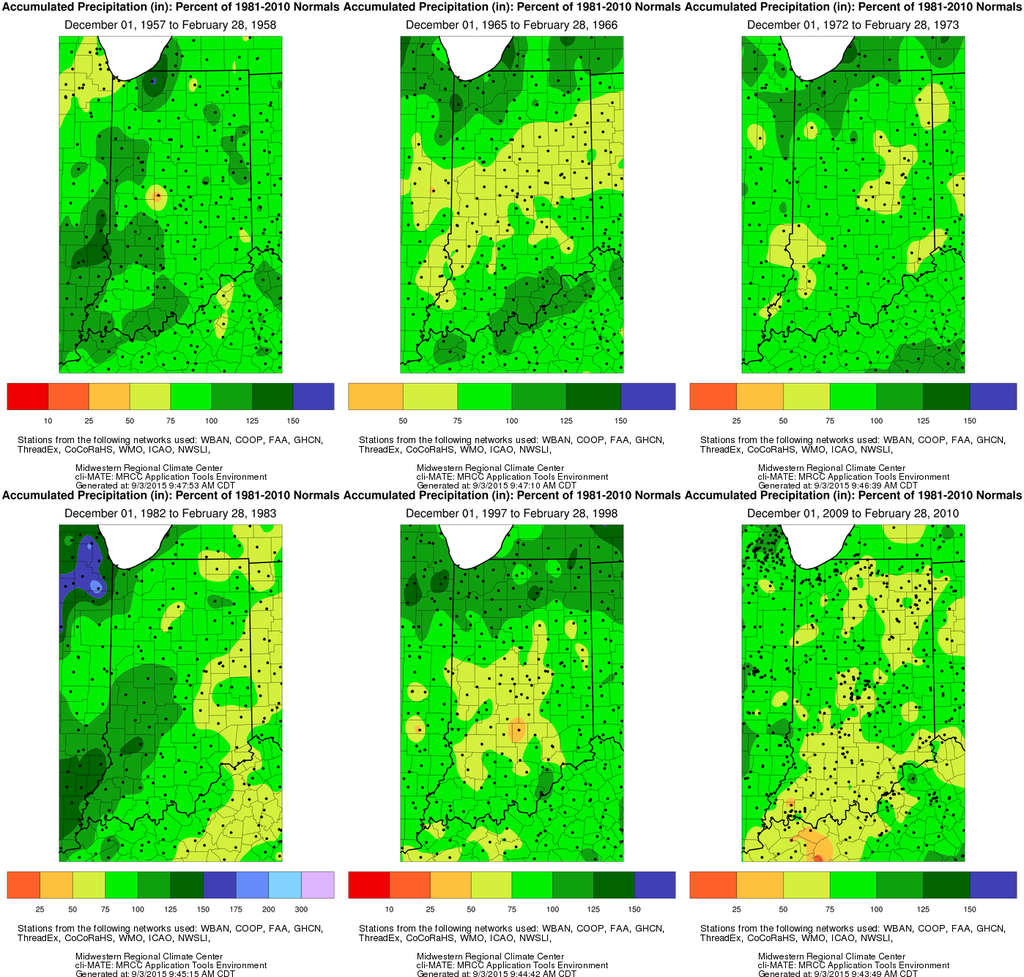
Indiana Climate during Previous Strong El Niños:

The following images and tables in this section are courtesy of the Midwest Regional Climate Center. Click any image to enlarge.

Precipitation:

Precipitation Percent of Normal During Strong El Ni����¯�¿�½���¯���¿���½������¯������¿������½����¯�¿�½������¯����¯�¿�½������¿����¯�¿�½������½����¯�¿�½���¯���¿���½����¯�¿�½������¯����¯�¿�½���¯���¿���½����¯�¿�½������¿����¯�¿�½���¯���¿���½����¯�¿�½������½����¯�¿�½���¯���¿���½������¯������¿������½����¯�¿�½���¯���¿���½����¯�¿�½������¯����¯�¿�½���¯���¿���½������¯������¿������½����¯�¿�½���¯���¿���½����¯�¿�½������¿����¯�¿�½���¯���¿���½������¯������¿������½����¯�¿�½���¯���¿���½����¯�¿�½������½����¯�¿�½���¯���¿���½������¯������¿������½����¯�¿�½������¯����¯�¿�½������¿����¯�¿�½������½����¯�¿�½���¯���¿���½����¯�¿�½������¯����¯�¿�½���¯���¿���½����¯�¿�½������¿����¯�¿�½���¯���¿���½����¯�¿�½������½����¯�¿�½���¯���¿���½������¯������¿������½����¯�¿�½������¯����¯�¿�½������¿����¯�¿�½������½����¯�¿�½���¯���¿���½������¯������¿������½����¯�¿�½���¯���¿���½����¯�¿�½������±o Events


Snowfall:

Snowfall During Strong Events


Temperature:

Temperature Anomalies for Indiana during El Ni����¯�¿�½���¯���¿���½������¯������¿������½����¯�¿�½������¯����¯�¿�½������¿����¯�¿�½������½����¯�¿�½���¯���¿���½����¯�¿�½������¯����¯�¿�½���¯���¿���½����¯�¿�½������¿����¯�¿�½���¯���¿���½����¯�¿�½������½����¯�¿�½���¯���¿���½������¯������¿������½����¯�¿�½���¯���¿���½����¯�¿�½������¯����¯�¿�½���¯���¿���½������¯������¿������½����¯�¿�½���¯���¿���½����¯�¿�½������¿����¯�¿�½���¯���¿���½������¯������¿������½����¯�¿�½���¯���¿���½����¯�¿�½������½����¯�¿�½���¯���¿���½������¯������¿������½����¯�¿�½������¯����¯�¿�½������¿����¯�¿�½������½����¯�¿�½���¯���¿���½����¯�¿�½������¯����¯�¿�½���¯���¿���½����¯�¿�½������¿����¯�¿�½���¯���¿���½����¯�¿�½������½����¯�¿�½���¯���¿���½������¯������¿������½����¯�¿�½������¯����¯�¿�½������¿����¯�¿�½������½����¯�¿�½���¯���¿���½������¯������¿������½����¯�¿�½���¯���¿���½����¯�¿�½������±os

Three Month Forecastr

As can be seen above, not all winters are the same under El Niños. However, the odds favor warmer and drier conditions. Below are the forecasts for Temperature and Precipitation for the next 3 months. The official NOAA winter weather outlook is available here.

CPC 3 Month Temperature Prediction  CPC 3 Month Precipitation Forecast


Resources for More El Niño Information


Thanks to NWS Chicago for some information on this page and to the Midwest Regional Climate Center  for images and climate data on this page.