| Climate/Almanac Data - Sep Normals - Sep Records |
| |
| SEPTEMBER |
| |
|
Site (Click site name for report)
|
Avg
Temp |
Norm
1991-2020 |
Dept
From
Norm |
Precip
Total |
Norm
1991-2020 |
Dept
From
Norm |
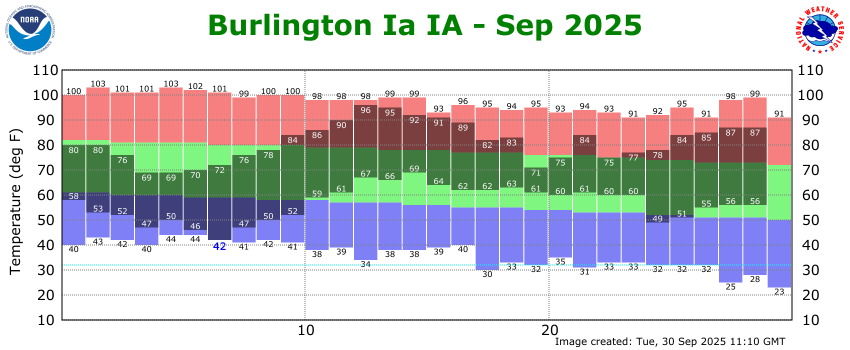
| Burlington |
69.1° |
66.7° |
+2.4° |
1.13"
(11th driest) |
3.53" |
-2.30" |
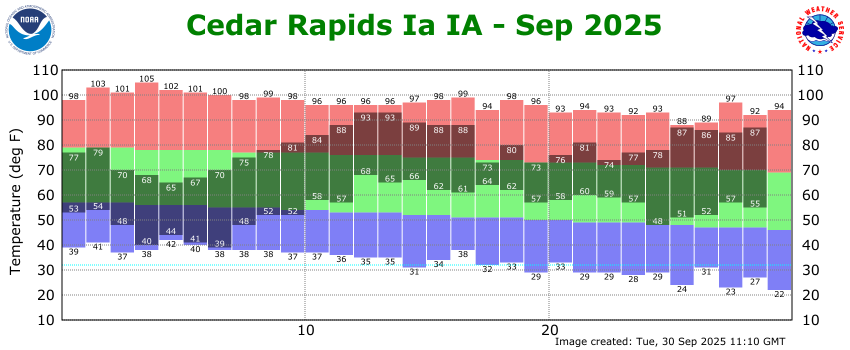
| Cedar Rapids |
67.3° |
63.3° |
+4.0° |
0.94"
(8th driest)
|
3.40" |
-2.36" |
| Davenport |
68.4° |
64.6° |
+3.8° |
0.34" |
3.47" |
-3.03" |
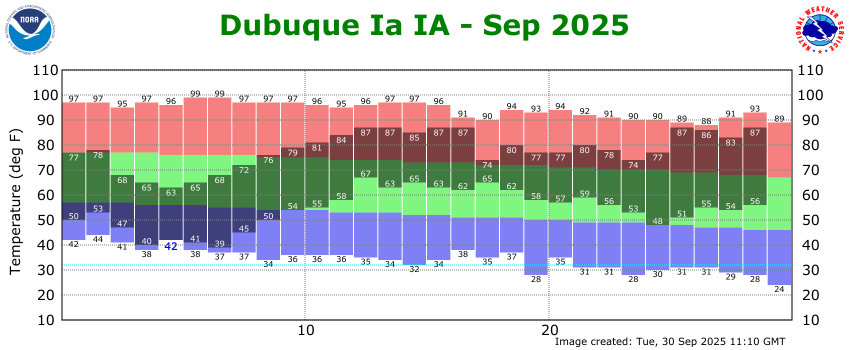
| Dubuque |
66.3° |
62.3° |
+4.0° |
0.76"
(10th driest) |
3.82" |
-2.95" |
| Iowa City |
69.4° |
65.8° |
+3.6° |
1.16" |
3.24" |
-1.98" |
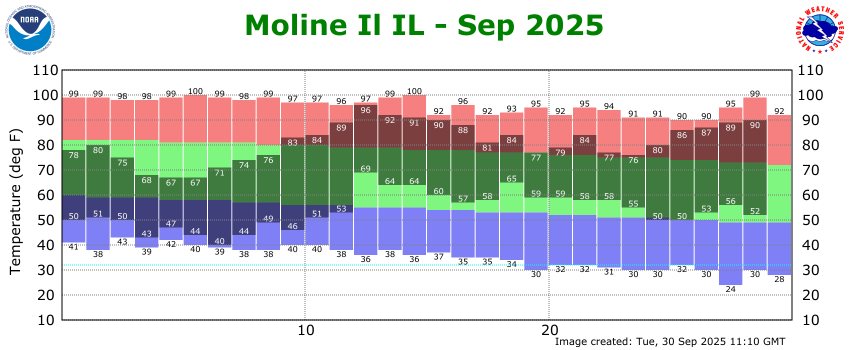
| Moline |
67.6° |
66.1° |
+1.5° |
0.71"
(6th driest) |
3.32" |
-2.52" |
|
| The ranking is listed in parentheses (__) when within the "Top 10". |
| |
| September 2025 was about 1.5 to 4 degrees above normal. |
| Precipitation totals were 2 to 3 inches below normal. |
| Please see Sep Records for monthly record information. |
| |
|
|
| |
| The climate maps below are courtesy of the Northeast Regional Climate Center |
| These maps should update to the most recent "last month" on the first of the month. |
|
|
| |
|
|
|
Average
Temperature |
Temperature
Departure from Normal |
Precipitation |
Precipitation
Percent of Normal |
 |
 |
 |
 |
|
| |
| |
| |
| |
| A LOOK AHEAD |
| |
| Climate Prediction Center |
| |
October
Temperature Outlook |
October
Precipitation Outlook |
October - December
Temperature Outlook |
October - December
Precipitation Outlook |
 |
 |
 |
 |
|
| |
| |
| |
| |
| |
| |
| |
| |