| Previous Month | Next Month |
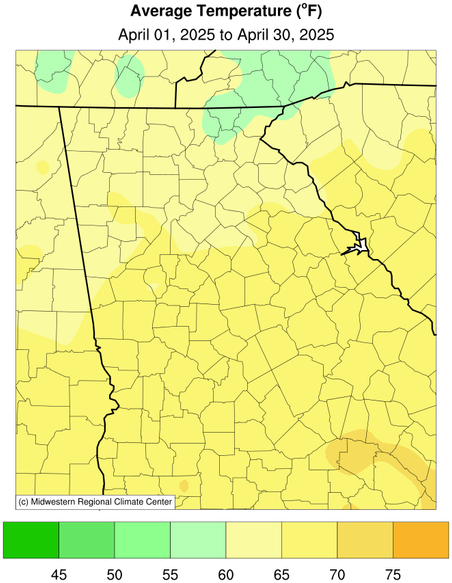
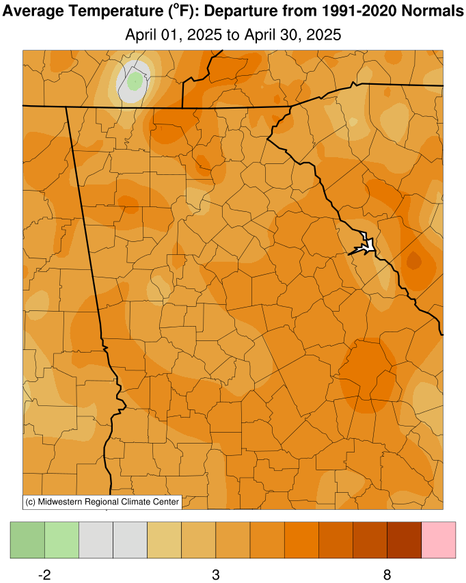
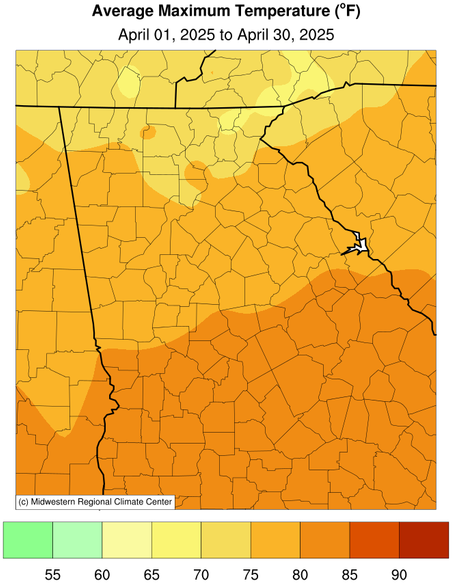
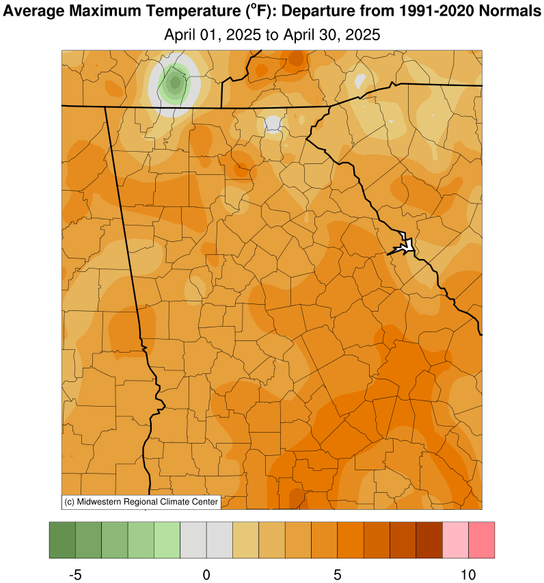
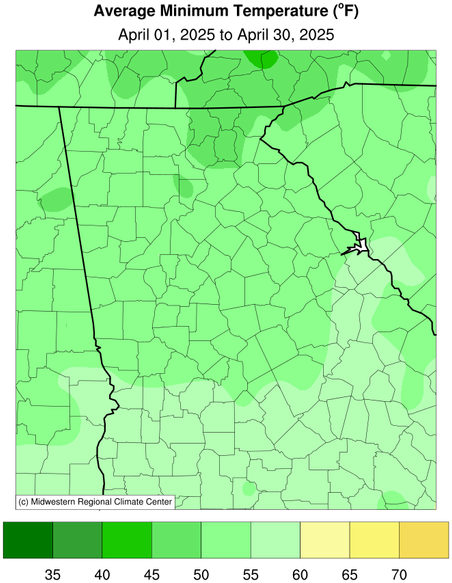
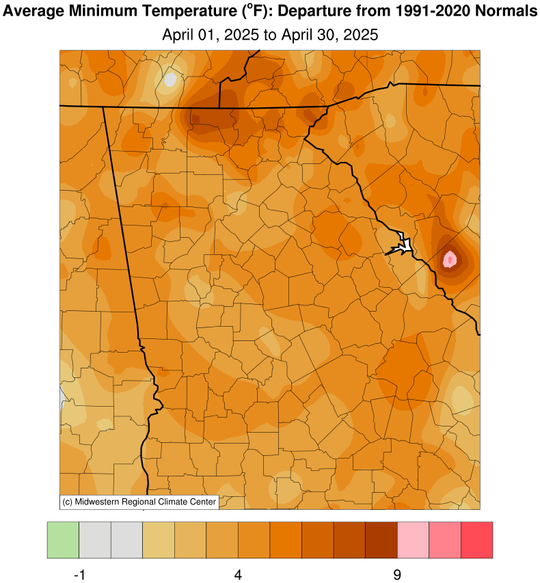
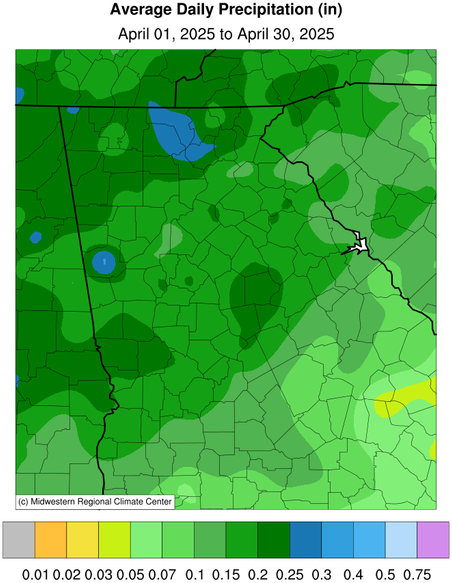
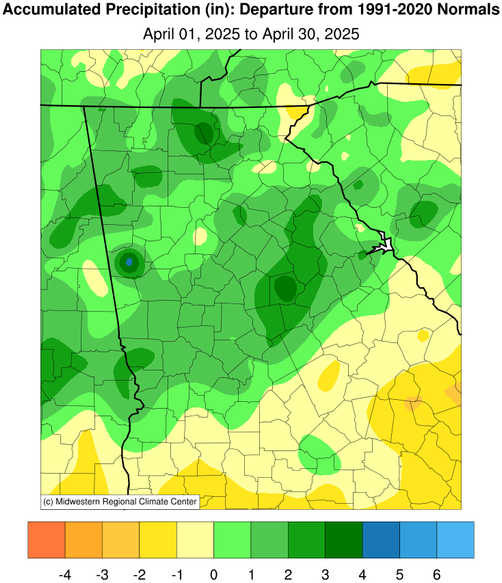
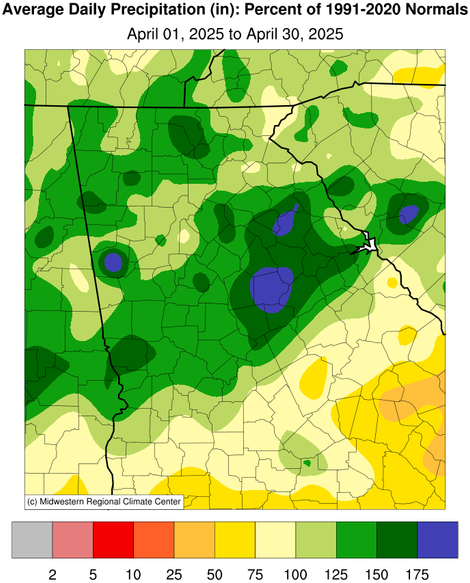
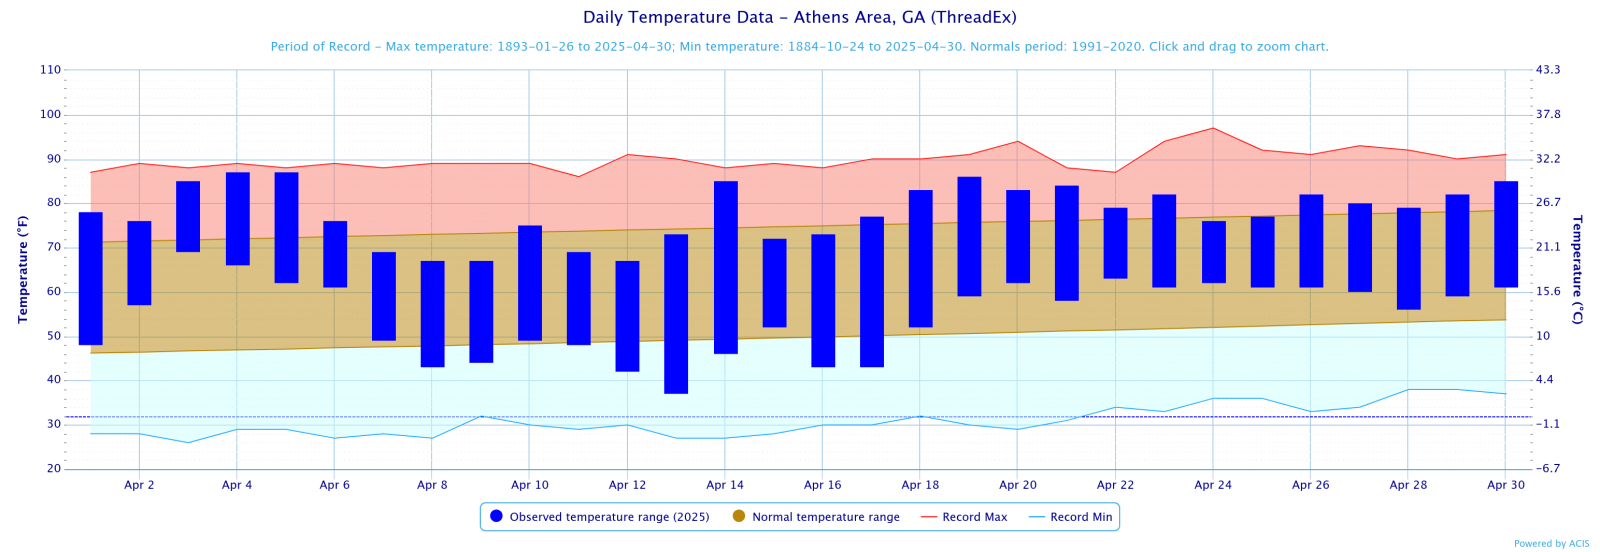
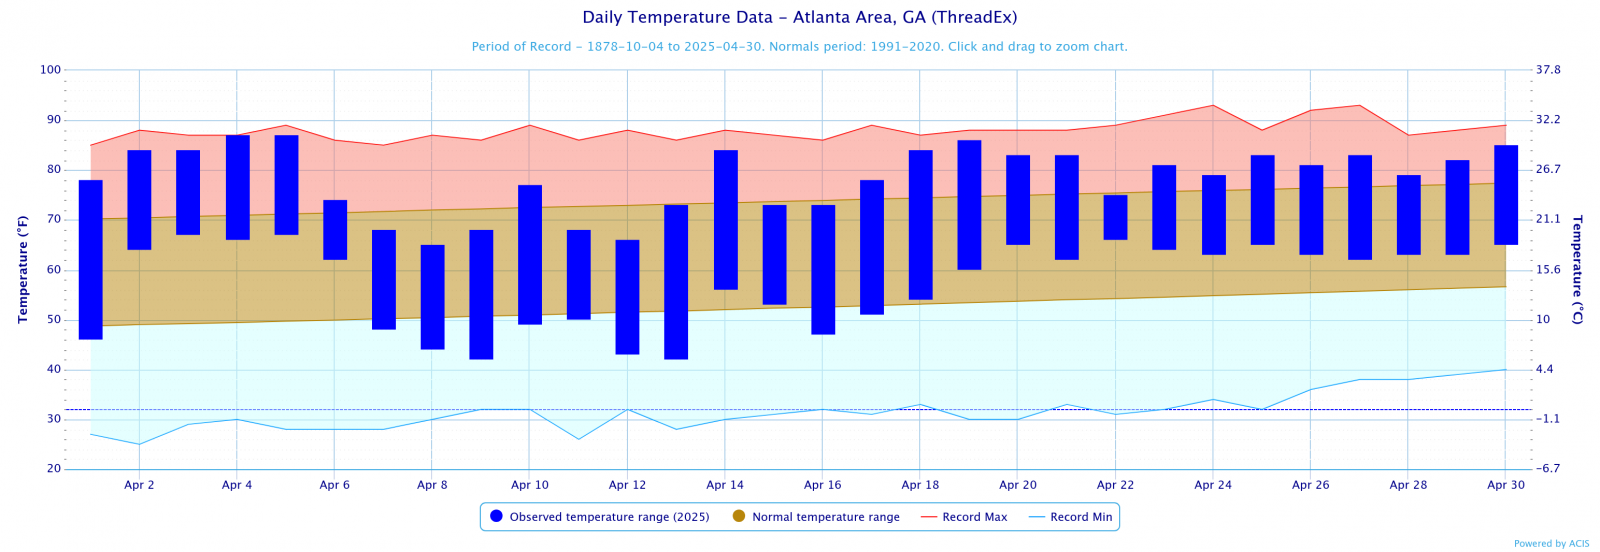
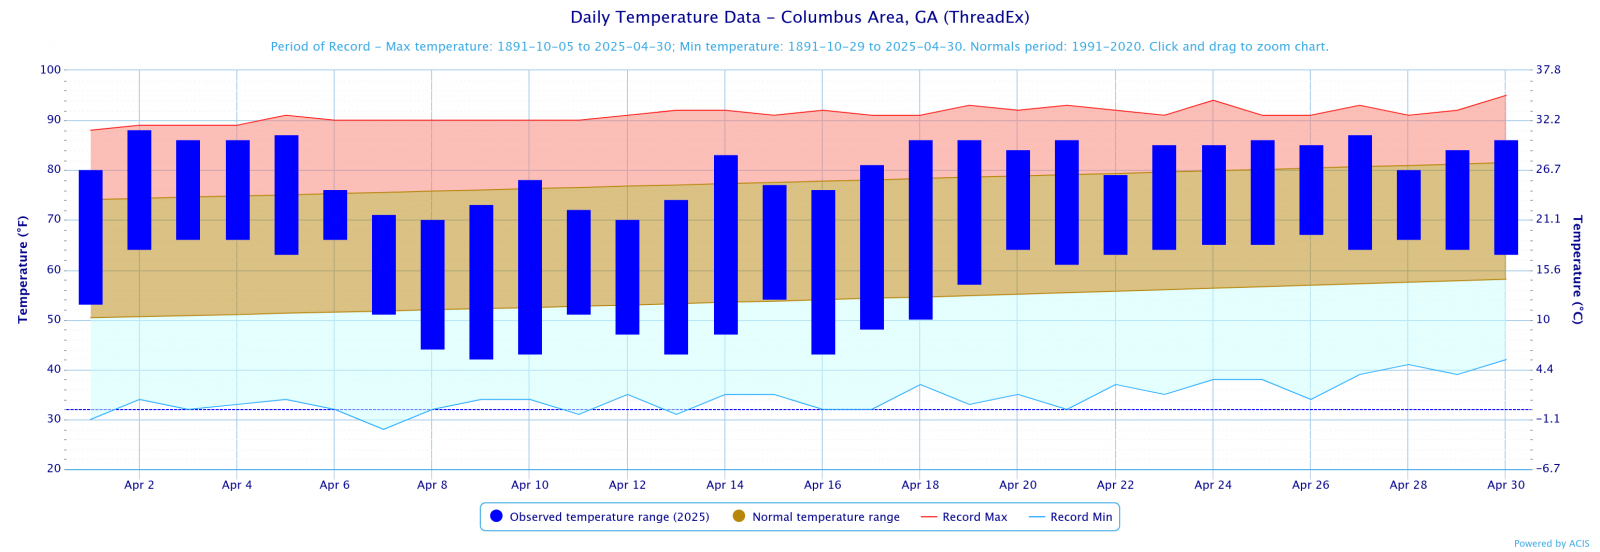
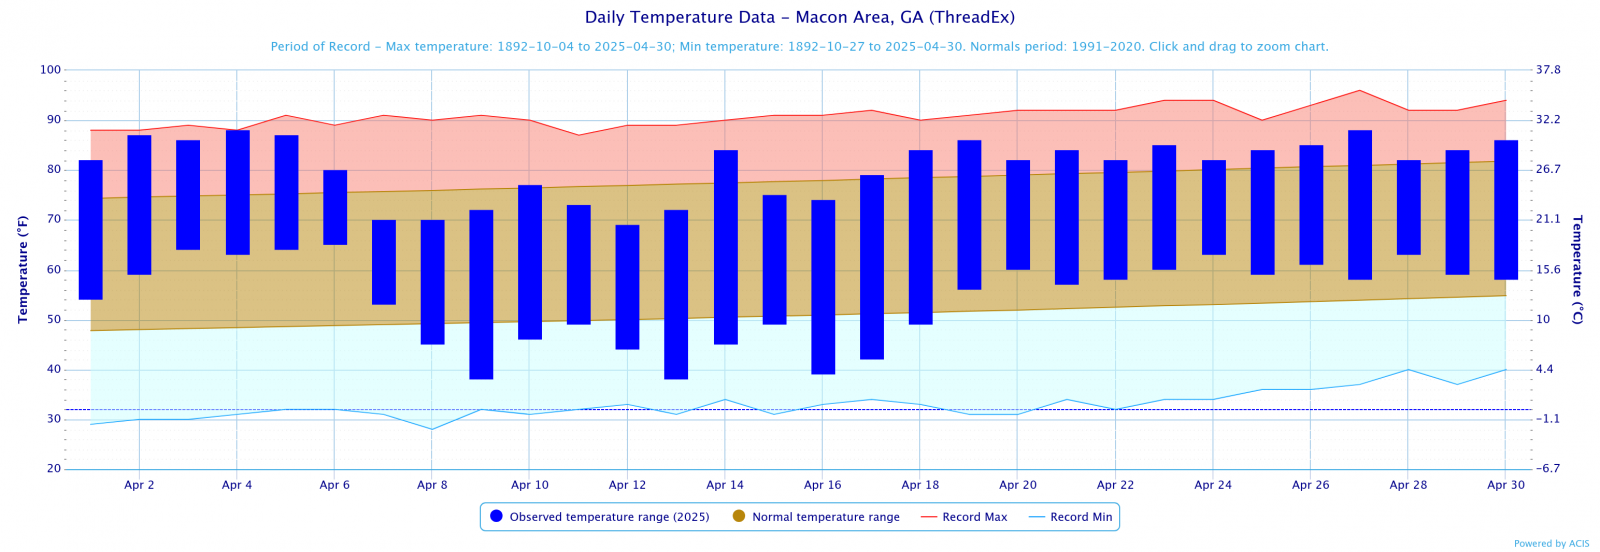
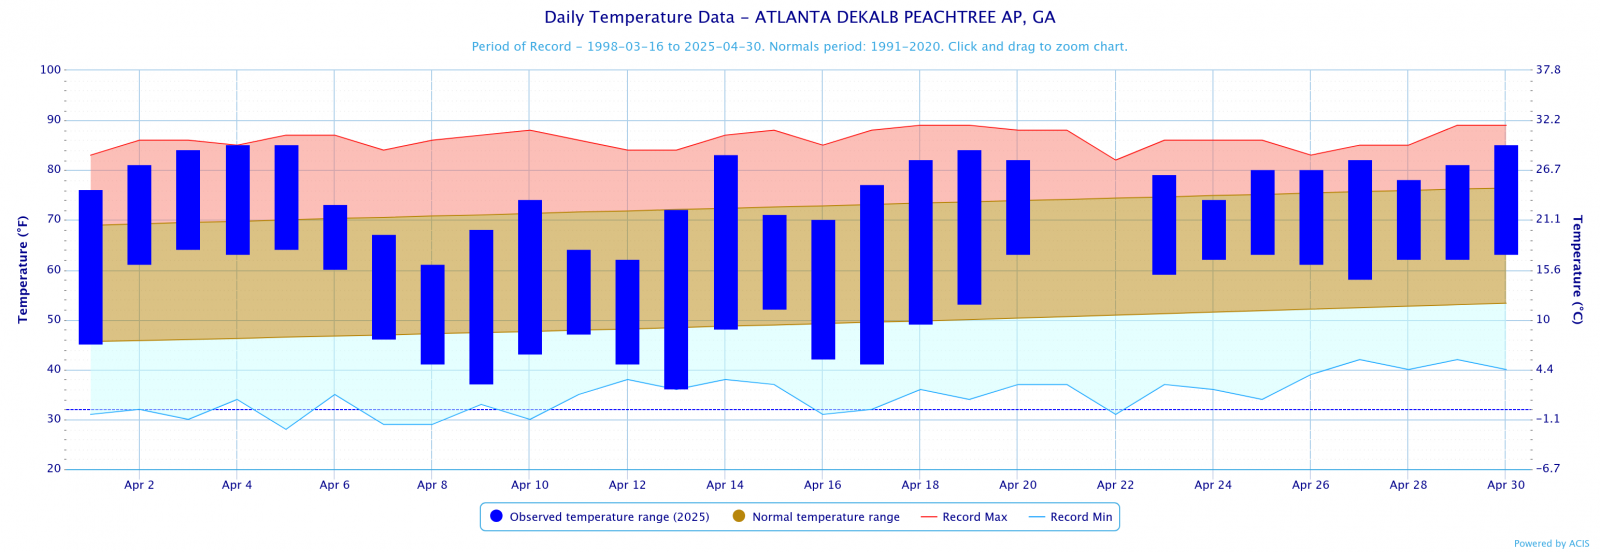
Temperatures through the month of April were 3 to 4 degrees above normal. Precipitation through the month of April were around 1 inch above normal.
Climate Site Maximum Temperature Max T Date *Indicates a daily record was set Climate Site Total Precipitation DFN (Departure Climate Site Maximum Daily Precip (in inches) Max P Date *Indicates a daily record was set Data prepared by NWS Peachtree City/Atlanta April 6-7th Severe Weather: A line of strong to severe thunderstorms moved across north and central Georgia on Sunday afternoon and evening (April 6th). Into April 7th, a secondary line pushed through west-central Georgia spawning more damage. Outside of damaging thunderstorm winds over 60 mph scattered across the area, several tornadoes briefly occurred within the line of storms. All 5 tornadoes to date were classified as "weak" (3 EF-1 and 2 EF-0) with the majority of the damage to trees. Most structural damage was a result of trees falling on homes. Details from NWS surveys in conjunction with local/county emergency management information on the five tornadoes can be found here. April 10th Large Hail and Severe Weather: On April 10th multiple cells formed in north Georgia and quickly pushed southward. Lapse rates from 8-9 degrees C/km aided in the updrafts of these storms resulting in large hail (2-2.5") in these storms. Although most of the storms stayed north of I-20, one storms did push from Haralson County southeastward to Macon and Bleckley County resulting in widespread tree damage across many counties in west-central Georgia into central Georgia. A list of the hail reports can be found here. Based on the Climate Prediction Center's outlook for May, North and central Georgia have 40-50% chance of above normal temperatures. North and central Georgia have an equal chance of above or below normal precipitation. Data prepared by NWS Peachtree City/Atlanta.
Overview
Climate Graphs
Records
Events
May Outlook
Below are the overview stats for April 2025 for our 9 climate sites.
April 2025 Climate Averages
Climate Site
Month Temp (°F)
Average Temp
Departure from normal
Athens
66.3
62.3
4.0
Atlanta
67.7
63.2
4.5
Columbus
68.9
65.9
3.0
Macon
67.3
64.5
2.8
Dekalb Peachtree Arpt
65
60.9
4.1
Fulton Co Arpt
65.6
61.7
3.9
Gainesville
65.4
60.9
4.5
Peachtree City
64.9
62.4
2.5
Rome
64.9
61.4
3.5
April 2025 Temperature Climate Statistics
Minimum Temperature
Min T Date
Athens
87
4/4,5
37
4/13
Atlanta
87*
4/4,5
42
4/9,13
Columbus
88
4/2
42
4/9
Macon
88
4/4,27
38
4/9,13
Dekalb Peachtree Arpt
85
4/5,30
36
4/13
Fulton Co Arpt
87
4/5
36
4/13
Gainesville
86
4/5
39
4/13
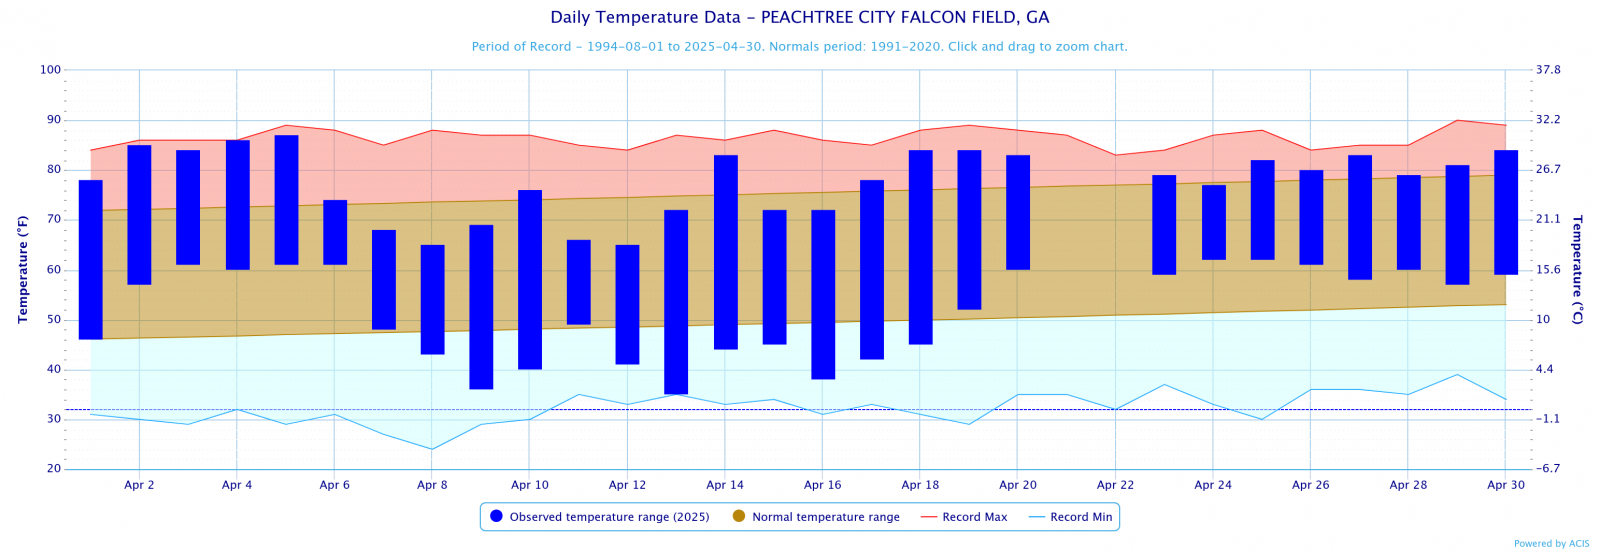
Peachtree City
87
4/5
35
4/13
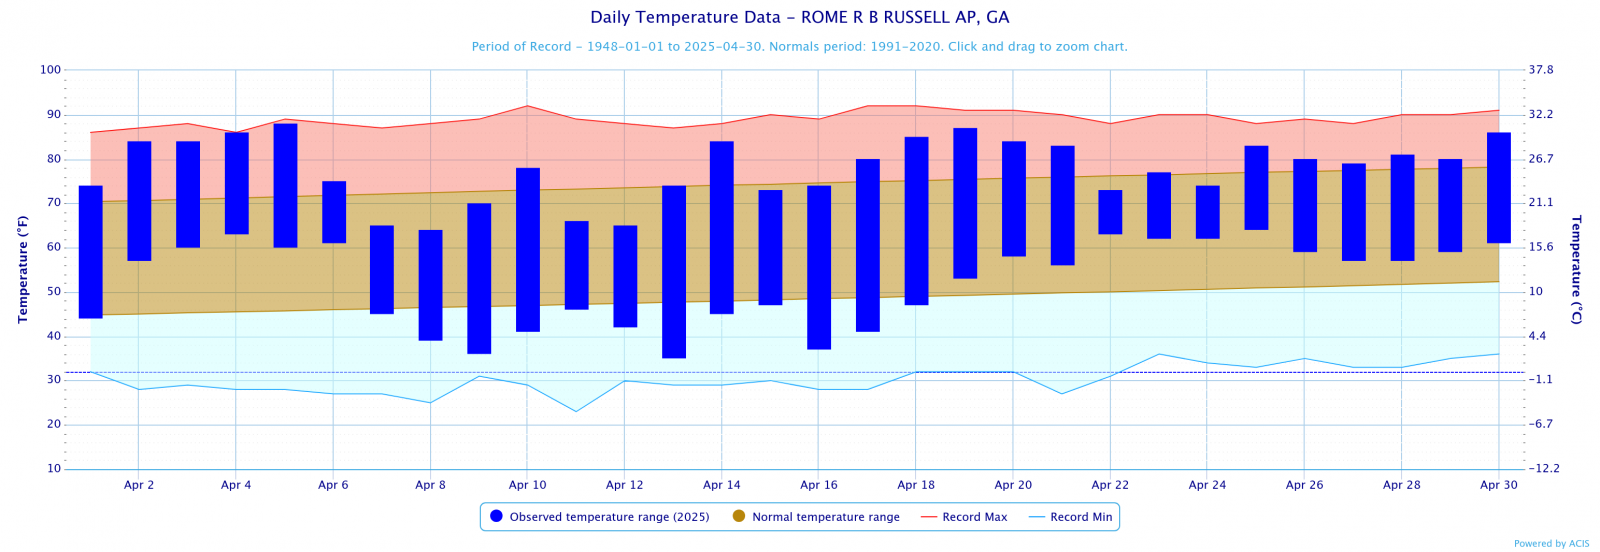
Rome
88
4/5
35
4/13
April 2025 Precipitation Climate Statistics
Average Precipitation
From Normal)
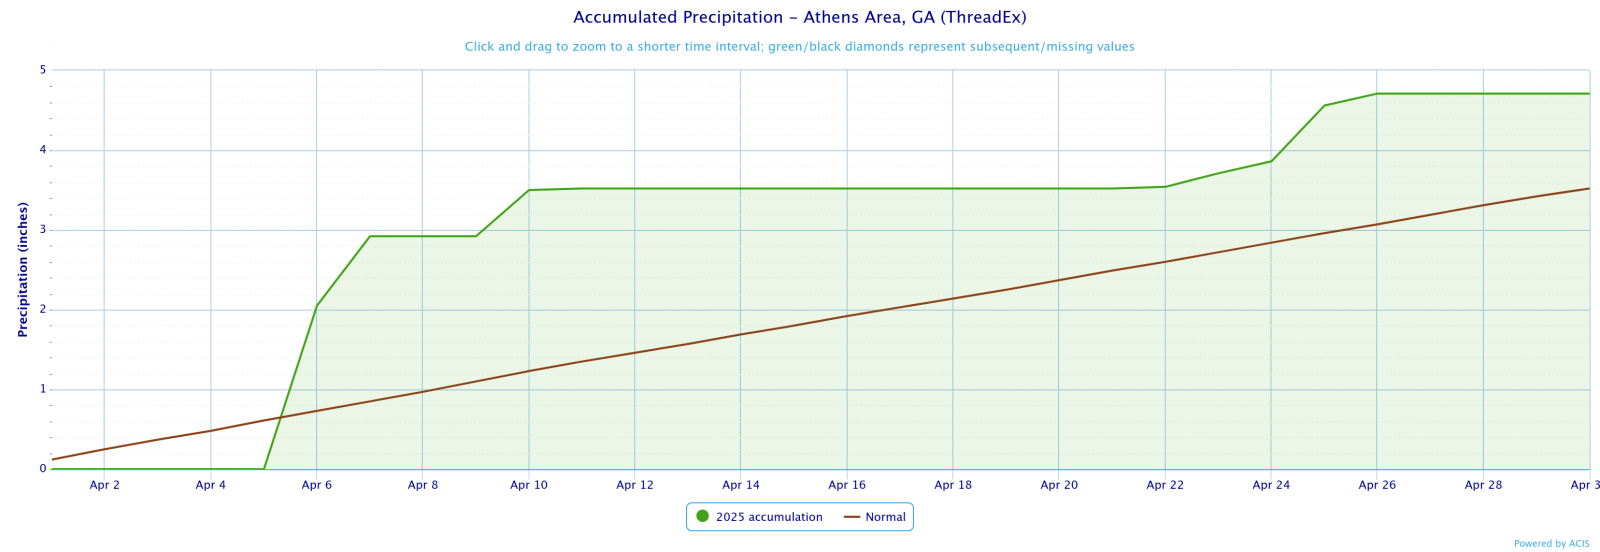
Athens
4.71
3.52
1.19
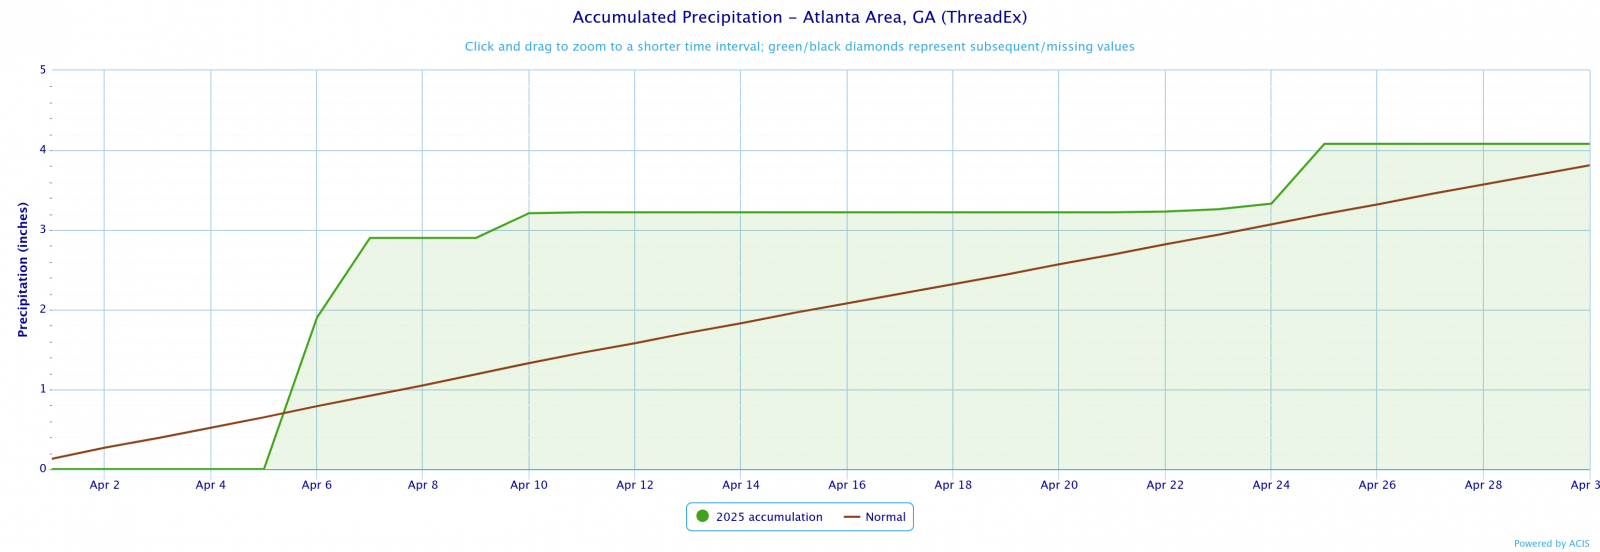
Atlanta
4.08
3.81
0.27
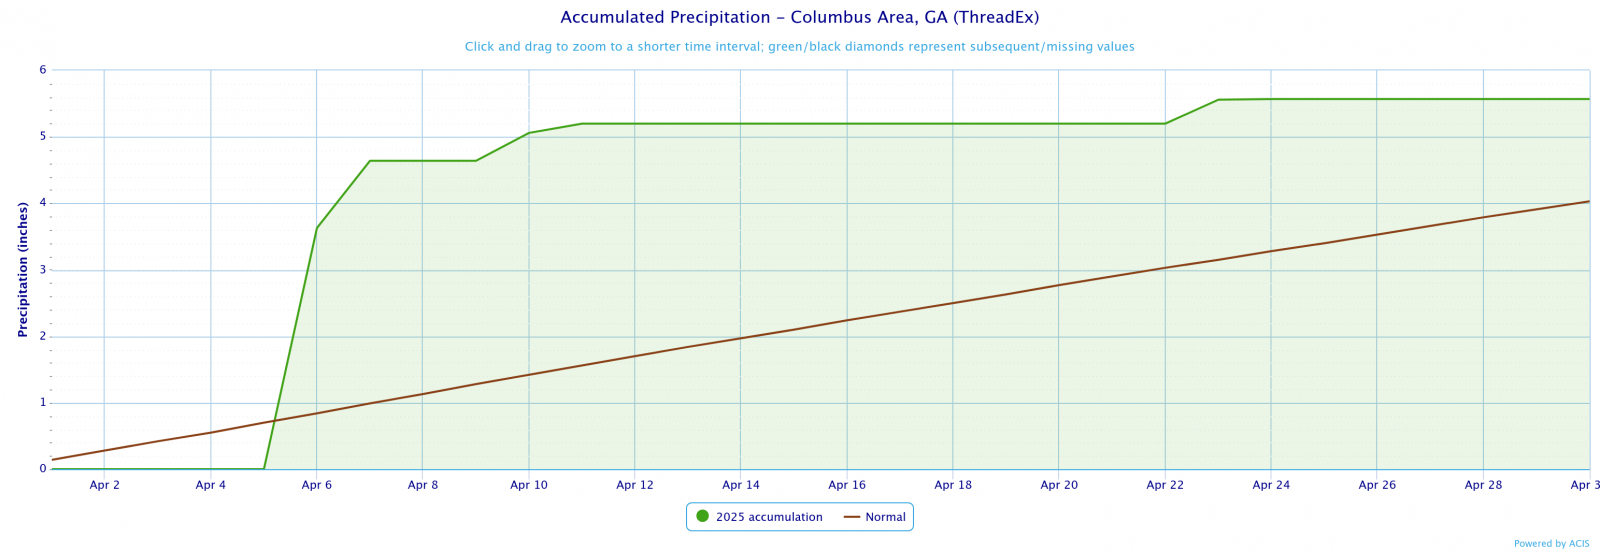
Columbus
5.57
4.03
1.54
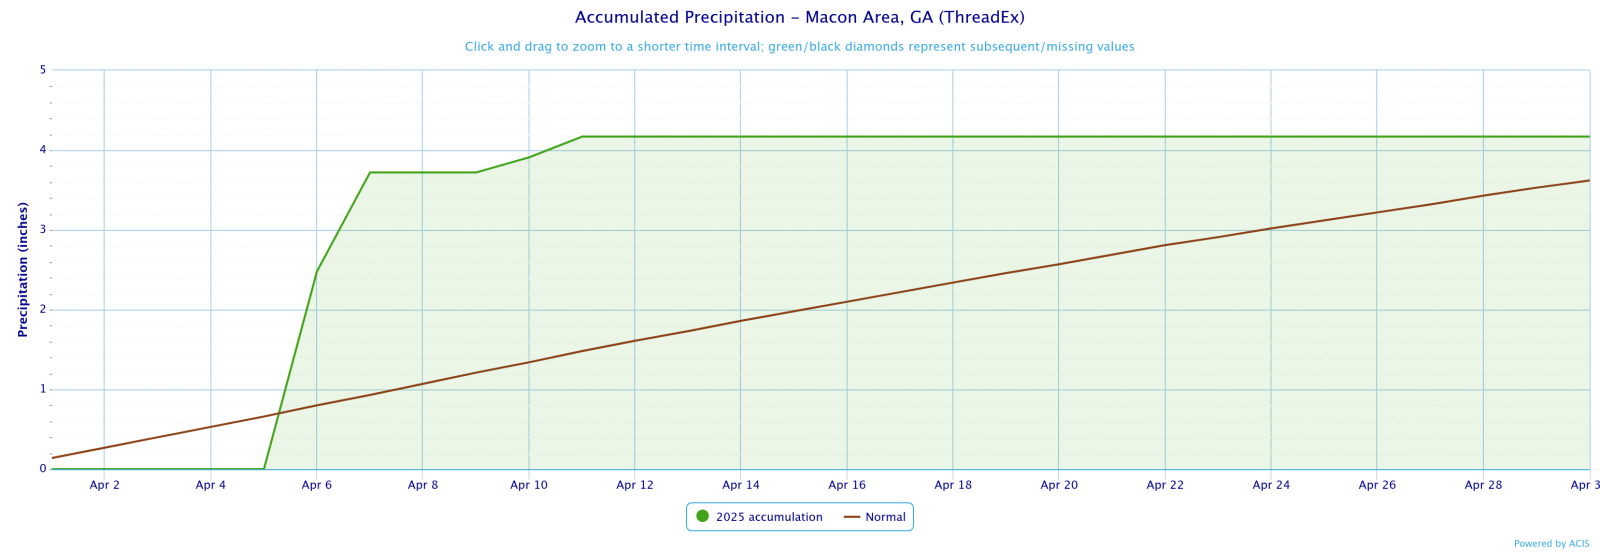
Macon
4.17
3.62
0.55
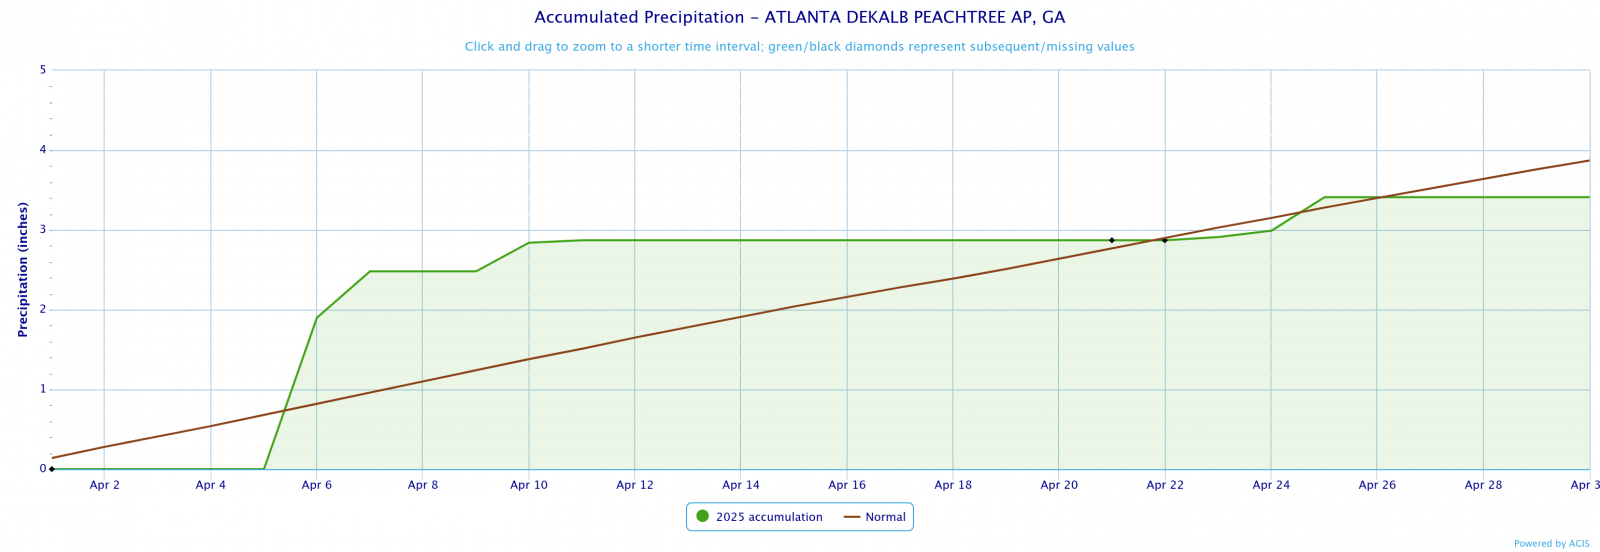
Dekalb Peachtree Arpt
3.41
3.87
-0.46
Fulton County Arpt
4.95
3.61
1.34
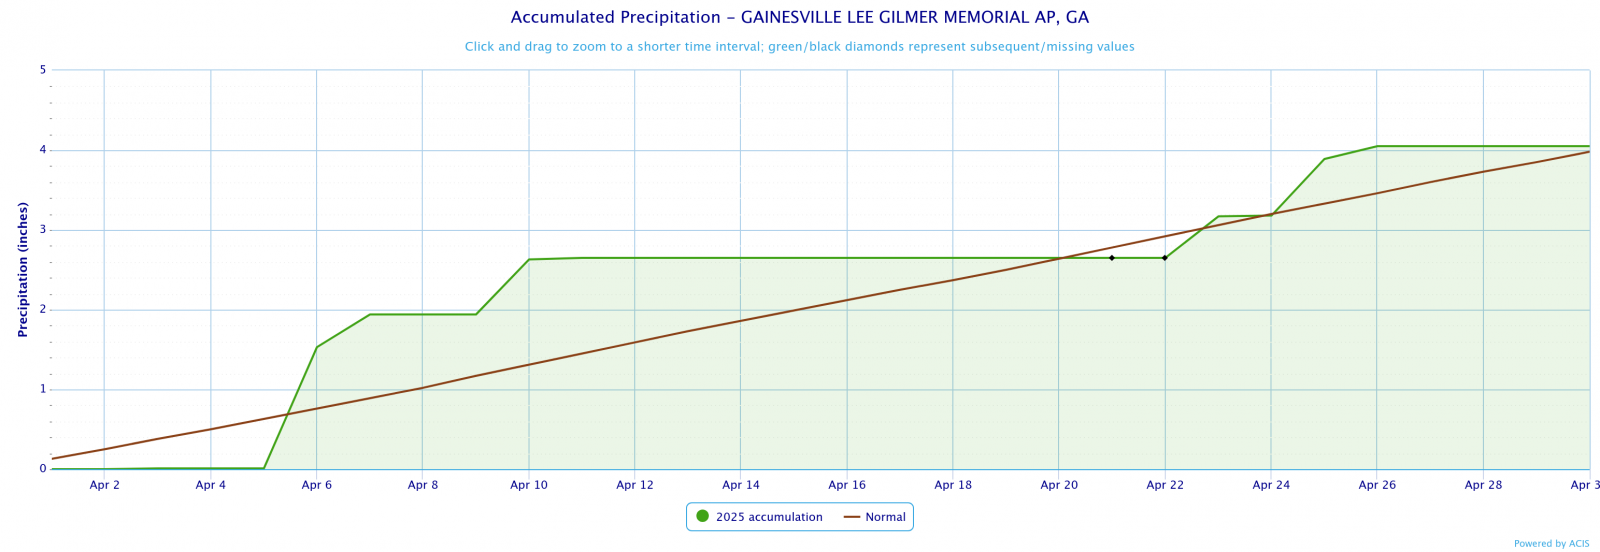
Gainesville
4.2
3.98
0.22
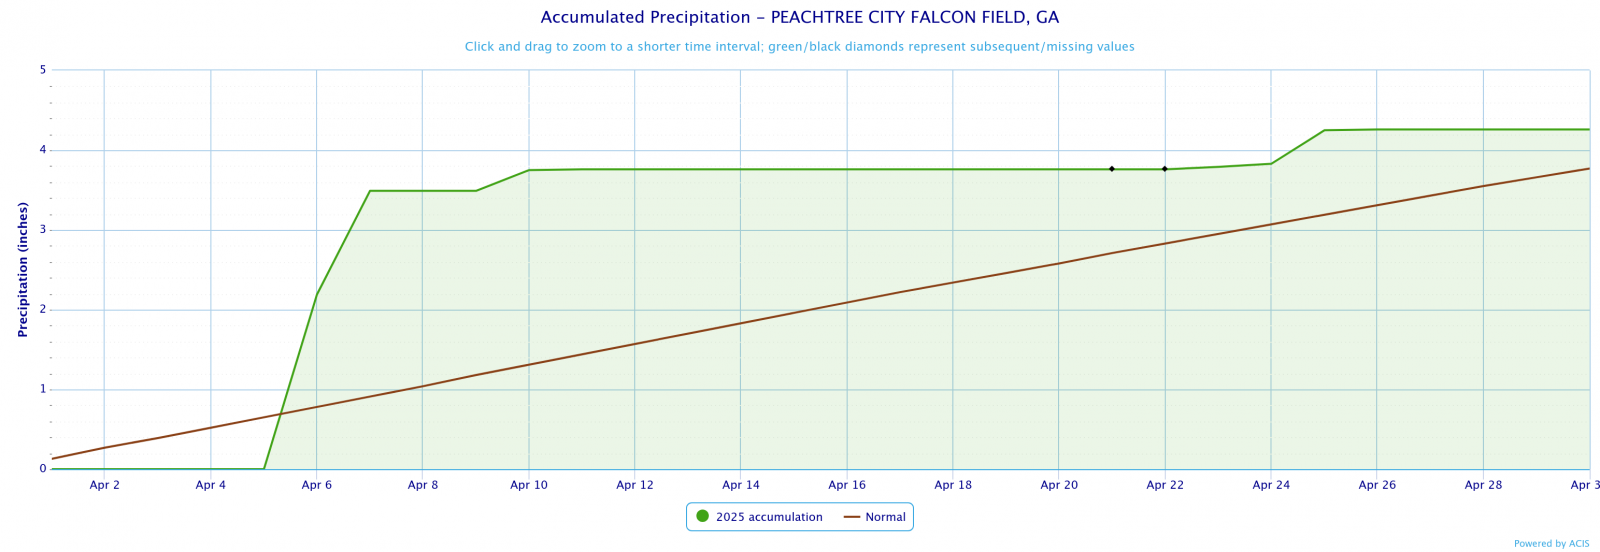
Peachtree City
4.31
3.77
0.54
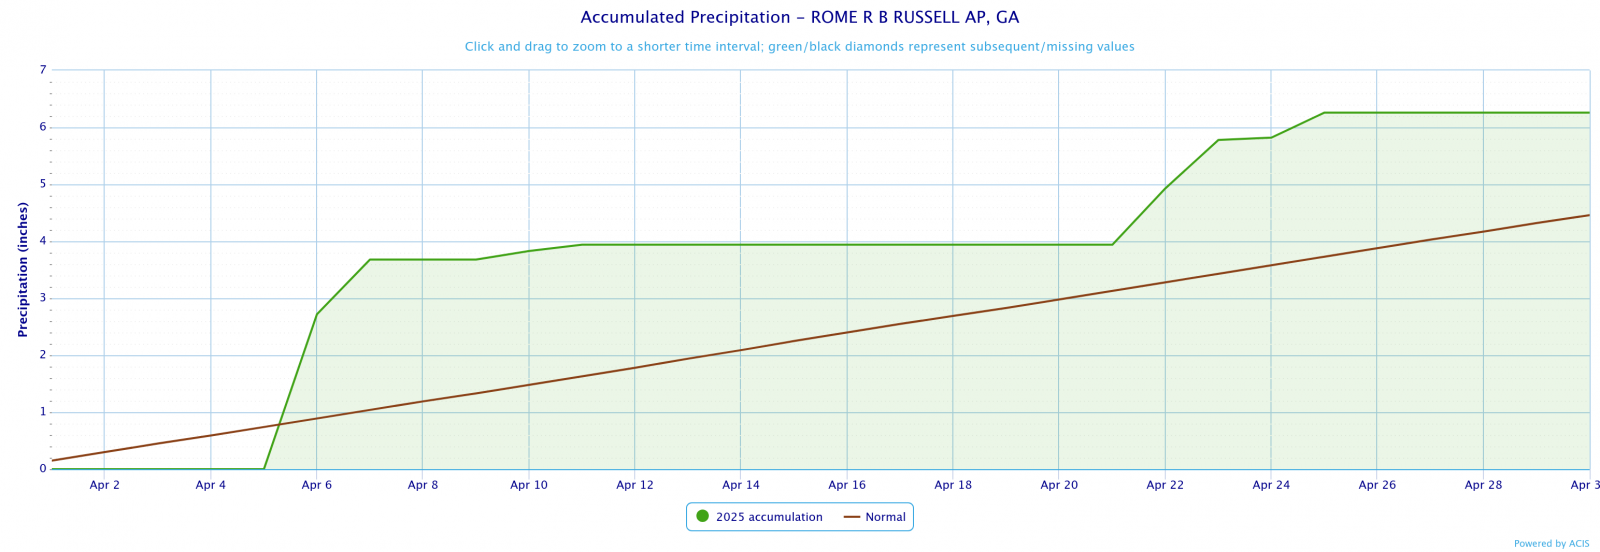
Rome
6.26
4.46
1.80
April 2025 Precipitation Climate Statistics
Athens
2.75
4/7
Atlanta
2.72
4/7
Columbus
4.50
4/7
Macon
3.66
4/7
Dekalb Peachtree Arpt
2.41
4/7
Fulton County Arpt
2.66
4/7
Gainesville
1.89
4/7
Peachtree City
3.35
4/7
Rome
3.58
4/7
Click the links below to explore the temperature and precipitation data across north and central Georgia for the month of April 2025.
Temperature Maps
Precipitation Maps
Temperature Graphs
Precipitation Graphs

Temperature and precipitation records at our 4 main climate sites are located below.
April 2025 Climate Records
Date
Type
Location
Records set over a 24 hour period
4/4
Max Temp
Atlanta
Atlanta rose to 87°F which breaks the record of 85 set in 1969.
4/4
Max Temp
Macon
Atlanta rose to 88°F which ties the record of 88 set in 1934.
4/4
Precipitation
Columbus
3.63 inches of rain fell in Columbus which breaks the record of 2.29 inches set in 1963.
Larger events that occurred across north and central Georgia this past March can be found here.
May Outlook